

About the Authors
DJ Summers, Director of Policy and Research
Ethan Tartaglia, Research Analyst
Chris Brown, Vice President of Policy and Research
About Common Sense Institute
Common Sense Institute is a non-partisan research organization dedicated to the protection and promotion of Colorado’s economy. CSI is at the forefront of important discussions concerning the future of free enterprise and aims to have an impact on the issues that matter most to Coloradans. CSI’s mission is to examine the fiscal impacts of policies, initiatives, and proposed laws so that Coloradans are educated and informed on issues impacting their lives. CSI employs rigorous research techniques and dynamic modeling to evaluate the potential impact of these measures on the Colorado economy and individual opportunity.
Teams & Fellows Statement
CSI is committed to independent, in-depth research that examines the impacts of policies, initiatives, and proposed laws so that Coloradans are educated and informed on issues impacting their lives. CSI’s commitment to institutional independence is rooted in the individual independence of our researchers, economists, and fellows. At the core of CSI’s mission is a belief in the power of the free enterprise system. Our work explores ideas that protect and promote jobs and the economy, and the CSI team and fellows take part in this pursuit with academic freedom. Our team’s work is informed by data-driven research and evidence. The views and opinions of fellows do not reflect the institutional views of CSI. CSI operates independently of any political party and does not take positions.
Summary
Over the last three years, Colorado has spent nearly $2 billion on homelessness, concentrated largely in the Denver metro region. While metro areas across the country have seen a surge of people experiencing homelessness, the Denver metro has some of the highest levels of growth among the areas the U.S. Department of Housing and Urban Development tracks.
There has been a 58% increase in the Denver metro’s unhoused population since 2016. More become homeless for the first time, and more are chronically homeless[i].
Multiple sources of fundings are allocated for myriad programs and services to support people experiencing homelessness. Some are associated with falling numbers of unhoused persons. Aurora and Colorado Springs have both seen homelessness abate while other cities’ populations grew.
Some of the recent growth in spending has been from one-time federal fundings which will not be there in coming years. In the meantime, public services including healthcare are stressed, and downtown Denver has yet to recover its pre-COVID economy.
The public and its representatives need a reliable accounting of what effectively removes people from a state of homelessness. It starts with improving accountability metrics using federally provided tools as other cities including San Antonio, Indianapolis and Miami have done. These track the pathways of unhoused individuals through the continuum, including a permanent housing solution.
Key Findings
- Between 2021 and 2023 more than $1.9 billion will be spent to address homelessness in the Denver metro region, an increase of 61% from $465 million to $749 million. Prior CSI analysis indicated this comes to $30,000-$60,000 per person.
- Spending for homelessness abatement hotels and motels breaks down to nearly $80,000 per room.
- At the same time spending increased, the total homeless population in the Denver metro area has grown from 5,728 in 2016 to 9,065 in 2023 – a 58% increase[ii].
- Among the 342 non-statewide areas tracked by U.S. Department of Housing and Urban Development (HUD), the Denver metro area’s homeless numbers grew by the 15th highest total between 2016 and 2022[iii]. Among major city areas, the Denver metro region has the nation’s tenth-highest number of people who are experiencing homelessness.
- One in three individuals experiencing homelessness are unsheltered, the highest rate it has ever been. The number of unsheltered metro homeless grew 247% in the last six years. The number of newly homeless grew 240% in the same time, and the number of chronically homeless grew 305%[iv].
- In 2023, 15% of the unhoused persons in the Denver metro area were under 18. This is a 73% rise over the previous year’s total[v].
- The growth in the homeless population has high human costs and puts strain on some resources beyond direct homeless services, while use of other resources such as housing remains unclear.
- More individuals experiencing homelessness died in Denver in 2022 than any of the previous four. One in every 21 of Denver’s unhoused persons died in 2022, 226 in total.
- Drug overdoses have become the single largest cause of death among Denver’s unhoused. Over half (56%) of the unhoused who died in Denver in 2022 died from a drug overdose, 126 in total. The drug overdose rate is over 20 times higher among unhoused individuals than the general population.
- Denver Health’s spending on homeless care has risen 34% in the last three years, $245 million in total in 2022[vi].
- Individuals experiencing homelessness are using more services per person at Denver Health, from 3.5 visits per person in 2019 to 4.1 in 2022[vii].
- Available emergency, transitional, and permanent shelter beds of most types are not fully participating in HMIS data gathering[viii].
- Because of the strain on certain systems and apparent underutilization of others, there needs to be a new approach to system-level reporting on the allocation of resources and outcomes of people who are being supported through the housing continuum of care.
- Tracking solutions include adopting a dashboard of existing collected data as other cities have done.
The Problem is Growing and Intensifying
Federal, state, and local and private funding to support individuals and families experiencing homelessness in the Denver metro area alone totaled $1.9 billion in 2021, 2022, and 2023.
In 2016, there were 10,550 unhoused persons counted in Colorado in the 2023 U.S. Department of Housing and Urban Development’s yearly Point in Time count that documents all unhoused individuals in a given area on a single night in January. In 2023, there were 12,483 unhoused persons [ix]– an 18% increase. The number is likely higher. The Denver Metro Homeless Initiative and other advocacy groups routinely flag the yearly PIT counts as inadequate tools that undercount homeless populations.
Levels of homelessness have grown at even higher rates in the Denver metro area, however, including for unsheltered homeless and chronically homeless individuals.
Figure 1
Figure 2
As with the general population, the bulk of Colorado’s homeless are located in the Denver metro area. The counties that comprise the Denver metro area contain about two-thirds of the state’s homeless, or 64%.
Homeless counts have grown more rapidly in the Denver metro than in Colorado as a whole. The total homeless population in the Denver metro area has grown from 5,728 in 2016 to 9,065 in 2023 – a 58% increase. This has well outpaced the metro’s general population, which grew 5% over the same period[x].
Cities across the U.S. have their own respective problems with homelessness, but Denver metro homelessness is more substantial than others.
Among the 342 non-statewide areas tracked by HUD, the Denver metro area’s homeless numbers grew by the 15th highest total between 2016 and 2022. Among major city areas, the Denver metro has the nation’s tenth-highest number of people who are experiencing homelessness[xi].
Denver is overrepresented as the major location for homelessness. Denver alone accounted for 64% of the metro’s homeless in 2023 while housing less than a quarter of its general population[xii].
While the Denver metro as a whole is seeing its homeless population grow, some cities have seen those numbers shrink. Between 2022 and 2023, Aurora’s homeless population decline 7%. Colorado Springs saw a 10% decline between 2019 and 2022.
Deaths
Homelessness has a high human cost, particularly in deaths by drug overdose and violence. One in every 21 of Denver’s unhoused persons died in 2022, according to the annual PIT count and data from the Denver Office of the Medical Examiner. More unhoused persons died in Denver in 2022 than any of the previous four years. In 2022, there were 226 unhoused persons who died from various causes, a 67% increase from 2018.
These deaths outpace other areas of public safety concern. There were more deaths among individuals experiencing homelessness in 2022 than there were gun homicide victims in the Denver metro area. There were 196 total firearm-related homicides in Adams, Arapahoe, Boulder, Broomfield, Denver, Douglas, Elbert, Jefferson, Larimer, and Weld counties combined in 2022[xiii].
Deaths among Denver’s unhoused rival or surpass other cities with similar issues. In the same year, 220 died in Seattle, 193 in 2021 in Portland’s Multnomah County, 311 in 2022 in San Diego, 204 in 2021 in Oakland, 3,183 in 2021 in Los Angeles County, 815 in in 2022 in New York City, 77 in 2022 in Washington, D.C., according to county and city medical examiner reports.
Social maladies cause more deaths among Denver’s homeless than natural causes.
Substance abuse and violence are responsible for more deaths among Denver’s homeless than other causes. Drug overdoses have become the single largest cause of death among Denver’s unhoused. Over half (56%) of the unhoused who died in Denver in 2022 died from a drug overdose, 126 in total. The share of homeless deaths attributed to overdose is now at its highest point in five years[xiv].
Another 9% were caused by stabbings, beatings, and shootings[xv].
Figure 3
Figure 4
In 2022, Denver’s homeless overdose death rate was over 20 times higher than that of Denver’s general population.
Exposure accounted for 5% of deaths between 2018 and 2022, while chronic disease accounted for 16% and infectious disease 7%.
COVID was not a main driver of unhoused persons’ deaths either in 2020 or in 2021, though there was an increase in the share of unhoused deaths attributed to infectious disease. Deaths attributed to infectious disease were 8% in 2020 and 11% in 2021. In other years, they hovered around 4-5%.
Kids without homes
Children are not immune to Colorado’s homelessness challenges.
Challenges facing Colorado youth have stacked up, including mental health, drug abuse, and suicide. Homelessness will compound these problems. There are hundreds of homeless unaccompanied children in the metro area, and the number has risen to its highest yet.
Children are losing shelter by the hundreds. In 2023, there were 1,383 unhoused persons in the Denver metro area who were under 18 – roughly one in every seven of the people experiencing homelessness. This is a 73% rise over the previous year’s total[xvi].
The issue extends beyond unaccompanied children. On any given year, roughly one-quarter of the homeless (23%) in the Denver metro are part of a household with both a parent and child[xvii].
More First-Time Unhoused Persons Than Ever Before and Staying Homeless for Longer
The issue is not only growing more pervasive over time, but more persistent and more intense. Higher numbers of people are becoming homelessness, more of them are unsheltered, and more of them are staying homeless for extended periods of time. The unsheltered, chronic, and newly homeless subgroups of the Denver metro’s homeless population have more than tripled in the last five years.
The number of unsheltered metro homeless grew 247% in the last six years, rising from 797 unsheltered in 2016 to 2,763 in 2023. The number of newly homeless grew 240%, from 1,068 in 2017 to 3,626 in 2023. The number of chronically homeless grew 305%, from 739 in 2016 to 2,991 in 2023[xviii].
A higher share of the unhoused population is unsheltered now than in the past. The share of the total unhoused population that is unsheltered grew from 14% in 2016 to 30% in 2023[xix].
Figure 5
| Metro Denver Homeless Population Growth | ||||||
| 2020 | 2022 | 2023 | 2020 to 2022 % Difference | 2020 to 2023% Difference | 2022 to 2023 % Difference | |
| Total Homeless | 6,104 | 6,684 | 9,065 | +10% | +49% | +37% |
| Unsheltered | 1,561 | 2078 | 2,763 | +33% | +77% | +33% |
| Newly Homeless | N/A | 2,455 | 3,626 | N/A | N/A | +48% |
Table 2
| City of Denver Homeless Population Growth | ||||||
| 2020 | 2022 | 2023 | 2020 to 2022 % Difference | 2020 to 2023% Difference | 2022 to 2023 % Difference | |
| Total Homeless | 4,171 | 4,794 | 5,818 | +15% | +40% | +21% |
| Unsheltered | 996 | 1,313 | 1,423 | +32% | +43% | +8% |
| Newly Homeless | 1,071 | 1,475 | 2,327 | +37% | +117% | +58% |
Spending is Growing
Colorado cities are spending more than ever on homelessness even as the problem worsens.
The Common Sense Institute tracked homelessness-related spending from two major sources – government agencies and associated non-profit organizations. Much of the spending on homelessness funnels from government grants to these non-profits to administer services to the unhoused.
Through FY24, the Colorado state government plans to spend an additional $200 million on homelessness initiatives atop another $45 million it already distributed in FY21. This doesn’t include local and federal spending.
In the Denver metro, estimated spending has grown 61%. This includes spending for equivalent programs and services in Denver, Aurora, and Boulder. In total, programs and services grew from $465 million in 2021 to $749 million in 2023[xx].
The lion’s share of spending occurs in Denver. Colorado’s largest city represents 86% of metro spending. The Denver metro region holds the lion’s share of the state’s unhoused persons. Denver alone accounted for 64% of the state’s homeless in 2022 while housing only 12% of the state’s population[xxi].
Denver’s spending grew 62% from 2021 to 2023. In that time, the city and associated organizations added $275 million in new homelessness spending from multiple sources[xxii].
In 2021, the city allocated $393 million for homelessness-related services and projects. This includes the total expenses for Denver Police Department, Denver Fire Department, Denver Health, the Denver Department of Housing Stability (HOST), homeless encampment cleaning contracts, and non-profits dedicated to homelessness. In fiscal year 2023, homelessness-related expenses in these categories grew to $635 million[xxiii].
Current spending includes:
- $254 million – Denver Health
- $225 million – Denver non-profit spending
- $58 million – New budgeted federal spending
- $50 million – New budgeted HOST spending
- $44 million – New budgeted state spending
Collectively, the Denver metro region has spent $1.9 billion on homelessness in the last three years, spending an average of $485 million per year – about $164 per Denverite and between $30,000 and $60,0000 per person experiencing homelessness. Previous CSI research has identified similar spending ranges in other Colorado cities. In Fort Collins, for example, services and programs amount to between $38,000 – $95,000 per person experiencing homelessness.
Figure 6
Figure 7
Bang for the buck
Advocates and Denver city officials insist the problem requires more housing, and indeed much of the money spent has gone towards purchasing and constructing new emergency, temporary, transitional, and permanent supporting housing for the unhoused.
Currently in Denver, homelessness spending directed towards shelter can be broken down into hotel spending and tiny home spending. Since December of 2020 there has been $69 million spent on purchasing 869 rooms in hotels and motels.
This breaks down to $79,497 per room.
At least $48.6 million will go to Denver Mayor Michael Johnston’s 2023 House 1,000 initiative, which plans to house 1,000 homeless in tiny homes and pallet shelters which will be located around the city[xxiv].
Figure 8: Mayor Johnston’s Map of Proposed Locations for Micro Communities
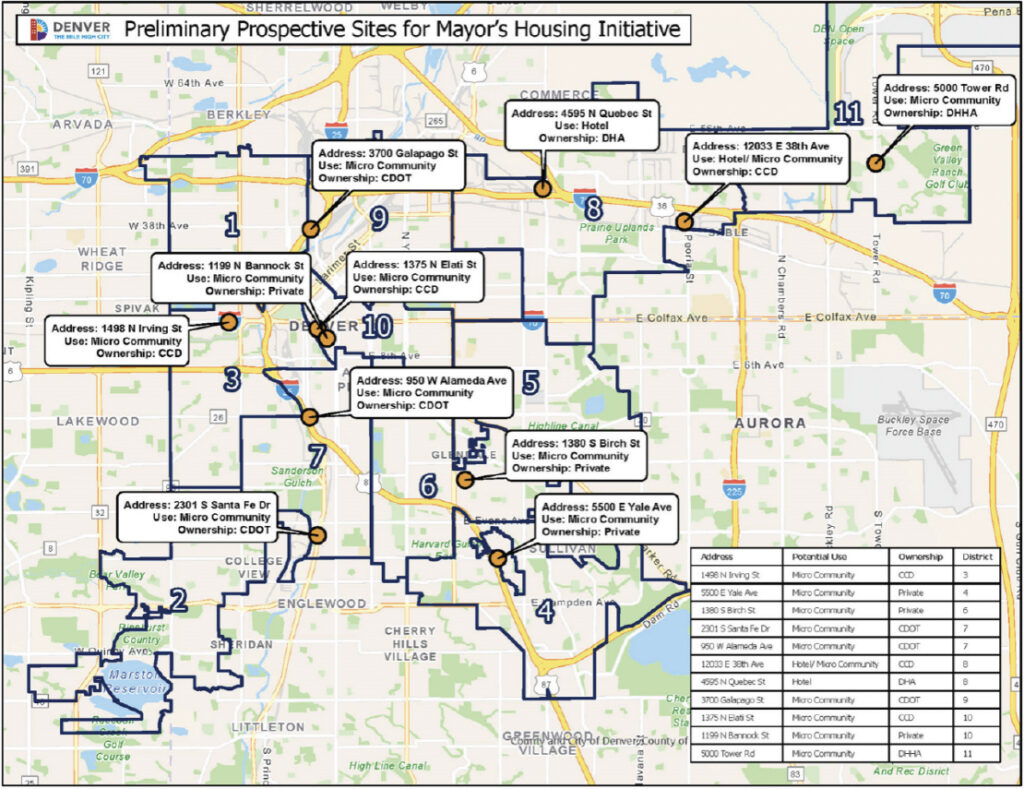
At least $19.6 million will go to build the tiny homes as well as operate the sites. The current plan is to build 200 tiny homes, which will include 540 beds. That is $98,000 per tiny home, and $32,296 per bed[xxv].
Though some have been growing, Housing Inventory Counts show that none of the Denver metro’s housing offerings for individuals experiencing homelessness have ever fully participated in the region’s data management efforts through HMIS, with two exceptions.
Participation rates for emergency shelters have climbed rapidly, from 43% in 2016 to 82% in 2022. Participation rates for other housing options, however, have either stayed flat or fallen[xxvi].
Figure 9
Figure 10
Transitional housing participation rates have fallen from 73% to 45% in the same time. Safe haven housing rates have stayed relatively flat from 62% to 60%. Permanent supportive housing rates have fallen from 90% to 67%. Other permanent housing rates have fallen from 100% to 36%. Only rapid rehousing beds have a participation rate which hovers between 99% and 100%[xxvii].
Recent reports suggest a problem retaining unhoused individuals in shelter programs. Metro Denver Homeless Initiative estimates roughly half the unhoused people who used a sanctioned campsite went back to homelessness afterward, as cited in a Denverite report[xxviii]. Prior reporting from the city showed even in the midst of the pandemic in 2020 that there remained sufficient shelter capacity.
Healthcare System and Denver Health
The costs of healthcare for individuals experiencing homelessness places a strain on healthcare resources as numbers rise and use becomes both more concentrated and more frequent.
All hospitals in the metro area provide some amount care for people experiencing homelessness. CSI focused on Denver Health, which represented one-sixth of all charity care charges in the state in 2022 and has a positive mandate to provide care to anyone who walks through its doors regardless of ability to pay. For this healthcare provider alone, care for unhoused individuals grew 34% between 2019 and 2022, from $189 million to $254 million[xxix]. Despite the growth in homeless patients, Denver Health’s annual payment of approximately $30.7 million from the city for the medically indigent has been flat since 2014.
Rising costs are partially due to the rising number of unhoused individuals. In total, there were 8,549 in-state homeless individuals served by Denver Health in 2022, a 10% rise since 2019. They accumulated 30,144 visits overall, a 16% increase since 2019[xxx].
Rising costs are also higher because care for individuals experiencing homelessness is more expensive per person.
Denver Health resources are disproportionately taxed by homeless visits. The average length of stay for a homeless person is twice as long as the average length of stay for a non-homeless person. Healthcare providers keep individuals experiencing homelessness in the hospital longer as a form of preventative care. Additional space requires additional costs. Denver Health is currently paying for homeless care recuperative beds at Denver’s Stout Street Clinic and for transitional units at 655 Broadway for $855,000[xxxi].
Costs are amplified because unhoused individuals use more and more services per person as the population grows, which raises the overall per person spending on homeless services. The number of annual Denver Health visits per homeless user grew from 3.5 in 2020 to 4.1 in 2022[xxxii].
Figure 11
Costs for homeless visits are therefore rising. The average charge for a homeless visit is rising. Over the last four years, Denver Health reports an increase of $6,266 in 2019 to $7,247 in 2022 – a 16% increase. Charges per homeless user are up as well, from $24,372 in 2019 to $29,662 in 2022 – a 22% increase[xxxiii].
Spillover from non-Denver homeless populations is raising costs as well. The percentage of non-Denver County homeless persons coming to Denver Health has gone up from 7% in 2019 to 16% in 2022, incurring $39,629,524 in charges at Denver Health in 2022[xxxiv].
Figure 12
Figure 13
Downtown recovery
Homelessness has measurable spillover impacts on the economy, as it plays a role in the emptying of urban cores in cities with high PIT counts.
Like most cities, Denver’s downtown core saw plummeting foot traffic during the global COVID-19 pandemic. Quarantine and distancing measures sparked a remote work boom and restaurants and bars could not hold customers due to capacity restrictions. In the pandemic’s wake, many of these downtown cores have still not recovered the amount of foot traffic they had. Apart from the pandemic’s economic interruptions including office vacancy rates, researchers point to perceptions of crime and homelessness as one of the reasons.
Denver’s downtown has still not recovered its pre-pandemic foot traffic, according to an ongoing analysis of mobile phone location data performed by University of Toronto researchers. Downtown Denver’s foot traffic between March and May of 2023 was only 56% what it was in the same period in 2019[xxxv]. Among the 62 U.S. and Canadian cities tracked, Denver’s downtown foot traffic recovery ranks 39th.
Figure 14
Need for System Accountability and Transparency
Given the amount of spending and the broadly experienced impacts of the homelessness issue, additional public-facing data to inform stakeholders of real-time progress in reaching, serving, and ultimately freeing unhoused people of the potential cycle of chronic homelessness could be valuable.
The City of Denver does employ a variety of tracking tools. Most recently, the City of Denver’s administration launched a dashboard[xxxvi] to track the outcomes of his initiative to house 1,000 homeless in 2023. This dashboard reports how many unhoused people the program has housed and how many have sprung into permanent housing, be it subsidized or privately rented or owned.
The dashboard is a valuable tool, and a welcome starting point to enhance public transparency, however additional data at a system-level will be needed to enhance transparency, achieve real change and inform the public.
Federal databases offer simple and readily available solutions to bolster existing tracking mechanisms.
Other cities and metro areas, including San Antonio[xxxvii], Indianapolis[xxxviii], and Miami[xxxix] have implemented data dashboards and reporting services that finely parse information on homeless expenditures, services, and exits. The Metro Denver Homeless Initiative is taking similar strides in collecting individual “by-name” data that will track the pathway of every adult through the homelessness services system. In a 2022 release, MDHI said the entire nine-region Denver metro Continuum of Care area will have such data collection operational by December 31, 2027.
The U.S. Department of Housing and Urban Development allows cities to track a person’s journey through the homelessness system. Stella Performance (Stella P)[xl] is a data visualization of the Longitudinal Systems Analysis (LSA) dataset to help communities understand how their homeless response system has been performing on critical performance measures. The tool focuses on three critical performance metrics:
- Number of days homeless (Days Homeless)
- Exits from the homeless system to permanent destinations (Exits)
- Returns to the homeless system after exits to permanent destinations (Returns)
- Track outcomes by city to the extent possible in order to monitor the extent to which disparate policies and tactics have different outcomes.
Conclusion
The homelessness crisis in Colorado, particularly in the Denver metro area, has reached alarming levels measured both in human and in economic costs.
Key findings highlight the severity of the situation, including an 18% increase in the homeless population since 2016, a 58% increase in the Denver metro area alone, and a 240% rise in newly homeless individuals. Children are increasingly affected, with a 600% increase in homeless unaccompanied children since 2016. Tragically, more unhoused individuals are dying, with drug overdoses and violence being significant contributors to these deaths.
Spending on homelessness has surged, with the Denver metro area witnessing a 61% increase in estimated spending, primarily driven by Denver itself. However, this investment hasn’t yielded the desired results, as available shelter beds often go unused, even though there has been a 28% increase in year-round beds since 2016.
Leaders should implement a new system of accountability and transparency to address the crisis. This includes using regional databases and tracking tools to monitor the progress of homeless individuals through the system and diligently tracking spending, considering the escalating costs and the uncertain future of funding sources.
In conclusion, Colorado’s homelessness problem is not only growing but intensifying, affecting the lives of thousands of individuals and straining resources across various sectors. It is crucial for leaders and stakeholders to adopt a data-driven approach to address this crisis effectively, ensuring that the substantial investments result in progress toward ending homelessness and providing support and shelter to those in need. Immediate action is required to prevent this issue from becoming an even more significant and enduring problem for Colorado.
Homelessness Expenditure Methodology
Expenditures
The development of the summary estimates for expenditures within the homeless serving ecosystem in Metro Denver can be separated into two parts. The first category of spending is the historical annual baseline. The other category is new spending, not captured in the historic annual baseline, that has either been spent directly by agencies or is included in recent state and municipal budget allocations and has yet to be distributed to providers.
Part 1: Annual Baseline
The annual baseline level reflects an estimate of the recurring expenditures in the homeless serving ecosystem within the Denver metropolitan area. Because of the complexity related to revenue sources flowing into the ecosystem, total expenditures are captured, not revenue, to avoid any double counting of funds.
CSI undertook a lengthy process to review each expense to remove any dollars that would be re-granted to other organizations, to ensure no significant double counting occurred. We also allowed for many organizations to provide direct feedback on the expenditures we captured to provide further insights on any areas where double counting may occur. Ultimately, the total expenses related to homelessness captured in the report are only 43% of total expenses listed for non-profit agencies included.
- Financial information came from 48 major non-profit providers including: program service and total expenditures from their latest Forms 990, the Colorado Secretary of State’s website, annual reports, or from organizations who provided financial information to CSI.
- In most cases annual expenditures are through 2021, though several included only had information available for 2018–2019.
Municipal spending captured in the baseline reflect estimates of spending from the City of Denver, City of Aurora, and City of Boulder that include direct services and administrative expenses towards homelessness.
Other organizations that have direct spending related to individuals experiencing homelessness, e.g., Denver Health, were also included. Denver Health submits an annual report to the City of Denver that captures their expenses from homeless individuals. The report does not specify the share that is uncompensated care or paid by insurance.
Part 2: Newly Proposed Expenditures
As noted, all financial information collected from the non-profits were from either fiscal year 2019, 2020, or 2021. Since 2021, various municipal and state budget proposals, ballot initiatives, and federal dollars have allocated or will allocate additional funds towards homelessness that are not captured in the annual baseline, as they were not spent or distributed at the time of filing. Many of these are one-time allocated expenses, and it is important to note that these are budgeted but not yet spent. This includes items such as:
- State of Colorado FY22 and FY23 budgets
- Cities of Denver, Aurora and Boulder FY22 and FY23 budgets
- Recent funding approved by municipal ballot measures not spent in baseline year
Though some non-profit service providers may also be experiencing increases in private contributions, no assumptions were made to increase the annual baseline.
Estimates of Population Served by Expenditures
CSI used a range to capture the homeless related expenditures relative to the number of people being served. This report has considered many different opinions from stakeholders on the best way to reflect the homelessness population. Though there is not a consensus on the best approach, the following three estimates provide a range that covers a daily average, and the total number of people who become homeless, even if just for a brief amount of time.
Estimates 1 and 2 show a range in the daily average number of people who are counted as homeless, as well as those in the Homeless Continuum of Care that are housed in permanent supportive housing. Estimate 3 provides a cumulative count of individuals over the course of a year.
Estimate 1 – PIT + PSH = The total number of individuals experiencing homelessness captured in the annual Point-in-time count plus 98% of the total number of permanent supportive housing units.[xxiv]
Estimate 2 – PIT x 2.5 + PSH = The total number of individuals experiencing homelessness captured in the annual Point-in-Time count multiplied by 2.5, plus 98% of the total number of permanent supportive housing units. Given the PIT count occurs on a single night, key stakeholders recommended multiplying the PIT count by a factor of 2.5 for an annualized count. This method for estimating the annual count of people experiencing homelessness is used by Colorado Coalition for the Homeless, St. Francis Center, Urban Peak and other stakeholders. While just an approximation, considering an annual count of people experiencing homelessness is helpful in considering the scope of this issue.
Estimate 3 – MDHI reported total count = The Metro Denver Homeless Initiative publishes an annual estimate of the number of individuals who access services through the regional Continuum of Care tracked within their Homeless Management Information System (HMIS).
Data Notes
Regional assumptions: Each organization’s spending is based on the location of its headquarters. However, if an organization has headquarters in a city within Metro Denver but also operates outside of the metro Denver region, we only counted estimated expenditures within the region as described below.
Several steps were taken to share out the total expenditures of some organizations to both just within the metro Denver region and to within the municipal boundaries of Aurora, Boulder, Denver and/or the rest of metro Denver.
Both supporting evidence from financial reports and direct feedback from providers helped to inform an assumed share of spending among report regions. All assumptions are noted in list of service providers in Appendix E. As an example, if a permanent housing provider has 2/3 of building locations in Denver, then 2/3 of spending would be assumed to occur in that city. In cases where there was not supporting evidence, or none was provided by the organization, then spending was assumed to be distributed across regions based on the share of individuals experiencing homelessness across regions from the PIT count.
Expenditures Not Captured
The expenditures in this analysis are not comprehensive with regards to capturing every organization that touches the homelessness ecosystem. The figures are collected from a wide range of sources, as there is no reporting requirement among all non-profits and public agencies to isolate expenditures related to homelessness.
The primary known areas not included in this report’s expenditure analysis include the following:
- Additional non-profit entities – There are other organizations outside of the 48 captured in this report that serve and support the homeless. It may only be a small portion of their organization’s mission and therefore do not isolate their financial commitments to just homelessness-related services.
- Examples of non-profit organizations not captured:
- Community Table
- Food Bank of the Rockies
- Growing Home
- Jewish Family Service of Colorado
- Mosaic Church of Aurora
- Examples of non-profit organizations not captured:
- Affordable housing authorities – Municipal housing authorities can play a key role in the homelessness ecosystem. While most of their spending is related to low-income housing support, one expert estimated agency expenditures on supportive housing for the current and formerly homeless to be around 20% to 30%, but it would fluctuate by region.
- Denver Housing Authority
- Aurora Housing Authority
- All health care expenses – The only two health care facilities captured in this expenditure analysis are Denver Health and the Stout Street Clinic. The City of Denver requires Denver Health to submit an annual report capturing their total costs related to homelessness. Stout Street Clinic is a Denver-based health care facility dedicated to serving the homeless. It is operated by the Colorado Coalition for the Homeless and therefore is captured in their Form 990 expenses.
- Most mental health expenses – Many organizations that provide mental health care designate some of their services for the homeless population, but these services typically constitute very small shares of their total spending. This analysis seeks to capture only what these groups spend specifically on homeless patients and, as a result, includes only relatively small amounts of their total expenditures at most. These include:
- AllHealth Network (0%)
- Aurora Mental Health Center (less than 1%)
- Jefferson Center for Mental Health (0%)
- Mental Health Center of Boulder County (0%)
- WellPower (15%)
- All other municipal spending – The only three city budget items reflected in this report are from Denver, Aurora, and Boulder. Every other municipality in the Denver metro likely has similar expenses related to police, fire, and other services, which are not granted to non-profits. Those other municipalities are not captured here.
- Court and jail-related spending – Other reports that estimate costs of individuals experiencing homelessness, such as those conducted by the Urban Institute for a review of Denver’s Social Impact Bond program, include expenses related to jail and courts. None of these expenses were included in this report.
REFERENCES
[i] https://www.mdhi.org/pit
[ii] https://static1.squarespace.com/static/5fea50c73853910bc4679c13/t/64be8b091511a30f2c647037/1690209034029/Metro+Denver+PIT+Factsheet+2023.pdf
[iii] 2007-2022-HIC-Counts-by-CoC.xlsx (live.com)
[v] https://www.mdhi.org/pit
[vi] https://www.denverhealth.org/-/media/2022-denverhealth-reporttothecity-digital.pdf
[vii] https://www.denverhealth.org/-/media/2022-denverhealth-reporttothecity-digital.pdf
[viii] https://www.hudexchange.info/resource/3031/pit-and-hic-data-since-2007/
[ix] https://www.hudexchange.info/resource/3031/pit-and-hic-data-since-2007/
[x] https://www.mdhi.org/pit
[xi] https://www.hudexchange.info/resource/3031/pit-and-hic-data-since-2007/
[xii] https://www.hudexchange.info/resource/3031/pit-and-hic-data-since-2007/
[xiii] https://denvergov.org/Government/Agencies-Departments-Offices/Agencies-Departments-Offices-Directory/Public-Health-Environment/Medical-Examiner/Medical-Examiner-Data#section-2
[xiv] https://denvergov.org/Government/Agencies-Departments-Offices/Agencies-Departments-Offices-Directory/Public-Health-Environment/Medical-Examiner/Medical-Examiner-Data#section-2
[xv] https://denvergov.org/Government/Agencies-Departments-Offices/Agencies-Departments-Offices-Directory/Public-Health-Environment/Medical-Examiner/Medical-Examiner-Data#section-2
[xvi] https://www.mdhi.org/pit
[xvii] https://www.mdhi.org/pit
[xviii] https://www.mdhi.org/pit
[xix] https://www.mdhi.org/pit
[xx] https://commonsenseinstituteco.org/homelessness-in-metro-denver/
[xxi] https://www.denverhealth.org/-/media/2022-denverhealth-reporttothecity-digital.pdf https://static1.squarespace.com/static/5fea50c73853910bc4679c13/t/64be8b091511a30f2c647037/1690209034029/Metro+Denver+PIT+Factsheet+2023.pdf
[xxii] https://commonsenseinstituteco.org/homelessness-in-metro-denver/
[xxiii] https://commonsenseinstituteco.org/homelessness-in-metro-denver/
[xxiv] https://denverite.com/2023/09/12/mayor-mike-johnston-plans-to-spend-48-6-million-to-get-1000-people-off-denvers-streets/
[xxv] https://denvergov.org/Government/Agencies-Departments-Offices/Agencies-Departments-Offices-Directory/Mayors-Office/News/2023/2023-House1000-Budget
[xxvi] https://www.hudexchange.info/resource/3031/pit-and-hic-data-since-2007/
[xxvii] https://www.hudexchange.info/resource/3031/pit-and-hic-data-since-2007/
[xxviii] https://denverite.com/2023/09/27/denver-homelessness-sanctioned-campsites-micro-communities/
[xxix] https://www.denverhealth.org/about-denver-health/annual-reports
[xxx] https://www.denverhealth.org/about-denver-health/annual-reports
[xxxi] https://www.denverhealth.org/about-denver-health/annual-reports
[xxxii] https://www.denverhealth.org/about-denver-health/annual-reports
[xxxiii] https://www.denverhealth.org/about-denver-health/annual-reports
[xxxiv] https://www.denverhealth.org/about-denver-health/annual-reports
[xxxv] https://downtownrecovery.com/charts/rankings
[xxxvi] https://denvergov.org/Government/Agencies-Departments-Offices/Agencies-Departments-Offices-Directory/Mayors-Office/Programs-and-Initiatives/Homelessness-Initiative/House-1000-Dashboard
[xxxvii] https://www.havenforhope.org/hmis-about-us/
[xxxviii] https://www.indycoc.org/system-performance.html
[xxxix] https://www.homelesstrust.org/resources-homeless/library/2022/2022-miami-dade-gaps-and-needs-report.pdf
[xl] https://www.hudexchange.info/resource/5827/stella-p-quick-start-guide/