

ABOUT THE AUTHORS
Chris Brown is the Vice President of Policy and Research with the Common Sense Institute where he leads the research efforts of CSI to provide insightful, accurate, and actionable information on the implications of public policy issues throughout the state of Colorado.
Cole Anderson is a Research Analyst for Common Sense Institute. Cole graduated from the University of Denver with a degree in public policy and economics before he joined CSI in 2022.
Erik Gamm is a Research Analyst for Common Sense Institute. His experience covers analyzing workforce, health care, and education issues in the state of Colorado.
Teams & Fellows Statement
CSI is committed to independent, in-depth research that examines the impacts of policies, initiatives, and proposed laws so that Coloradans are educated and informed on issues impacting their lives. CSI’s commitment to institutional independence is rooted in the individual independence of our researchers, economists, and fellows.
At the core of CSI’s mission is a belief in the power of the free enterprise system. Our work explores ideas that protect and promote jobs and the economy, and the CSI team and fellows take part in this pursuit with academic freedom. Our team’s work is driven by data-driven research and evidence. The views and opinions of the team and fellows do not reflect institutional views of CSI. CSI operates independently of any political party and does not take positions.
Report Reviewers
Jamie Van Leeuwen and Larry Yonker supported this report as reviewers. The role of the reviewer is explicitly to help identify leaders in the field and to serve as a liaison to providers and key leaders working on homelessness to help inform the report. They are neither spokespersons nor authors of this report.
Jamie Van Leeuwen completed his PhD in Public Policy at the Graduate School of Public Affairs at the University of Colorado Denver with an emphasis on affordable housing and homelessness. He has a Master’s degree in International Public Health and a Master’s degree in Sociology from Tulane University. He was a Fulbright Scholar in 2013 and a Woodrow Wilson International Fellow in 2017. His work focuses on domestic and international poverty alleviation, specifically targeting homeless and vulnerable youth globally.
Larry Yonker served as the President and CEO at Springs Rescue Mission serving individuals who are homeless including those struggling with mental illness and addiction. Under his leadership, the organization partnered with the City of Colorado Springs to build a 14-acre Homeless Resource Campus called the Community of Hope. The campus offers emergency, transitional, and permanent housing, mental and physical health care services, and addiction recovery support.
ABOUT COMMON SENSE INSTITUTE
Common Sense Institute is a non-partisan research organization dedicated to the protection and promotion of Colorado’s economy. CSI is at the forefront of important discussions concerning the future of free enterprise in Colorado and aims to have an impact on the issues that matter most to Coloradans.
CSI’s mission is to examine the fiscal impacts of policies, initiatives, and proposed laws so that Coloradans are educated and informed on issues impacting their lives. CSI employs rigorous research techniques and dynamic modeling to evaluate the potential impact of these measures on the Colorado economy and individual opportunity.
Common Sense Institute was founded in 2010 originally as Common Sense Policy Roundtable. CSI’s founders were a concerned group of business and community leaders who observed that divisive partisanship was overwhelming policymaking and believed that sound economic analysis could help Coloradans make fact-based and common sense decisions.
Introduction
Over the last six months, CSI engaged numerous community stakeholders and spent hundreds of hours developing a sound methodology to better understand and respond to the homelessness issue in metro Denver. There is a deep commitment from leaders in the public, private, and non-profit sectors to address homelessness and a lot of innovative and effective approaches helping to transform lives. Based on feedback from these conversations, CSI has taken extra steps to refine its data.
The report is not intended to criticize but rather to bring a critical eye to the issue with a transparent lens on the funds being spent to address the issue. There is a need to think about how we coordinate our homeless services and how we prioritize and spend finite resources to maximize impact. This report is a clear look at a snapshot of how much our community is spending to address the issue. We know there are many ways to look at this issue and dissect homelessness to better understand. This is the lens we elected to take.
Key System-level Observations
- The system of resources to address homelessness is at a critical point. Though funding has increased significantly in recent years, much of the increase is from one-time federal, state, and municipal spending that will decline over the next few budget cycles.
- As resources to address homelessness have increased annually, the unsheltered and chronically homeless populations have also increased. Housing affordability in Colorado has plummeted, overall price levels are at record highs due to inflation, and the state’s housing inventory is dangerously low. This is a concerning precursor for sustained elevated levels of newly homeless.
- While there are successful program models across the Denver metropolitan region such as Denver’s Social Impact Bonds, non-profit organizations’ youth programs, sheltering efforts focused on adult men, and Aurora’s outreach teams, the rise in the unsheltered and chronically homeless population reflects broader system-level weaknesses that must be addressed by a comprehensive regional strategy.
- In addition, there is a need to increase transparency of how resources are being deployed so that the public can have confidence that rapid intervention is occurring when someone becomes newly homeless. This is the most effective way of preventing the long-term personal and societal costs that come with chronic homelessness.
Report Key Findings
Expenditures
 Over the last three years, funding for programs to address homelessness in metro Denver has significantly increased. Between 2021 and 2023, an estimated $1.7 billion will be spent or budgeted to address homelessness.
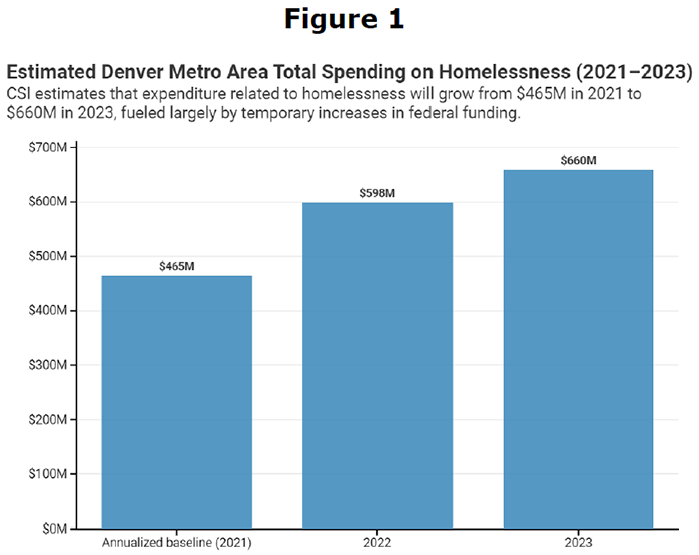
- The total amount of annual spending is expected to increase from $465 million in 2021 to an estimated $660 million in 2023—a 42% increase over those two years ($195 million).
- The increase is due, in part, to a temporary infusion of federal COVID-19 emergency funds.
- 2023 expenditure per individual experiencing homelessness or in permanent supportive housing in metro Denver is expected to be between $31,428 and $61,871. Spending per person in the city of Denver is expected to be between $37,309 and $73,450.
- Based upon the cumulative yearly count of the homeless population reported by metro Denver’s Continuum of Care, 2023 spending per homeless person is expected to be $20,462.
Population Experiencing Homelessness
- The total metro Denver population of individuals experiencing homelessness grew by 13% from 2020 to 2022; over that time, the unsheltered population grew by 33% to its highest level since 2008.
- The unsheltered population is up 120% since 2019.
- The metropolitan Denver region’s veteran homeless population is down 31% since 2020, which is consistent with trends in other parts of the county that emphasized reforms and resources dedicated to this population.
- While the unsheltered homeless population in Denver grew by 33% between 2020 and 2022, it decreased by 19% in San Antonio and 9% in Houston.
Workforce
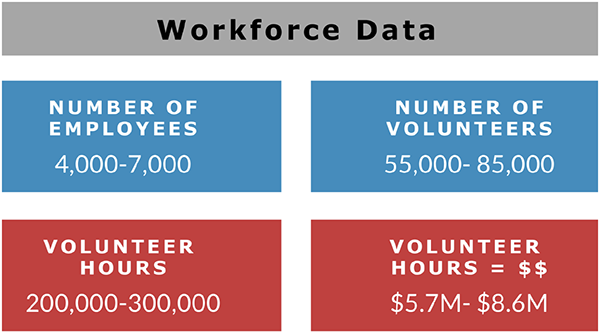
- Although the data are limited, approximately 4,000 to 7,000 employees and 55,000 to 85,000 volunteers work for programs addressing homelessness in the Denver metropolitan area. Thus, there is approximately one job related to serving and addressing homelessness for every two individuals experiencing homelessness or in permanent supportive housing.
Shelter
- In 2021, there were 12,500 year-round beds in the Denver metropolitan area according to the HUD Continuum of Care count.
- 47%, or 5,866 beds, were categorized as emergency, safe haven, or transitional housing.
- 53% of those beds were categorized as permanent housing which includes permanent supportive housing and rapid rehousing beds.
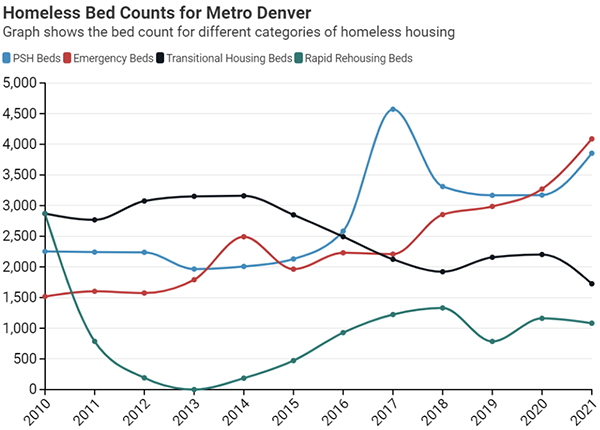
- Between 2014 and 2021, the number of permanent housing beds rose by 203% (from 2,192 to 6,634).
City Comparisons
- Expenditure Growth – All regions analyzed in the study are expected to spend increased amounts on homelessness between 2021 and 2023.
Table 1: Homelessness Expenditure Growth and Spending per Person by Location
| Total spending (2021–2023) | Spending growth between 2021 and 2023 | 2023 spending per person according to population count estimates |
|||
| Low daily count | High daily count | Cumulative year count |
|||
| Denver | $1.46 billion | 38% | $73,450 | $37,309 | $24,291 |
| Aurora | $76 million | 60% | $30,710 | $15,599 | $10,156 |
| Boulder | $87 million | 63% | $55,253 | $28,066 | $18,273 |
Population Growth
The growth in the population of individuals experiencing homelessness has not been uniform across metro Denver.
Denver
Table 2: City of Denver Homeless Population Growth
| 2020 | 2022 | % Difference | |
|---|---|---|---|
| Total homeless | 4171 | 4794 | 0.15 |
| Unsheltered | 996 | 1313 | 0.32 |
| Newly homeless | 1075 | 1475 | 0.37 |
Aurora
Table 3: City of Aurora Homeless Population Growth
| 2020 | 2022 | % Difference | |
|---|---|---|---|
| Total homeless | 427 | 612 | 43% |
| Unsheltered | 61 | 301 | 393% |
| Newly homeless | 87 | 268 | 208% |
Boulder
Table 4: Boulder County Homeless Population Growth
| 2020 | 2022 | % Difference | |
|---|---|---|---|
| Total homeless | 689 | 457 | -34% |
| Unsheltered | 118 | 82 | -31% |
| Newly homeless | 54 | 227 | 320% |
Need for System Change
- One of the most pressing questions facing local leaders and the public is whether a combination of system changes and a near-term influx of funding will lead to long-term reductions in homelessness. Other parts of the country and the metro Denver’s region’s record on veteran homelessness prove that it is possible.
- In other parts of the country the data are trending in the opposite direction of the metro Denver region. While the unsheltered homeless population in metro Denver grew by 33% between 2020 and 2022, it decreased by 19% in the San Antonio region and 9% in the Houston CoC region.
- The metro Denver region’s veteran homeless population is down 31% from 2020, which is consistent with trends in other parts of the county that enacted reforms and dedicated resources to this population.
- The system of resources serving the homeless captured in this report will come under even more pressure if broader solutions to mental health, addiction, housing affordability, and educational attainment are not achieved.
- Transparency and sound data are needed in order to efficiently deploy finite resources. Given that most homeless resolution strategies focus on targeting specific groups of people, resources dedicated to each of these populations should be reported similarly.
Homelessness Landscape
 Expenditures
Total expenditure reflects public city, state, and federal money and private donations spent on services provided to individuals defined as homeless by HUD[i] and the formerly homeless who reside in permanent supportive housing across the Metropolitan Denver Continuum of Care region.[ii] Because the source of this spending comes from a combination of revenue from private donations, city, state, and federal government agencies, CSI developed a methodology designed to avoid double-counting dollars that are re-distributed across the system. See Appendices B and D for a complete methodology and detailed list of expenditures.
Spending estimates are shown for 2021, 2022, and 2023. The 2021 estimate sets an annualized baseline of spending, to which additional budgeted dollars are added to make the 2022 and 2023 estimates. The baseline includes estimates of recurring expenditures on homelessness by both non-profit organizations and government departments.
In order to prevent double-counting within the budgeted spending estimates, CSI undertook a lengthy process to review each expense reported by non-profits and remove any money that is either spent on initiatives that are not related to homelessness or passed through to other organizations. We also invited direct feedback from many organizations on the expenditures we captured to ensure that no such double-counting occurred. As a result of this process, the total non-profit expenses related to homelessness captured in the report amount to only 43% of the total spending that those organizations reported, which equates to over $396.4million being removed from the annualized baseline.
If these expenses were included in the baseline, the annual total expenditures would have been:
2021 = $861 million
2022 = $995 million
2023 = $1.056 billion
Total over 3-years = over $2.912 billion
The reported spending by government departments in the 2021 annualized baseline only includes money which is not granted or distributed to local service providers. Denver’s Office of Housing Stability (HOST), for example, reported $122 million of program spending in 2021, but this analysis captures only $1.5 million of that in the annualized baseline. This is because $1.5 million is the only portion of HOST’s 2021 homelessness spending reported to have not been passed through to private providers.
Based on stakeholder feedback and reports published by other organizations, this report uses three methods to estimate the population served by homelessness expenditures. Additional detail can be found in Appendix B.
Estimates 1 and 2 reflect a range of the average daily number of individuals experiencing homelessness or in permanent supportive housing. Although no longer homeless and thus not counted in the PIT census, people in Permanent Supportive Housing often require wrap-around services and rent support.
Estimate 1: Metro Denver Region = 10,660 – HUD’s Point-in-Time (PIT) annual census of homeless individuals + HUD’s housing inventory count of permanent supportive housing (PSH) beds.
Estimate 2: Metro Denver Region = 20,986 – HUD’s Point-in-Time (PIT) annual census of homeless individuals multiplied by 2.5 + HUD’s housing inventory count of permanent supportive housing (PSH) beds.
Estimate 3: Metro Denver Region = 32,233 – Reflects the cumulative number of individuals who access homelessness services within a year as identified by Denver’s Homeless Management Information System (HMIS) maintained by the Metro Denver Homeless Initiative.
It is important to note that the numbers and ranges presented on a per person spending are in line with other estimates published locally and nationally. Several examples include:
- The Colorado Division of Local Affairs reports that taxpayers pay $45,993 per chronically homeless person.[iii]
- Analysis of the Denver’s Social Impact Bond program reported that the average cost per individual in the program was $29,000 annually, prior to being housed through the program. That only included the costs of jail, detox facilities, arrests, and emergency room visits.[iv]
- The National Alliance to End Homelessness reported the cost per person experiencing chronic homelessness to be $35,000 per year.[v]
- A study by researchers at Point Loma Nazarene University estimated the median expense per individual experiencing chronic homelessness prior to entering a Mile High United Way housing program to be $111,000.
- Colorado Coalition for the homelessness found that an average cost savings of $31,545 per participant over two years when comparing the two years prior to entering the program with the two years.[vi]
- The Calgary Homeless Foundation cites it costs “$87,000 per year to support a person using hospitals, jails, courts, and emergency services because they don’t have a home. But once that person has a home, the cost of their housing and supports decrease to approximately $30,500 per year, representing a 65% reduction.”[vii]
The following figures and tables provide estimates of expenditures in metro Denver and three municipalities within the region: Aurora, Boulder, and Denver. The non-profit baseline spending estimates within the sections represent total expenses related to homelessness initiatives, which, in 2023, is $49.8 million more than total program expenditure alone. The estimates of municipal spending in 2022 and 2023 project disbursements of state-level funding based on the relative local populations of individuals experiencing homelessness. Current and anticipated budget allocations may be granted in ways that disproportionately favor some parts of the state over others; this would produce different totals than the allocation estimates used in this analysis do.
Notably, there are several significant sources of funding intended to serve the population base used in this report which are not captured in this analysis. Those include federal housing vouchers granted directly to regional housing authorities for the purpose of aiding those in permanent supportive housing. There are also many non-profit organizations some of whose services address homelessness but were not included in this analysis due to limited expenditure information. As the metro Denver regional total only includes funds from three major municipalities, this report does not count the money expended by other cities within the region.
This analysis provides a comprehensive view of overall expenditures and should not be used to approximate costs related to any sub-population or non-profit program model aimed at homelessness resolution.
Metro Denver Expenditure Summary Findings
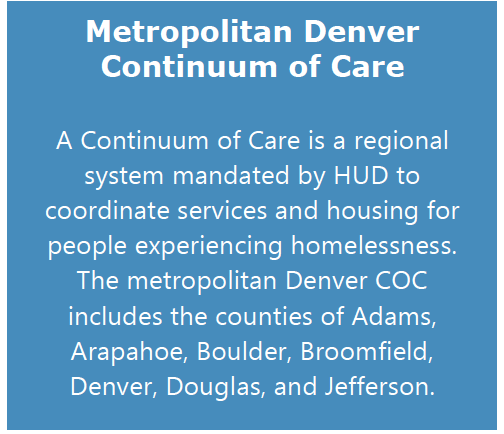
 CSI estimates that total homelessness spending in metro Denver will grow from $464.9 million in 2021 to $659.5 million in 2023 (42%) and total $1.7 billion over those three years.
- Of this $195 million increase, $152 million will come from additional homelessness spending in Denver, $10.9 million from Aurora, $15.1 million from Boulder, and $16.5 million from the remainder of metro Denver.
- The estimated 2023 spending per person experiencing homelessness or in PSH (according to a range of daily count estimates) in metro Denver is expected to be between $31,428 and $61,871.
- At metro Denver’s yearly cumulative count recorded by Colorado’s Homeless Management Information System (HMIS), total 2023 spending per homeless person is expected to be $20,462.
Table 5: Estimates of Homelessness Expenditure per Person in Metro Denver (2023)
| Estimate 1: low single-day average count | Estimate 2: high single-day average count | Estimate 3: cumulative full-year count | |
|---|---|---|---|
| Count | 10,660 | 20,986 | 32,233 |
| Expenditure per person | $61,871 | $31,428 | $20,462 |
Denver Expenditure Key Findings
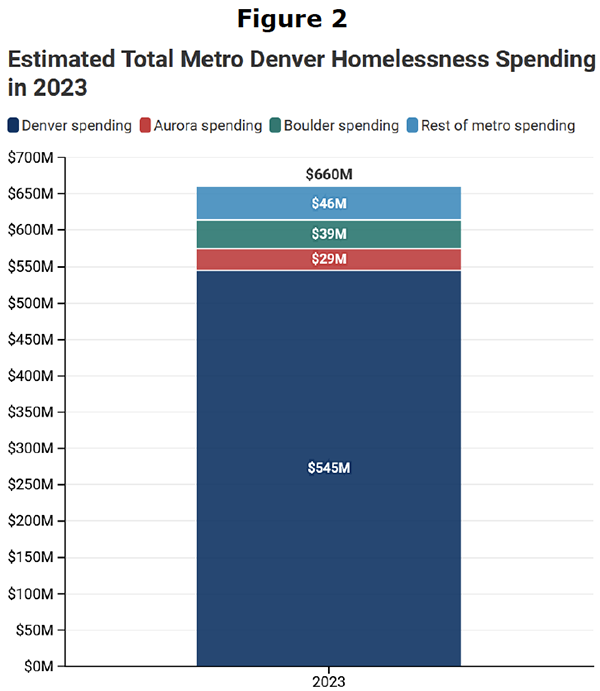
 CSI estimates that total budgeted homelessness spending in Denver will grow from $393.2 million in 2021 to $545.3 million in 2023 (38.7%) and total $1.45 billion over those three years.
- The $152 million increase in spending, which is primarily non-recurring, will come from three sources:
- $50.4 million from Denver’s Office of Housing Stability (HOST) and the Denver Police Department
- $44 million from Denver’s estimated portion of an increase in state homelessness spending
- $57.7 million from additional city expenditure of one-time federal relief funds
- The estimated 2023 spending per person experiencing homelessness or in PSH (according to a range of daily count estimates) in Denver is expected to be between $37,309 and $73,450.
- At Denver’s estimated share of the yearly cumulative count recorded by HMIS, total 2023 spending per homeless person is expected to be $24,291.
Table 6: Estimates of Homelessness Expenditure per Person in the City of Denver (2023)
| Estimate 1: low single-day average count | Estimate 2: high single-day average count | Estimate 3: cumulative full-year count | |
|---|---|---|---|
| Count | 7,424 | 14,615 | 22,447 |
| Expenditure per person | $73,450 | $37,309 | $24,291 |
Aurora Expenditure Key Findings
- CSI estimates that total budgeted homelessness spending in Aurora will grow from $18.2 million in 2021 to $29.1 million in 2023 (59.9%) and total $76 million over those three years.
- The $10.9 million increase in spending will come from two sources:
- $2.3 million from Aurora Housing and Community Services (HCS)
- $8.6 million from Aurora’s estimated portion of an increase in state homelessness spending
- The estimated 2023 spending per person experiencing homelessness or in PSH (according to a range of daily count estimates) in Aurora is expected to be between $15,599 and $30,710.
- The City of Aurora’s estimated share of the yearly cumulative count recorded by HMIS, total 2023 spending per homeless person is expected to be $10,156.
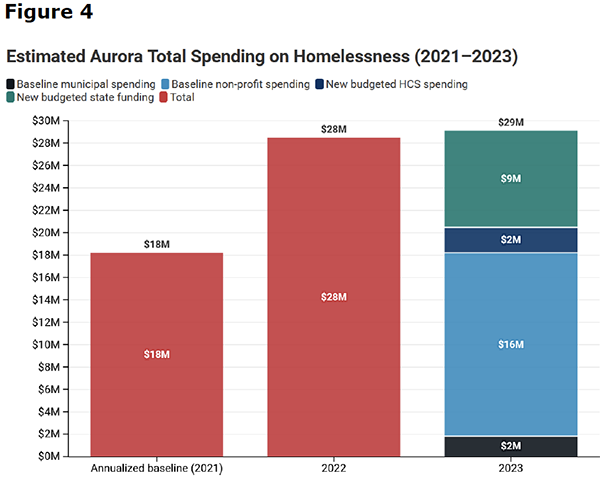
Table 7: Estimates of Homelessness Expenditure per Person in the City of Aurora (2023)
| Estimate 1: low single-day average count | Estimate 2: high single-day average count | Estimate 3: cumulative full-year count | |
|---|---|---|---|
| Count | 948 | 1,866 | 2,866 |
| Expenditure per person | $30,710 | $15,599 | $10,156 |
Boulder Expenditure Key Findings
- CSI estimates that total budgeted homelessness spending in Boulder will grow from $24 million in 2021 to $39.1 million in 2023 and total $87.1 million (63.1%) over those three years.
- The $15.1 million increase in spending will come from two sources:
- $1.2 million from Boulder Housing and Human Services (HHS)
- $13.9 million from Boulder’s estimated portion of an increase in state homelessness spending
- The estimated 2023 spending per person experiencing homelessness or in PSH (according to a range of daily count estimates) in Boulder County is expected to be between $28,066 and $55,253.
- At Boulder County’s estimated share of the yearly cumulative count recorded by HMIS, total 2023 spending per homeless person is expected to be $18,273.
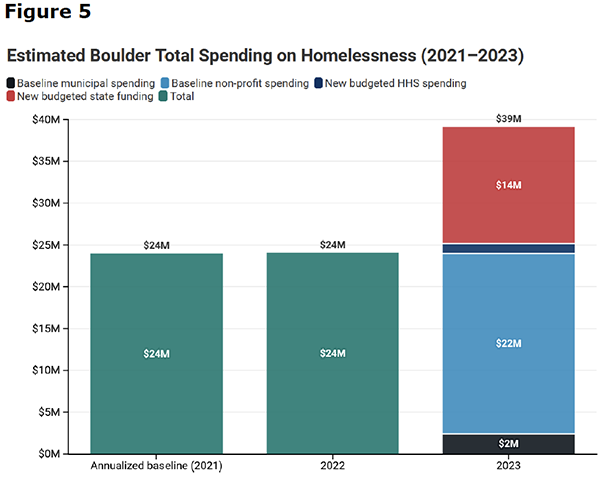
Table 8: Estimates of Homelessness Expenditure per Person in Boulder County (2023)
| Estimate 1: low single-day average count | Estimate 2: high single-day average count | Estimate 3: cumulative full-year count | |
|---|---|---|---|
| Count | 708 | 1,393 | 2,140 |
| Expenditure per person | $55,253 | $28,006 | $18,273 |
Individuals Experiencing Homelessness – Population Trends
The following section presents data regarding homeless subpopulations from the annual Point-in-Time (PIT) census conducted annually by the Metro Denver Homeless Initiative (MDHI).
This year’s January 24th census counted a total of 6,884 people experiencing homelessness in the Denver metro area. Within this total are select homeless subpopulations, including:
- Veterans
- Newly homeless
- Chronically homeless
- Individuals fleeing domestic violence
These groups are defined by the Department of Housing and Urban Development (HUD); these definitions are included in the glossary at the end of this report.
Metro Denver
The Denver metropolitan area includes 7 counties: Adams, Arapahoe, Boulder, Broomfield, Denver, Douglas, and Jefferson. In this report, only snapshots of the city of Aurora, the city of Denver, Boulder County, and metro Denver are featured.
Figure 6: Change in Homeless Population in Metro Denver by Category (Total/Sheltered/Unsheltered) [viii]
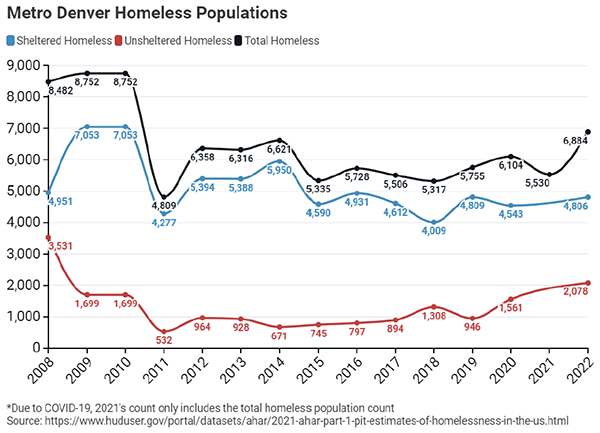
As Figure 6 shows, the number of individuals experiencing homelessness fell in 2010 after the Great Recession and the housing market collapse. A year later, the numbers of both the sheltered and unsheltered populations in metro Denver rose and now carry upward trajectories into 2022. Metro Denver’s unsheltered homeless population has increased dramatically since 2019. 2,078 individuals were classified as unsheltered in the 2022 PIT count. Though HUD changed the definition for unsheltered homeless around 2012, the 2022 unsheltered count in metro Denver is the highest amount since 2008.
Table 9: Metro Denver Homeless Subpopulations
Metro Denver Homeless Subpopulations
| 2016 | 2017 | 2018 | 2019 | 2020 | 2021 | 2022 | |
|---|---|---|---|---|---|---|---|
| Veteran homeless | 713 | 569 | 566 | 627 | 627 | 416 | 432 |
| Fleeing domestic violence | N/A* | N/A* | 384 | 542 | 759 | 924 | 1,103 |
| Chronically homeless | 861 | 1,085 | 1,596 | 1,158 | 1,840 | 1,031 | 2,634 |
| Individuals in families | 2,472 | 1,464 | 1,402 | 1,402 | 1,446 | N/A** | 1,207 |
* Domestic violence statistics for homelessness weren’t collected until 2018
** Family homelessness was uncounted in 2021 due to COVID-19
As Table 9 shows, the veteran and family homelessness population in metro Denver has decreased since 2016. Family homelessness fell from 2,472 in 2016 to 1,207 in 2022—a decline of 51%. The homeless veteran population decreased from 713 in 2016 to 432 in 2022—a decline of 39%. The chronically homeless population, the most visible subgroup of homeless individuals, more than tripled between 2016 and 2022 to 2,634.
Figure 7: Newly Homeless Population by Region Over Time
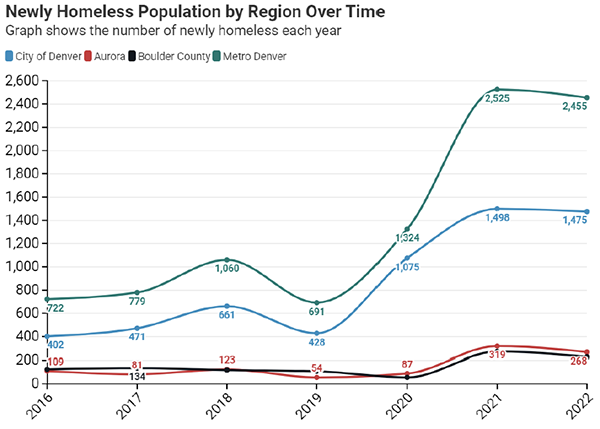
As shown in Figure 7, 691 people became newly homeless in the Denver metro region in 2019. According to the most recent data, this number increased to 2,455 in 2022. This represents a 255% increase.
Figure 8: Total Count of Homeless by Region in 2022
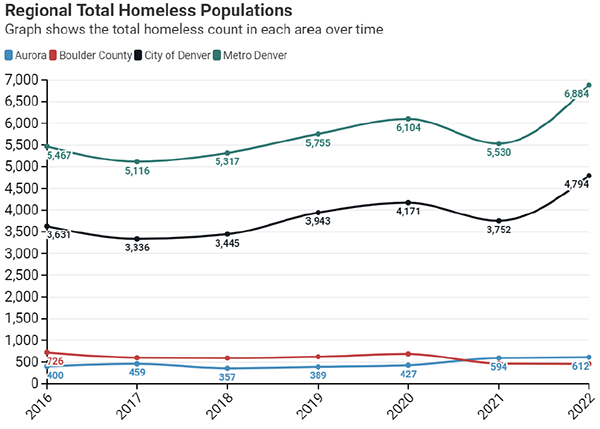
As Figure 8 shows, the city of Denver and, to a lesser degree, Aurora have experienced increases in homelessness since 2016 while the homeless population declined in the city of Boulder by 269 individuals.
City of Denver
Figure 9: City of Denver’s Sheltered and Unsheltered Homeless Populations
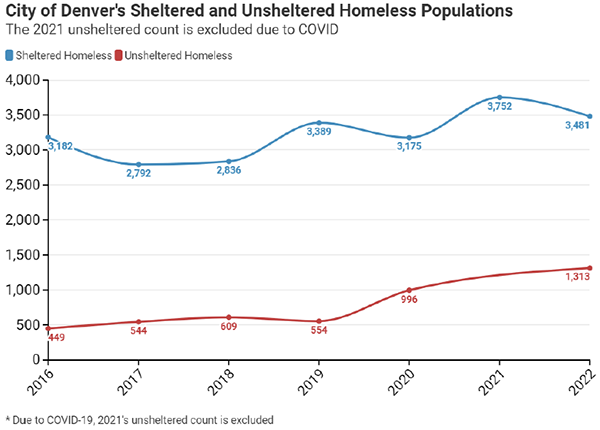
As Figure 9 shows, Denver’s sheltered homeless population has grown modestly since 2016 from 3,182 to 3,481, which represents almost 50 newly sheltered homeless each year. The unsheltered population, however, has increased by 192% from 449 in 2016 to 1,313 in 2022, which represents an average of 144 newly unsheltered homeless each year. The unsheltered population is now at its highest since 2008. The growth of the unsheltered population within Denver presents a number of concerns about both the long-term effects on those individuals, as well as the direct, and indirect costs to the rest of the community.
Table 10: City of Denver Homeless Subpopulations
City of Denver Homeless Subpopulations
| 2016 | 2017 | 2018 | 2019 | 2020 | 2021 | 2022 | |
|---|---|---|---|---|---|---|---|
| Veteran homeless | 551 | 457 | 427 | 494 | 479 | 322 | 314 |
| Fleeing domestic violence | N/A* | N/A* | 238 | 353 | 529 | 649 | 746 |
| Chronically homeless | 551 | 701 | 991 | 806 | 1,209 | 688 | 1,867 |
| Individuals in families | 1,536 | 798 | 710 | 798 | 820 | N/A** | 873 |
* Domestic violence statistics for homelessness weren’t collected until 2018
** Family homelessness was uncounted in 2021 due to COVID-19
The veteran and family homeless populations have decreased substantially since 2016. As Table 10 shows, the rate of those becoming homeless due to domestic violence has steadily and rapidly increased from 238 in 2018 to 746 in 2022 (a 213% increase). Similarly, the number of chronically homeless in Denver has increased substantially since 2016 from 551 to 1,867 in 2022 (a 238% increase).
City of Aurora
Figure 10: City of Aurora’s Sheltered and Unsheltered Homeless Populations
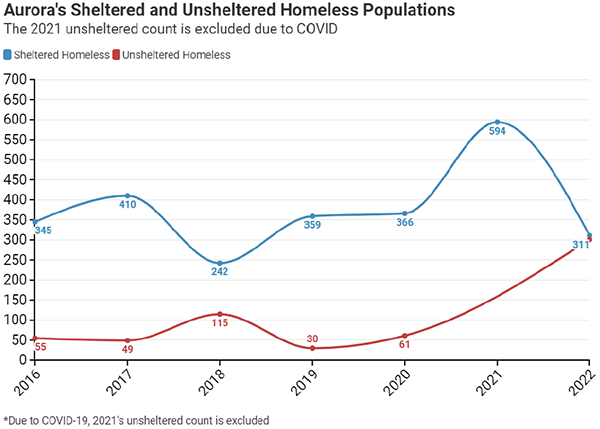
The unsheltered population within Aurora has grown significantly in recent years from 61 people in 2020 to 301 in 2022, as shown by Figure 10. The sheltered population, conversely, decreased from its high of 594 people in 2021 to 311 in 2022. This year, the city has an almost equal number of sheltered and unsheltered homeless individuals. Aurora’s total homeless population in 2022 was 612, which is the highest number since records began in 2016.
Table 11: City of Aurora Homeless Subpopulations
City of Aurora Homeless Subpopulations
| 2016 | 2017 | 2018 | 2019 | 2020 | 2021 | 2022 | |
|---|---|---|---|---|---|---|---|
| Veteran homeless | 29 | 33 | 35 | 42 | 37 | 56 | 35 |
| Fleeing domestic violence | N/A* | N/A* | 33 | 38 | 35 | 104 | 97 |
| Chronically homeless | 101 | 111 | 144 | 77 | 121 | 144 | 238 |
| Individuals in families | 192 | 157 | 117 | 86 | 86 | N/A** | 83 |
* Domestic violence statistics for homelessness weren’t collected until 2018
** Family homelessness was uncounted in 2021 due to COVID-19
Several subcategories mirror the growth of Aurora’s overall homeless population (see Table 11). The number of those fleeing domestic violence almost tripled between 2020 and 2021 and there are nearly 100 more chronically homeless individuals now than last year. Family homelessness, however, has decreased by more than 100 individuals since 2016.
City of Boulder
Figure 11: Boulder County’s Sheltered and Unsheltered Homeless Populations
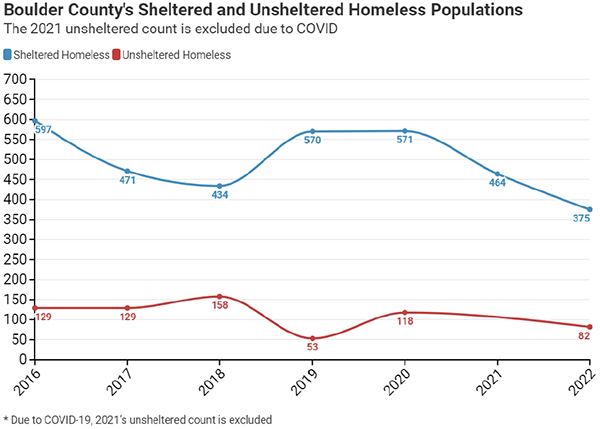
The number of sheltered and unsheltered individuals in Boulder County has fallen since 2016, as Figure 11 shows. The sheltered homeless population decreased by 37% from 597 in 2016 to 375 in 2022 and the unsheltered population decreased by 36% from 129 to 82. These decreases were especially noticeable in previous years when, beginning in 2021, Boulder was passed by Aurora in terms of total homeless population.
Table 12: Boulder County Homeless Subpopulations
Boulder County Homeless Subpopulations
| 2016 | 2017 | 2018 | 2019 | 2020 | 2021 | 2022 | |
|---|---|---|---|---|---|---|---|
| Veteran homeless | 38 | 43 | 42 | 50 | 53 | 22 | 32 |
| Fleeing domestic violence | N/A* | N/A* | 41 | 83 | 104 | 65 | 99 |
| Chronically homeless | 128 | 124 | 204 | 129 | 210 | 86 | 121 |
| Individuals in families | 298 | 157 | 165 | 172 | 221 | N/A** | 11 |
* Domestic violence statistics for homelessness weren’t collected until 2018
** Family homelessness was uncounted in 2021 due to COVID-19
As did the overall homeless population, homeless subpopulations including veterans, those chronically homeless, and families have decreased in size since 2016 (see Table 12). Family homelessness decreased by 98% from 298 individuals in 2016 to 11 in 2022, while veteran and chronic homelessness declined more modestly. Boulder County did not experience large spikes in homeless subpopulations and total population during the pandemic, unlike other municipalities.
Shelter Types & Capacity
The U.S. Department of Housing and Urban Development’s Housing Inventory Count (HIC) captures the central resource to addressing homelessness. Reported through the regional continuum of care, the categories of beds in the HIC reflect the range of beds in the housing continuum. Definitions of the following bed types can be found in key terms in Appendix A.
- Emergency shelter
- Safe haven
- Transitional housing
- Permanent supportive housing
- Rapid re-housing
- Other permanent housing
Total bed capacity in metro Denver increased dramatically over the last decade; 12,500 beds were available in 2021 compared to 7,103 total beds in 2012, as Figure 12 shows. During the COVID-19 pandemic, bed capacity grew by almost 3,000 from 9,762 in 2019 to 12,500 in 2021. Permanent supportive housing beds have increased by more than 1,500 since 2010, matching a decline in transitional and rapid rehousing beds. This reflects Denver’s “Housing First” strategy to place homeless individuals in subsidized housing before offering mental health, substance abuse treatment, and employment services.
Figure 12: Bed Counts over Time in Metro Denver
Workforce Serving People Experiencing Homelessness
Employees at charitable organizations, health care staff at local hospitals and urgent care centers, emergency responders, government workers, social workers, counselors, and others work to provide care and support services for homeless individuals. Based on annual reports, Forms 990, and interviews, it is estimated that 4,000–7,000 employees at these agencies work in this field; however, because some of the organizations offer a broader range of services than supporting the homeless population, more precise numbers are difficult to obtain.
The number of volunteers for these organizations ranges from 55,000–85,000 people putting in approximately 200,000–300,000 hours. Based upon an estimate by Independent Sector, the financial value of these volunteer hours is $5.7–$8.6 million.[ix]
Regional Analysis: System Changes and Outcomes
For this report, CSI examined four additional regions whose approaches to homelessness have received recent attention from local leaders.
These handful of communities were selected from conversations as comprehensive systems that were worth looking at and learning from. Community leaders in both Denver and Aurora have also been visiting several of these programs (Houston & San Antonio) to learn from them and how or if anything could be applied in the Metro Denver area. From conversations with providers and city stakeholders it is understood that there is not a one-size-fits-all approach to homelessness. And just because it works in San Antonio or Rockford, doesn’t necessarily mean that same model will work here in Colorado.
As Table 13 shows, while Denver experienced an increase in homelessness over the past five years, the homeless populations in Houston, Rockford, and Washington, D.C., decreased. San Antonio’s population has increased by less than Denver’s. The unsheltered population in Denver has increased substantially compared to the populations in these other municipalities. All five municipalities have fewer homeless veterans today than five years ago.
Regional Continuum of Care (CoC) Populations:
- Metro Denver CoC = 3.2 million
- Houston, Texas CoC = 6.3 million
- San Antonio, TX CoC = 2 million
- Washington, D.C. CoC = 670,000
- Rockford, IL CoC = 436,700
Table 13: Homeless Population Changes in Case Study Regions
| Change in Total Homeless Population | |||
| Last 5 years (2017–2022) | Last 10 years (2012–2022) | Last 3 Years (2019–2022) | |
| Metro Denver | 0.25 | 0.08 | 0.2 |
| San Antonio | 0.09 | -0.18 | 0.04 |
| Houston | -0.11 | -0.55 | -0.18 |
| Washington, D.C. | -0.41 | -0.37 | -0.32 |
| Change in Sheltered Population | |||
| Last 5 years (2017–2022) | Last 10 years (2012–2022) | Last 3 years (2019–2022) | |
| Metro Denver | 0.04 | -0.11 | ±0% |
| San Antonio | 0.19 | -0.04 | 0.16 |
| Houston | -0.31 | -0.49 | -0.26 |
| Rockford, IL* | -0.18 | -0.54 | -0.21 |
| Washington, D.C. | -0.48 | -0.45 | -0.42 |
| Change in Unsheltered Population | |||
| Last 5 years (2017–2022) | Last 10 years (2012–2022) | Last 3 years (2019–2022) | |
| Metro Denver | 1.32 | 1.16 | 1.2 |
| San Antonio | -0.06 | -0.36 | -0.13 |
| Houston | 0.33 | -0.61 | -0.07 |
| Washington, D.C. | 0.07 | 0.42 | 0.59 |
| Change in Veteran Population | |||
| Last 5 years (2017–2022) | Last 10 years (2012–2022) | Last 3 years (2019–2022) | |
| Metro Denver | -0.21 | -0.39 | -0.31 |
| San Antonio | -0.03 | -0.22 | 0.03 |
| Houston | -0.34 | -0.77 | -0.29 |
| Washington, D.C. | -0.44 | -0.7 | -0.46 |
* Rockford counts are through 2021; the CoC did not produce an unsheltered count in 2021 and has not yet released its 2022 PIT count
Table 14: Housing Inventory Count in Case Study Regions (Total, Emergency Shelter (ES), Permanent Supportive Housing (PSH))
| Metro Denver CoC Bed Count | |||||||
| 2016 | 2017 | 2018 | 2019 | 2020 | 2021 | % difference | |
| PSH beds | 2,584 | 4,571 | 3,311 | 3,167 | 3,171 | 3,853 | 49% |
| ES beds | 2,230 | 2,208 | 2,853 | 2,986 | 3,270 | 4,088 | 83% |
| Total | 8,356 | 10,358 | 9,687 | 9,762 | 11,316 | 12,500 | 50% |
| San Antonio CoC Bed Count | |||||||
| 2016 | 2017 | 2018 | 2019 | 2020 | 2021 | % difference | |
| PSH beds | 1,410 | 2,168 | 2,154 | 2,113 | 2,001 | 2,034 | 44% |
| ES beds | 1,433 | 1,487 | 1,267 | 1,359 | 1,465 | 1,980 | 38% |
| Total | 5,107 | 6,440 | 5,961 | 5,718 | 5,750 | 6,572 | 29% |
| Houston CoC Bed Count | |||||||
| 2016 | 2017 | 2018 | 2019 | 2020 | 2021 | % difference | |
| PSH beds | 4,818 | 5,542 | 5,848 | 5,494 | 6,078 | 6,057 | 26% |
| ES beds | 1,613 | 1,758 | 1,902 | 1,846 | 1,884 | 1,942 | 20% |
| Total | 9,489 | 10,865 | 10,416 | 9,579 | 9,942 | 10,680 | 13% |
| District of Columbia CoC Bed Count | |||||||
| 2016 | 2017 | 2018 | 2019 | 2020 | 2021 | % difference | |
| PSH beds | 6,567 | 6,336 | 7,950 | 7,546 | 9,958 | 11,243 | 71% |
| ES beds | 6,077 | 5,888 | 5,268 | 4,651 | 5,110 | 4,581 | -25% |
| Total | 21,001 | 19,969 | 20,250 | 21,913 | 27,926 | 30,818 | 47% |
| Rockford, IL, CoC Bed Count | |||||||
| 2016 | 2017 | 2018 | 2019 | 2020 | 2021 | % difference | |
| PSH beds | 324 | 346 | 348 | 468 | 484 | 445 | 37% |
| ES beds | 215 | 206 | 210 | 307 | 331 | 355 | 65% |
| Total | 643 | 716 | 750 | 1,007 | 1,115 | 1,220 | 90% |
Metro Denver
Jurisdictions across the metro Denver region are urgently addressing the growing problem of homelessness and responding to the problem in unique ways. Some of the different ways cities are tackling the issue are highlighted below.
Denver: Denver’s Department of Housing Stability (HOST) recently established aspirational goals in its five-year plan to prevent and address homelessness. For example, to reduce evictions, at least 2,000 households will receive legal counseling in eviction proceedings. The city will also connect those who lose housing to shelter services and short- and long-term housing options.
Currently, Denver has 24,000 income-restricted units and intends to increase the number of such homes and apartments from 7% of homes in Denver to 8%.[x] The city intends to increase home ownership through subsidies and zoning.
The city’s goal is to reduce the number of unsheltered homeless individuals by 50% and reduce the actual experience of homelessness to less than 90 days. Individuals will be encouraged to relocate into subsidized housing, free housing, or safe outdoor space programs. The city hopes that at least 80% of residents in subsidized housing will increase or at least maintain their income levels while enrolled and remain housed for at least one year or more. The city will measure its progress by collecting data on the number households that sleep unsheltered, exposure deaths, recipients who remain housed, and the number of households that increase or maintain their income levels while in the program.
A program that has achieved some notable success in Denver is the Social Impact Bond initiative, which provides free housing for 250 chronically homeless individuals who disproportionally use emergency room and criminal justice services such as jail and detox. Participants have access to support services such as mental health treatment, case management, skills building, and substance-abuse counseling but need not use them to remain in the program. The program is supported by federal funds and $8.7 million in loans from philanthropic partners under a performance-based contract.
Aurora: The city of Aurora has undergone significant policy and funding reforms related to the issue of homelessness in 2022. Earlier this year, the city council instituted an urban camping ban and a marketing campaign to encourage people to give to organizations that help homeless people rather than to panhandlers. Funding has been increased to outreach teams which engage with individuals ahead of camp cleanups. Recently, the Aurora City Council passed a resolution that outlined a new comprehensive treatment, or work-first, strategy to address the growing homeless problem. The plan seeks to put an end to the city’s support of non-profits that only meet the emergency needs of those experiencing homelessness and instead emphasize tailored paths towards self-sufficiency.
Aurora has given $4 million to public and private agencies which provide services for individuals and families experiencing homelessness. The city approved two safe outdoor spaces and one safe parking lot for urban camping.
The city funded an additional position in its homelessness division to work on issues concerning encampments and a pilot employment program for veterans experiencing homelessness.
Aurora has pledged to work with the Metro Denver Homeless Initiative under the Built for Zero framework.
Boulder: Boulder County recently was acknowledged for its transparent financial reporting. Boulder County is the first metro Denver region to achieve “Quality Data” for all singles, according to MDHI, which is a first step toward bringing an end to functional zero veteran homelessness.[xi] Impressively, the county can identify every individual by name who is experiencing homelessness. Functional zero homelessness means that incidences of homelessness are brief, rare, and do not reoccur.
In addition to its temporary shelters and transitional and permanent housing programs, the city is considering building a 100-bed 24-hour emergency shelter and service hub.
Questions for further system reforms:
- How can HUD’s Homeless Management Information System become more reliable, transparent, and integrated into system solutions? How will more providers be incentivized to use the same system?
- How can barriers be removed to shelter entry for certain populations be removed?
- What are best practices for storage of possessions and maintaining pets?
- What is the best way to enforce an urban camping ban if a city chooses to enact one? Is it effective at encouraging people to access services and shelter?
- Are housing and services best placed in central locations or dispersed across the city? Are there transportation barriers?
- How are outcomes reported and how are providers coordinated in delivery of services to maximize impact and outcomes?
- Is there a single point person for coordinating services and identifying gaps?
- How can zoning and permitting policies change to improve the affordable housing stock?
- How can landlords and developers support the goals of reducing the unsheltered population?
- Which programs are best in helping formerly homeless individuals attain long-term unsubsidized housing, employment, mental and physical health care, and sobriety?
- Which programs in other cities could officials and providers in metro Denver adopt or learn from that have succeeded at helping individuals gain housing and, ultimately, self-sufficiency?
- How can the system be made more transparent about expenditures? What defines success and at what cost?
- Where is the best place to direct additional funding and who should be making these funding decisions?
Regional System Changes outside Metro Denver
City of San Antonio: Haven for Hope
With a $20 million annual budget, Haven for Hope in San Antonio provides shelter and wrap-around services to around 1,700 people daily on its 22-acre campus. Since opening its doors, the homeless population in downtown San Antonio has fallen by 80%.[xii]
Approximately 700 people receive emergency shelter, hot meals, shower and laundry access, and medical and mental health services in the organization’s Courtyard center. There are no rules for entry, apart from safety requirements, to stay in and access services at the Courtyard. Haven for Hope is the only San Antonio city shelter with a dog kennel.
Haven for Hope’s Transformational Campus provides on- and off-campus housing, employment, education, and legal services, life skills training, childcare, health care, and substance and mental health treatment. Around 180 organizations partner with Haven for Hope. Individuals and families stay an average of six months in on-campus housing before moving to permanent housing elsewhere. Clients commit to sobriety and working with the Haven to Home team to address barriers to housing stability.
Since opening its doors, Haven for Hope has secured permanent housing for 4,000 people, most of whom (90%) have remained housed with the help of support services provided by Haven for Hope and its partners.
Haven for Hope opened 12 years ago with the support of businessman and philanthropist Bill Greehey of NuStar Energy and then-Mayor Phil Hardberger. The Greehey Family Foundation continues to provide at least $3 million yearly through the organization’s annual golf tournament. Haven for Hope’s $20 million annual budget is funded by public and private funding.
City of Houston, TX: The Way Home
A decade ago, City of Houston launched The Way Home, an effort by the nonprofit Coalition for the Homeless of Houston/Harris County and nonprofit and government agency partners to move people off the street into free and subsidized housing. The number of homeless people in the greater Houston area dropped from 8,471 in 2011 to 3,223 in 2022.[xiii]
Houston’s “Housing First” approach is distinct in several ways. For example, rather than operate completely separately, agencies and non-profits work together and coordinate services to reduce competition and redundancy and to improve communication. “Housing First” does not require residents to be employed or sober in order to qualify for housing, reasoning that, with housing in place, participants will take positive steps toward long-term stability. Once housed in a one-room apartment, coalition partners follow up with case management, mental health, substance abuse counseling, income coaching, and other assistance. The continuum of care includes prevention, street outreach, meal programs, physical and mental health care, emergency, transitional and permanent housing, and other services.[xiv]
More than 25,000 people have been placed in permanent housing since 2012. Since then, the majority (90%) remain in the program or other housing.
Washington, D.C.: Homeward D.C.
The number of homeless residents dropped to a 17-year low in Washington, D.C., this year.[xv] Reducing homelessness has been a focus of Mayor Muriel E. Bowser since entering office in 2015, at which time homelessness was rising. Since then, the city’s efforts have been particularly successful at reducing the number of homeless veterans. There are 205 homeless veterans today, which is only half as many as before the start of her term.[xvi] Family homelessness within the city has also fallen by 49% between 2020 and 2021.[xvii]
Rapid rehousing, one component of the effort, provides subsidized rent for up to 18 months.[xviii] Participants start by paying 30% of their incomes on rent while the public contributes the rest and pay more over time until their rehousing vouchers expire. The purpose of the subsidy is to provide participants time to seek employment or address other concerns that make them vulnerable to homelessness. Participants also have access to career development counseling. Eligible individuals and families may receive welfare support services or other subsidy programs as they exit the rapid rehousing program.
The Department of Human Services reports that 85% of rapid rehousing clients do not move back into homeless shelters. Last year, D.C. spent $98.6 million on subsidized rent for 3,400 families and 521 individuals.
The city closed D.C. General, a large family shelter with significant problems, in favor of smaller family shelters in each of the city’s wards. The Bowser administration also cleared encampments, designated no-camping zones, and offered one-year leases to those living on the street. Through this pilot program, the city has placed 99 individuals in apartments.
Individuals and families who have experienced chronic homelessness, have limited earning potential, and need intensive case management are eligible for permanent housing subsidies.[xix]
City of Rockford, IL: Built for Zero
Rockford, IL, is one of 80 communities that have adopted the Built for Zero framework to address homelessness.[xx]
By 2017, the city achieved functional zero veteran and chronic homelessness which means that “homelessness is rare and brief for that population.”[xxi] “Chronic homelessness” is a state of homelessness that lasts for at least a year and accompanies a mental health problem, a physical disability, and/or a substance abuse problem.
The city has programs to prevent homelessness, identifies individuals when they become homeless, and promptly resolves any homelessness that occurs. To earn the “functional zero” distinction, a city must have more shelter available than individuals in need.
“What we have done is we’ve become the first city in the nation to get to functional zero for veteran’s homelessness,” said Mayor Thomas McNamara.[xxii]
The city works with eviction courts to prevent evictions for those at risk of becoming homeless.[xxiii] The city tracks its homeless population, their names, locations, and the types of assistance that they require in real time. Data are collected to target resources strategically and to improve the program.
Conclusion
Thank you to the dozens of providers, community leaders around the country, public officials, and funders who helped to inform this report. The feedback helped to improve CSI’s methodology to ensure that accurate and conservative numbers are presented.
What is evident from this report is that homelessness is an extremely complicated issue and is even more complicated with the advent of COVID-19 and the fentanyl epidemic. It is not surprising that we are struggling to respond as a community. How we respond to the crisis matters—to transform the system, we must first have a clear sense of resources currently being spent so we can ultimately make the best decisions as a community as to how those resources are allocated.
Though there can be many different opinions about how CSI approached this research, the one certainty is that transparency and accountability are needed.
Appendices
Appendix A: Key Terms
Homeless Definition from the US Department of Housing and Urban Development
The US Federal Department of Housing and Urban Development, which serves as one of the primary funders of homeless-related services and shelter, defines four types of homelessness (see Glossary).
- Literal homeless
- Imminent risk of homelessness
- Homeless under other federal statutes
- Fleeing/attempting to flee domestic violence
General Terms
Continuum of Care (CoC) – In the early 1990s, the US Department of Housing and Urban Development (HUD) established the national model of funding for local Continuums of Care (CoC). CoCs are the local organizations which coordinate federal funding for homeless related planning and services.
Point in Time Count (PIT) – Describes a methodology of counting the homeless population at a singular point in time, generally over the course of only a few days.
Homeless Management Information System (HMIS) – A local information technology system used to collect client-level data and data on the provision of housing and services to homeless individuals and families and persons at risk of homelessness. Each Continuum of Care (CoC) is responsible for selecting an HMIS software solution that complies with HUD’s data collection, management, and reporting standards.
Population Terms
Chronic Homelessness – HUD defines persons experiencing chronic homelessness as those who (a) are homeless, (b) are living in a place not meant for human habitation, in a safe haven, or in an emergency shelter, (c) have been homeless and living in a place not meant for human habitation, a safe haven, or an emergency shelter continuously for at least 1 year or on at least four separate occasions in the last 3 years where the combined length of time homeless across those occasions is at least 12 months, and (d) have a disability.
Newly Homeless – Newly homeless is defined as a person who has been experiencing homelessness for less than one year and this was their first episode of homelessness.
Unsheltered Homelessness – With a primary nighttime residence that is a public or private place not designed for or ordinarily used as a regular sleeping accommodation for human beings, including a car, park, abandoned building, bus or train station, airport, or camping ground.
Literal Homelessness – is an individual or family who lacks a fixed, regular, and adequate nighttime residence, (i) Has a primary nighttime residence that is a public or private place not meant for human habitation; (ii) ls living in a publicly or privately operated shelter (including safe haven or transitional living program).
Imminent Risk of Homelessness – An individual or family who will imminently lose (within 14 days) their primary nighttime residence provided that no subsequent residence has been identified and the individual or family lacks the resources or support networks needed to obtain other permanent housing.
Homelessness under Other Federal Statutes – Unaccompanied youth (under 25) or families with children and youth who do not otherwise qualify as homeless under this definition and a redefined as homeless under another federal statute, have not had permanent housing during the past 60 days, have experience persistent instability, and can be expected to continue in such status for an extended period of time.
Fleeing/Attempting to Flee Domestic Violence – Any individual or family who is fleeing, or attempting to flee, domestic violence, dating violence, sexual assault, or stalking.
Housing Terms
Shelter – A project that offers temporary shelter (lodging) for the homeless in general or for specific populations of the homeless. In metro Denver, there are variations of shelter types, including family shelters where households may stay for 14 to 90 days on average, and nightly shelter for individuals which may be nightly only or longer term depending on the program.
Transitional Housing – A project that provides temporary lodging and is designed to facilitate the movement of homeless individuals and families into permanent housing within a specified period of time, but typically no longer than 24 months. In transitional housing, there are generally higher eligibility and program requirements than in emergency shelter. Participants may be asked to pay rent or fees to stay in these programs.
Permanent Supportive Housing (PSH) – Permanent housing in which housing assistance (e.g., long-term leasing or rental assistance) and supportive services are provided to assist households with at least one member (adult or child) with a disability in achieving housing stability.
Permanent Housing (PH) – A CoC program component type providing indefinite leasing or rental assistance combined with supportive services for disabled persons experiencing homelessness so that they may live independently.
Rapid Re-housing (RRH) – A permanent housing solution emphasizing housing search and relocation services and short- and medium-term rental assistance to move homeless persons and families (with or without a disability) as rapidly as possible into housing.
Safe Haven – Supportive housing that serves hard to reach homeless persons with severe mental illness who came from the streets and have been unwilling or unable to participate in supportive services; provides 24-hour residence for eligible persons for an unspecified period; has an overnight capacity limited to 25 or fewer persons; and provides low-demand services and referrals for the residents.
Emergency Shelter – Any facility with overnight sleeping accommodation, the primary purpose of which is to provide temporary shelter for the homeless in general or for specific populations of the homeless.
Other Permanent Housing (OPH) – Consists of PH – Housing with Services (no disability required for entry) and PH – Housing Only, as identified in the 2020 HMIS Data Standards.
Appendix B: Methodology & Data Notes
Methodology
Expenditures
The development of the summary estimates for expenditures within the homeless serving ecosystem in Metro Denver can be separated into two parts. The first category of spending is the historical annual baseline. The other category is new spending, not captured in the historic annual baseline, that has either been spent directly by agencies or is included in recent state and municipal budget allocations and has yet to be distributed to providers.
Part 1: Annual Baseline
The annual baseline level reflects an estimate of the recurring expenditures in the homeless serving ecosystem within the Denver metropolitan area. Because of the complexity related to revenue sources flowing into the ecosystem, total expenditures are captured, not revenue, as to avoid any double counting of funds.
CSI undertook a lengthy process to review each expense to remove any dollars that would be re-granted to other organizations, to ensure no significant double counting occurred. We also allowed for many organizations to provide direct feedback on the expenditures we captured to provide further insights on any areas where double counting may occur. Ultimately, the total expenses related to homelessness captured in the report are only 43% of total expenses listed for non-profit agencies included.
- Financial information came from 48 major non-profit providers including: program service and total expenditures from their latest Forms 990, the Colorado Secretary of State’s website, annual reports, or from organizations who provided financial information to CSI.
- In most cases annual expenditures are through 2021, though several included only had information available for 2018–2019.
Municipal spending captured in the baseline reflect estimates of spending from the City of Denver, City of Aurora, and City of Boulder that include direct services and administrative expenses towards homelessness.
Other organizations that have direct spending related to individuals experiencing homelessness, e.g., Denver Health, were also included. Denver Health submits an annual report to the City of Denver that captures their expenses from homeless individuals. The report does not specify the share that is uncompensated care or paid by insurance.
Part 2: Newly Proposed Expenditures
As noted, all financial information collected from the non-profits were from either fiscal year 2019, 2020, or 2021. Since 2021, various municipal and state budget proposals, ballot initiatives, and federal dollars have allocated or will allocate additional funds towards homelessness that are not captured in the annual baseline, as they were not spent or distributed at the time of filing. Many of these are one-time allocated expenses, and it is important to note that these are budgeted but not yet spent. This includes items such as:
- State of Colorado FY22 and FY23 budgets
- Cities of Denver, Aurora and Boulder FY22 and FY23 budgets
- Recent funding approved by municipal ballot measures not spent in baseline year
Though some non-profit service providers may also be experiencing increases in private contributions, no assumptions were made to increase the annual baseline.
Estimates of Population Served by Expenditures
CSI used a range to capture the homeless related expenditures relative to the number of people being served. This report has considered many different opinions from stakeholders on the best way to reflect the homelessness population. Though there is not a consensus on the best approach, the following three estimates provide a range that covers a daily average, and the total number of people who become homeless, even if just for a brief amount of time.
Estimates 1 and 2 show a range in the daily average number of people who are counted as homeless, as well as those in the Homeless Continuum of Care that are housed in permanent supportive housing. Estimate 3 provides a cumulative count of individuals over the course of a year.
Estimate 1 – PIT + PSH = The total number of individuals experiencing homelessness captured in the annual Point-in-time count plus 98% of the total number of permanent supportive housing units.[xxiv]
Estimate 2 – PIT x 2.5 + PSH = The total number of individuals experiencing homelessness captured in the annual Point-in-Time count multiplied by 2.5, plus 98% of the total number of permanent supportive housing units. Given the PIT count occurs on a single night, key stakeholders recommended multiplying the PIT count by a factor of 2.5 for an annualized count. This method for estimating the annual count of people experiencing homelessness is used by Colorado Coalition for the Homeless, St. Francis Center, Urban Peak and other stakeholders. While just an approximation, considering an annual count of people experiencing homelessness is helpful in considering the scope of this issue.
Estimate 3 – MDHI reported total count = The Metro Denver Homeless Initiative publishes an annual estimate of the number of individuals who access services through the regional Continuum of Care tracked within their Homeless Management Information System (HMIS).
Data Notes
Regional assumptions: Each organization’s spending is based on the location of its headquarters. However, if an organization has headquarters in a city within Metro Denver but also operates outside of the metro Denver region, we only counted estimated expenditures within the region as described below.
Several steps were taken to share out the total expenditures of some organizations to both just within the metro Denver region and to within the municipal boundaries of Aurora, Boulder, Denver and/or the rest of metro Denver.
Both supporting evidence from financial reports and direct feedback from providers helped to inform an assumed share of spending among report regions. All assumptions are noted in list of service providers in Appendix E. As an example, if a permanent housing provider has 2/3 of building locations in Denver, then 2/3 of spending would be assumed to occur in that city. In cases where there was not supporting evidence, or none was provided by the organization, then spending was assumed to be distributed across regions based on the share of individuals experiencing homelessness across regions from the PIT count.
Expenditures Not Captured
The expenditures in this analysis are not comprehensive with regards to capturing every organization that touches the homelessness ecosystem. The figures are collected from a wide range of sources, as there is no reporting requirement among all non-profits and public agencies to isolate expenditures related to homelessness.
The primary known areas not included in this report’s expenditure analysis include the following:
- Additional non-profit entities – There are other organizations outside of the 48 captured in this report that serve and support the homeless. It may only be a small portion of their organization’s mission and therefore do not isolate their financial commitments to just homelessness-related services.
- Examples of non-profit organizations not captured:
- Community Table
- Food Bank of the Rockies
- Growing Home
- Jewish Family Service of Colorado
- Mosaic Church of Aurora
- Examples of non-profit organizations not captured:
- Affordable housing authorities – Municipal housing authorities can play a key role in the homelessness ecosystem. While most of their spending is related to low-income housing support, one expert estimated agency expenditures on supportive housing for the current and formerly homeless to be around 20% to 30%, but it would fluctuate by region.
- Denver Housing Authority
- Aurora Housing Authority
- All health care expenses – The only two health care facilities captured in this expenditure analysis are Denver Health and the Stout Street Clinic. The City of Denver requires Denver Health to submit an annual report capturing their total costs related to homelessness. Stout Street Clinic is a Denver-based health care facility dedicated to serving the homeless. It is operated by the Colorado Coalition for the Homeless and therefore is captured in their Form 990 expenses.
- Most mental health expenses – Many organizations that provide mental health care designate some of their services for the homeless population, but these services typically constitute very small shares of their total spending. This analysis seeks to capture only what these groups spend specifically on homeless patients and, as a result, includes only relatively small amounts of their total expenditures at most. These include:
- AllHealth Network (0%)
- Aurora Mental Health Center (less than 1%)
- Jefferson Center for Mental Health (0%)
- Mental Health Center of Boulder County (0%)
- WellPower (15%)
- All other municipal spending – The only three city budget items reflected in this report are from Denver, Aurora, and Boulder. Every other municipality in the Denver metro likely has similar expenses related to police, fire, and other services, which are not granted to non-profits. Those other municipalities are not captured here.
- Court and jail-related spending – Other reports that estimate costs of individuals experiencing homelessness, such as those conducted by the Urban Institute for a review of Denver’s Social Impact Bond program, include expenses related to jail and courts. None of these expenses were included in this report.
Appendix C: Stakeholders Engaged
While there are a lot of different opinions about how CSI should approach this research, the one shared opinion is that transparency and accountability is needed. Below is a list of stakeholders engaged during the development of the report. Listing does not serve as an endorsement of report findings.
Stakeholders include, but are not limited to, the following:
- Apartment Association
- Associated General Contractors of Colorado
- Catholic Charities of Denver
- City of Aurora
- City of Boulder
- City of Denver
- Colorado Chamber
- Colorado Coalition for the Homelessness
- Colorado Village Collaborative
- Community Solutions
- Denver Metro BOMA
- Denver Rescue Mission
- Denver’s Department of Housing Stability
- Downtown Denver Partnership
- Forward Denver
- Metro Denver Health Initiative
- Rocky Mountain Mechanical Contractors Association
- Safe & Clean Denver
- St. Francis Center
- The Delores Project
- The Salvation Army
- Urban Peak
- VISIT Denver
- Volunteers of America
- Washington, D.C., Department of Human Services
- WellPower – Mental Health Center of Denver
Appendix D: Detailed Expenditure Tables
Denver Homelessness Expenditures
| Expenditure type | Source note | Amount | ||
|---|---|---|---|---|
| Annualized baseline | Denver Fire Department | Provided by direct contact with DFD (2020 value) | $415,800 | |
| Denver Police Department | Provided by direct contact with DPD (2020 value) | $1,300,000 | ||
| Denver Health | Denver Health 2021 annual report[xxv] | $163,665,974 | ||
| HOST direct spending | Direct spending share of 2021 HOST "Homelessness Resolution" (Denver budget line item #0144000)[xxvi] budget according to communication with HOST representative | $1,525,033 | ||
| Encampment cleaning contract (Environmental Hazmat Services) | Contract with private company for homeless encampment cleaning worth $1,570,061 annually since 2018 (extended through 2023)[xxvii] | $1,570,061 | ||
| Non-profit spending (including pass-through local, state, and federal funds) | 2020/2021 IRS Forms 990 and CO Secretary of State database | Program expenditure only | Total expenditure | |
| $186,410,574 | $224,722,949 | |||
| Annualized baseline subtotal | $372,893,476 | $411,205,851 | ||
| 2022 new expenditures | HOST direct expenditure above the baseline | Future-year budgeted HOST direct spending (including additional "Homelessness Resolution" spending provided by direct contact with HOST representative, Early Intervention Team spending, and GO bonds included in 2022 HOST budget) less 2021 HOST "Homelessness Resolution" spending | $50,249,917 | |
| Special funds (pass-through) | Total expenditure by the Homelessness Resolution Fund plus 10% of expenditure by the Affordable Housing Fund less 2021 HRF spending (note: this reflects projected expenses rather than budgeted amounts for the sake of the baseline's accuracy) | $52,057,113 | ||
| State funds (pass-through) | Homelessness expenditures by state departments (source: long bills) plus disbursements of state funds (including any provided by the federal government) by legislative bills less state department homelessness expenditure in 2021 | $1,047 | ||
| Federal funds (pass-through) | City budget disbursements of ARPA funds provided to the City of Denver | $20,770,000 | ||
| 2022 new expenditure subtotal | $81,493,422 | |||
| 2023 new expenditures | HOST direct expenditure above the baseline | Future-year budgeted HOST direct spending (including additional "Homelessness Resolution" spending provided by direct contact with HOST representative and Early Intervention Team spending) less 2021 HOST "Homelessness Resolution" spending | $10,002,066 | |
| Denver Police Department expenditure above the baseline | Provided by direct contact with DPD (DPD "reported in the budget for 2023 that [it] spend[s] $2,930,118 in [homelessness] safety net related services") | $1,630,118 | ||
| Special funds (pass-through) | Total expenditure by the Homelessness Resolution Fund plus 10% of expenditure by the Affordable Housing Fund less 2021 HRF spending (note: this reflects projected expenses rather than budgeted amounts for the sake of the baseline's accuracy) | $38,792,671 | ||
| State funds (pass-through) | Homelessness expenditures by state departments (source: long bills) plus disbursements of state funds (including any provided by the federal government) by legislative bills less state department homelessness expenditure in 2021 | $43,982,301 | ||
| Federal funds (pass-through) | City budget disbursements of ARPA funds provided to the City of Denver | $57,650,000 | ||
| 2023 new expenditure subtotal | $150,470,958 | |||
| Total expenditure | With non-profit program expenditure only | With non-profit total expenditure | ||
| 2022 total | $454,386,898 | $492,699,272 | ||
| 2023 total | $523,364,434 | $561,676,809 | ||
Aurora Homelessness Expenditures
| Expenditure type | Source note | Amount | ||
|---|---|---|---|---|
| Annualized baseline | Aurora Fire Department | Provided by direct contact with AFD (2020 value) | $180,000 | |
| Aurora Police Department | Provided by direct contact with APD (2020 value) | $750,000 | ||
| Housing and Community Services Direct Spending | Provided by direct contact with Aurora Housing and Community Services (2020 value) | $888,000 | ||
| Non-profit spending (including pass-through local, state, and federal funds) | 2020/2021 IRS Forms 990 and CO Secretary of State database | Program expenditure only | Total expenditure | |
| $13,592,259 | $16,385,833 | |||
| Annualized baseline subtotal | $15,410,259 | $18,203,833 | ||
| 2022 new expenditures | Housing and Community Services expenditure above the baseline (including pass-through and direct spending) | Future-year Housing and Community Services "Homelessness Initiative" and "Emergency Solutions Grants" spending less 2021 spending on the same[xxviii] | $1,546,588 | |
| State funds (pass-through) | Homelessness expenditures by state departments (source: long bills) plus disbursements of state funds (including any provided by the federal government) by legislative bills less state department homelessness expenditure in 2021 | $107 | ||
| Federal funds (pass-through) | City budget disbursements of ARPA funds provided to the City of Aurora and approved to fund homelessness initiatives | $8,743,299 | ||
| 2022 new expenditure subtotal | $10,289,994 | |||
| 2023 new expenditures | Housing and Community Services expenditure above the baseline (including pass-through and direct spending) | Future-year Housing and Community Services "Homelessness Initiative" and "Emergency Solutions Grants" spending less 2021 spending on the same[xxix] | $2,268,211 | |
| State funds (pass-through) | Homelessness expenditures by state departments (source: long bills) plus disbursements of state funds (including any provided by the federal government) by legislative bills less state department homelessness expenditure in 2021 | $8,631,612 | ||
| 2023 new expenditure subtotal | $10,899,823 | |||
| Total expenditure | With non-profit program expenditure only | With non-profit total expenditure | ||
| 2022 total | $25,700,253 | $28,493,827 | ||
| 2023 total | $26,310,083 | $29,103,657 | ||
Boulder Homelessness Expenditures
| Expenditure type | Source note | Amount | ||
|---|---|---|---|---|
| Annualized baseline | Boulder Police Department | Estimated BPD spending on homelessness calls and staffing in 2022 (assumed to be an ongoing expense) | $1,151,982 | |
| Direct municipal spending | City spending on efforts including staffing, security, and encampment cleanup concerning Boulder's homeless population[xxx] | $1,258,918 | ||
| Non-profit spending (including pass-through local, state, and federal funds) | 2020/2021 IRS Forms 990 and CO Secretary of State database | Program expenditure only | Total expenditure | |
| $17,888,701 | $21,565,309 | |||
| Annualized baseline subtotal | $20,299,601 | $23,976,209 | ||
| 2022 new expenditures | HHS Homelessness Solutions & Partnerships spending above the baseline | Reported Homelessness Solutions & Partnerships spending (pass-through) less the same in 2021[xxxi] | $87,602 | |
| State funds (pass-through) | Homelessness expenditures by state departments (source: long bills) plus disbursements of state funds (including any provided by the federal government) by legislative bills less state department homelessness expenditure in 2021 | $173 | ||
| 2022 new expenditure subtotal | $87,775 | |||
| 2023 new expenditures | HHS Homelessness Solutions & Partnerships spending above the baseline | Reported Homelessness Solutions & Partnerships spending (pass-through) less the same in 2021 | $1,196,544 | |
| State funds (pass-through) | Homelessness expenditures by state departments (source: long bills) plus disbursements of state funds (including any provided by the federal government) by legislative bills less state department homelessness expenditures in 2021 | $13,927,824 | ||
| 2023 new expenditure subtotal | $15,124,368 | |||
| Total expenditure | With non-profit program expenditure only | With non-profit total expenditure | ||
| 2022 total | $20,387,376 | $24,063,984 | ||
| 2023 total | $35,423,969 | $39,100,577 | ||
Captured Homelessness Expenditures in the Rest of Metro Denver
| Expenditure type | Source note | Amount | ||
| Annualized baseline | Non-profit spending (including pass-through local, state, and federal funds) | 2020/2021 IRS Forms 990 and CO Secretary of State database | Program expenditure only | Total expenditure |
| $24,520,444 | $29,560,054 | |||
| Annualized baseline subtotal | $24,520,444 | $29,560,054 | ||
| 2022 new expenditures | State funds (pass-through) | Homelessness expenditures by state departments (source: long bills) plus disbursements of state funds (including any provided by the federal government) by legislative bills less state department homelessness expenditure in 2021 | $205 | |
| 2022 new expenditure subtotal | $205 | |||
| 2023 new expenditures | State funds (pass-through) | Homelessness expenditures by state departments (source: long bills) plus disbursements of state funds (including any provided by the federal government) by legislative bills less state department homelessness expenditure in 2021 | $16,515,286 | |
| 2023 new expenditure subtotal | $16,515,286 | |||
| Total expenditure | With non-profit program expenditure only | With non-profit total expenditure | ||
| 2022 total | $24,520,650 | $29,560,259 | ||
| 2023 total | $41,035,731 | $46,075,340 |
Appendix E: Full List of Charitable Organizations
| Charitable Organization | Total homelessness expenditure (metro Denver) | Total homelessness program expenditure (metro Denver) | Total program expenditure in Denver | Total program expenditure in Aurora | Total program expenditure in Boulder | Total program expenditure in the rest of metro Denver | Source |
|---|---|---|---|---|---|---|---|
| Almost Home, Inc. | $2,784,327 | $2,437,243 | $0 | $0 | $0 | $0 | IRS Form 990 |
| Archway Housing | $2,057,950 | $1,231,200 | $273,600 | $273,600 | $0 | $684,000 | Annual Report, IRS Form 990, and CSI regionalization |
| Aurora Mental Health Center | $392,572 | $322,479 | $0 | $322,479 | $0 | $0 | HUD Awards and Allocations |
| Aurora Warms the Night | $1,069,784 | $609,777 | $0 | $609,777 | $0 | $0 | CO Secretary of State |
| Bayaud Enterprises | $10,863,462 | $9,768,618 | $9,768,618 | $0 | $0 | $0 | Strategic Plan and IRS Form 990 |
| Boulder Housing Coalition | $670,878 | $626,720 | $0 | $0 | $626,720 | $0 | IRS Form 990 |
| Boulder Shelter for the Homeless | $4,525,528 | $3,846,699 | $0 | $0 | $3,846,699 | $0 | CO Secretary of State |
| Bridge House Boulder | $3,874,870 | $3,189,404 | $0 | $0 | $3,189,404 | $0 | IRS Form 990 |
| Bridge House Aurora | $1,866,521 | $1,626,512 | $0 | $1,626,512 | $0 | $0 | IRS Form 990 |
| Catholic Charities of Denver | $12,087,898 | $9,946,760 | $9,946,760 | $0 | $0 | $0 | IRS Form 990 |
| New Genesis | $789,616 | $722,512 | $722,512 | $0 | $0 | $0 | IRS Form 990 |
| Colorado Coalition for the Homeless | $76,543,569 | $68,889,212 | $58,313,736 | $2,336,124 | $0 | $8,239,352 | CO Secretary of State and CSI regionalization |
| Beyond Home | $1,261,754 | $996,290 | $0 | $0 | $0 | $996,290 | IRS Form 990 |
| Colorado Village Collaborative | $2,568,828 | $2,311,945 | $2,311,945 | $0 | $0 | $0 | CO Secretary of State |
| Denver Rescue Mission | $28,736,548 | $24,538,791 | $24,538,791 | $0 | $0 | $0 | IRS Form 990 |
| Emergency Family Assistance Association | $1,844,210 | $1,627,511 | $0 | $0 | $1,627,511 | $0 | IRS Form 990 |
| Emmaus Housing | $60,404 | $59,196 | $59,196 | $0 | $0 | $0 | CO Secretary of State |
| Family Homestead | $786,771 | $700,226 | $700,226 | $0 | $0 | $0 | CO Secretary of State |
| Family Promise of Greater Denver | $2,129,669 | $1,788,922 | $1,788,922 | $0 | $0 | $0 | CO Secretary of State |
| Gateway Domestic Violence Services | $1,107,102 | $921,947 | $0 | $921,947 | $0 | $0 | IRS Form 990 |
| WellPower | $16,978,213 | $13,178,133 | $13,178,133 | $0 | $0 | $0 | IRS Form 990 and direct provision |
| Metropolitan Denver Homeless Initiative | $4,476,965 | $4,118,808 | $2,814,474 | $288,128 | $464,918 | $551,289 | CO Secretary of State and CSI regionalization |
| Mile High Ministries | $1,135,141 | $1,009,365 | $1,009,365 | $0 | $0 | $0 | IRS Form 990 |
| Mile High United Way | $6,651,952 | $6,076,000 | $4,151,867 | $425,041 | $685,839 | $813,252 | IRS Form 990 and CSI regionalization |
| Mother House | $434,003 | $351,542 | $0 | $0 | $351,542 | $0 | CO Secretary of State |
| Providence Network | $1,942,481 | $1,598,981 | $1,598,981 | $0 | $0 | $0 | IRS Form 990 |
| Rocky Mountain Human Services | $5,068,291 | $4,673,589 | $3,193,568 | $326,937 | $527,540 | $625,544 | IRS Form 990 and CSI regionalization |
| Sacred Heart House of Denver | $515,833.00 | $428,141.00 | $428,141.00 | $0 | $0 | $0 | CO Secretary of State |
| Safe Shelter of St. Vrain Valley | $965,977 | $821,080 | $0 | $0 | $0 | $821,080 | CO Secretary of State |
| Safehouse Denver | $1,129,486 | $880,873 | $880,873 | $0 | $0 | $0 | IRS Form 990 |
| Safehouse Progressive Alliance for Non-Violence | $725,507 | $627,481 | $0 | $0 | $627,481 | $0 | IRS Form 990 |
| Second Chance Center | $1,181,045 | $1,019,455 | $0 | $1,019,455 | $0 | $0 | IRS Form 990 |
| Senior Support Services | $1,020,934 | $913,836 | $913,836 | $0 | $0 | $0 | IRS Form 990 |
| Severe Weather Shelter Network | $784,323 | $708,097 | $0 | $0 | $0 | $708,097 | IRS Form 990 |
| St. Francis Center | $5,400,000 | $4,860,000 | $4,860,000 | $0 | $0 | $0 | Annual Report |
| Step Denver | $1,908,488 | $1,310,095 | $1,310,095 | $0 | $0 | $0 | IRS Form 990 |
| TGHTR | $4,086,325 | $3,052,249 | $0 | $0 | $3,052,249 | $0 | IRS Form 990 |
| The Action Center | $4,914,703 | $4,510,685 | $0 | $0 | $0 | $4,510,685 | IRS Form 990 and direct provision |
| The Comitis Crisis Center | $3,753,727 | $3,265,742 | $0 | $3,265,742 | $0 | $0 | CO Secretary of State |
| Colfax Community Network | $419,801 | $386,217 | $0 | $386,217 | $0 | $0 | CO Secretary of State |
| The Delores Project | $2,483,872 | $1,966,827 | $1,966,827 | $0 | $0 | $0 | IRS Form 990 |
| The Empowerment Program | $4,030,904 | $3,693,086 | $3,693,086 | $0 | $0 | $0 | IRS Form 990 |
| The Gathering Place | $3,082,313 | $2,443,178 | $2,443,178 | $0 | $0 | $0 | IRS Form 990 |
| The Salvation Army | $30,457,072 | $25,417,941 | $17,368,648 | $1,778,090 | $2,869,096 | $3,402,106 | IRS Form 990 and CSI regionalization |
| Urban Peak | $7,860,124 | $6,112,529 | $6,112,529 | $0 | $0 | $0 | IRS Form 990 |
| Volunteers of America Colorado | $21,436,080 | $9,932,455 | $6,787,069 | $0 | $0 | $3,145,386 | IRS Form 990, direct provision, and CSI regionalization |
| Colorado Safe Parking Initiative | $198,347 | $174,545 | $119,271 | $12,210 | $19,702 | $23,362 | CO Secretary of State and CSI regionalization |
| Warren Village | $6,108,137 | $5,156,326 | $5,156,326 | $0 | $0 | $0 | IRS Form 990 |
[i] https://www.hudexchange.info/homelessness-assistance/coc-esg-virtual-binders/coc-esg-homeless-eligibility/four-categories/
[ii] https://www.hudexchange.info/homelessness-assistance/coc-esg-virtual-binders/coc-program-components/permanent-housing
[iii] https://cdola.colorado.gov/more-about-fort-lyon
[iv] https://pfs.urban.org/pfs-project-fact-sheets/content/denver-social-impact-bond-program#:~:text=These%20services%20add%20up%20to,taxpayers%20per%20individual%20of%20%2429%2C000.
[v] http://endhomelessness.org/wp-content/uploads/2017/06/Cost-Savings-from-PSH.pdf
[vi] https://www.ahrq.gov/workingforquality/priorities-in-action/colorado-coalition-for-the-homeless.html
[vii] https://www.calgaryhomeless.com/discover-learn/learn-about-homelessness/homelessness-in-calgary/myths-about-homelessness/
[viii] https://www.huduser.gov/portal/datasets/ahar/2021-ahar-part-1-pit-estimates-of-homelessness-in-the-us.html
[ix] https://independentsector.org/resource/value-of-volunteer-time/
[x] https://www.denvergov.org/files/assets/public/housing-stability/documents/housing/five_year_strategic_plan_final_091321.pdf
[xi] https://www.mdhi.org/blog/boulder-first-in-metro-region-to-hit-homelessness-milestone
[xii] Iris Dimmick “San Antonio to Reevaluate How It Fights Homelessness,” San Antonio Report, October 20, 2019, https://sanantonioreport.org/san-antonio-to-reevaluate-how-it-fights-homelessness/
[xiii] Coalition for the Homeless, “2022 Homeless Count & Survey Analysis, https://irp.cdn-website.com/2d521d2c/files/uploaded/Homeless%20Count%202022_fact%20sheet_final.pdf
[xiv] The Way Home’s Community Plan to End Homelessness 2021-2026 update https://irp-cdn.multiscreensite.com/2d521d2c/files/uploaded/FINAL%20TWH%20Community%20Plan.pdf
[xv] Justin Wm. Moyer “Number of homeless residents in D.C. lowest in 17 years, mayor says,” Washington Post. April 21, 2022
[xvi][xvi] Marissa J. Lang and Justin Wm. Moyer, “Mayor Bowser promised to end homelessness. Here’s how it’s going,” Washington, DC, May 20, 2022
[xvii] Chelsea Cirruzzo, Axios, HUD report reveals D.C.’s homelessness highs and lows, Feb 7, 2022.
[xviii] Family Rehousing Stabilization Program https://dhs.dc.gov/page/family-re-housing-stabilization-program%C2%A0%C2%A0
[xix] Permanent Supportive Housing for Individuals and Families (Project Based, Tenant Based, Local Veterans) https://dhs.dc.gov/page/permanent-supportive-housing-individuals-and-families-project-based-tenant-based-local-veterans
[xx] Kaitlyn Ranney, “Rockford, Illinois: Functional Zero Case Study, July 13, 2020 at https://www.joinbuiltforzero.org/case-studies/case-study-rockford-illinois-reaches-and-sustains-functional-zero-for-veteran-and-chronic-homelessness/#:~:text=As%20part%20of%20Built%20for%20Zero%2C%20Rockford%20changed,by%20name%20and%20target%20efforts%20and%20resources%20accordingly
[xxi] Built for Zero Community Solutions https://www.joinbuiltforzero.org/case-studies/a-mayors-role-in-reducing-and-ending-homelessness-in-rockford/
[xxii] Conor Hollingsworth, “Rockford leaders to count homeless population, aims to provide more shelter,” WIFR Jan. 21, 2022 https://www.wifr.com/2022/01/22/keeping-track-rockfords-homeless-population/
[xxiii][xxiii] By Joanne Kenan, “What Covid Taught This Mid-Sized City About Ending Homelessness,” Politico, February 15, 2022.
[xxiv] https://files.hudexchange.info/reports/published/CoC_HIC_State_CO_2021.pdf
[xxv] https://www.denverhealth.org/-/media/2021-report-to-the-city–digital.pdf
[xxvi] https://www.denvergov.org/files/assets/public/finance/documents/budget/2023/final_mayors-proposed-2023-budget.pdf
[xxvii] https://denvergazette.com/news/government/council-committee-oks-contract-extension-for-hazard-cleaning-service-amid-controversy/article_db7b8830-0b65-11ec-8ca0-cb6a6f16ed70.html
[xxviii] https://www.auroragov.org/common/pages/DisplayFile.aspx?itemId=18333173
[xxix] https://cdn5-hosted.civiclive.com/UserFiles/Servers/Server_1881137/File/City%20Hall/City%20Finances%20&%20Budget/City%20Budget/Past%20Budget%20Documents/Proposed%20Budgets/2023%20Proposed%20Budget.pdf
[xxx] Boulder City Council minutes (9/1/22)
[xxxi] https://stories.opengov.com/cityofboulderco/published/Mhd2Z4jCs