

AUTHOR: CHRIS BROWN
MAY 2020
ABOUT THE AUTHOR
Chris Brown is the Director of Policy and Research with the Common Sense Policy Roundtable where he leads the research efforts of CSPR to provide insightful, accurate and actionable information on the implications of public policy issues throughout the state of Colorado.
ABOUT COMMON SENSE POLICY ROUNDTABLE
Common Sense Policy Roundtable is a non-profit free-enterprise think tank dedicated to the protection and promotion of Colorado’s economy, our mission is to research and promote common sense solutions for the most pressing public policy issues facing Colorado. We examine the economic impact of policies, initiatives, and proposed laws by employing dynamic modeling that accurately measures the impact of each measure on the Colorado economy and individual opportunity. To fully achieve our mission, we actively promote these solutions through the education of policy experts, lawmakers, community leaders, and the general public.
CSPR was founded in 2010 by a concerned group of business and civic leaders that saw divisive partisanship was overwhelming the issues, and objective economic analysis was not being presented to lawmakers and voters empowering them to make fact-based and common sense decisions.
SPECIAL ACKNOWLEDGEMENTS
We would like to acknowledge and thank Jeff Leibach and Cameron Niakan of Navigant, a Guidehouse Company, for their extreme diligence in constructing the Colorado Option Plan Simulation Model and contributing their expertise to the development of the final scenarios.
We would also like to thank Rick Rush, Managing Partner at GERICK, for adding valuable insights into the development of the modeling methodology and scenarios.
Jeff Leibach is a Director with Guidehouse’s Healthcare Practice. Over the last decade, Jeff’s main area of expertise has been in developing and implementing managed care solutions for payers and providers.
Cameron Niakan is a Senior Consultant with Navigant’s Healthcare Strategy team, serving many of the nation’s largest payers and providers in the development of data-driven business strategies.
Richard Rush, FSA is a health actuary with over 30 years of health care and health insurance experience. Rick is the Managing Partner at the consulting firm he established: GERICK. At GERICK he works with health insurance sponsors, health insurance carriers, health care providers, and government programs.
Executive Summary
Background
Before the COVID-19 pandemic brought the nation to a standstill, Governor Jared Polis and a group of Colorado legislators were planning a major new intervention in the state’s health insurance and healthcare markets. They have proposed a new state-controlled health insurance plan, which would first be offered in the individual market and then expand into parts of the employer-provided market.
Their proposal would create a Colorado version of the “public option,” a concept which has received significant attention in national politics but has never been implemented at the federal or state level. Only Washington state is moving ahead with a public option, but it will not be implemented until 2021 at the earliest.i
In Colorado, the latest iteration of the public-option concept is HB20-1349, a bill to create the Colorado Affordable Health Care Option, also referred to as “the Colorado option plan.” Under the bill, starting in 2022, private insurance carriers that offer individual health insurance, would be required to sell the Colorado option plan and hospitals would also be required to participate in the program or risk being closed down. HB20-1349 received its first hearing in the House Health and Insurance Committee on March 11, 2020 – three days before the Colorado legislature adjourned indefinitely as part of the broader COVID-19 shutdown.
As this study was going to press, the sponsors of HB20-1349 announced they would not pursue their bill during the remainder of the 2020 legislative session. Instead, they declared their intention to reintroduce and pass the Colorado option plan during the 2021 session, which begins eight months from now.
Before the delay, however, supporters of the legislation had provided limited analysis about how the introduction of a new government-controlled health plan would impact the state’s healthcare system in or the overall state economy. In this study, we explore those impacts and attempt to provide some transparency into how the Colorado option plan, as originally proposed, would function.
Gaps in Current State Analysis
By mandating lower payments to hospitals, which create below-market premiums for the Colorado option plan consultants hired by the Polis administration have predicted the government-controlled health plan could reduce statewide average premiums for individual health insurance by 12% in the program’s first year.ii But the published reports from these consultants do not adequately explain where these reductions will come from, who will pay for them, and how these changes will impact the delivery of healthcare in Colorado or the broader state economy.
For example: The reports acknowledge that many households in the individual market will be under financial pressure to drop their current private health plans and enroll in the Colorado option plan instead. This is because the introduction of the Colorado option plan would likely reduce the federal tax subsidy these households currently receive for their private health plans. Therefore, according to the state-commissioned reports, “subsidized members who choose to remain in their current plan … would see an increase in their net premium after subsidy”iii It may be possible to “partially or fully offset this loss of buying power” with help from the federal government, but the state’s consultants also concede this is far from certain.
These cost increases would create enough financial pressure for 50% of subsidized households to drop their private health insurance plans and enroll in the government-controlled Colorado option plan in the program’s first year, according to the reports. The actual number of people represented by this percentage is not included in the report, nor is an assumption on the impact to the unsubsidized enrollees.
While the Wakely modeling may have been limited in scope, thereby not covering the potential migration existing coverage options, it is important for policy makers and the public to understand the full potential enrollment in the Colorado plan. As without these estimates, policymakers and the public have no way of judging the potential impacts across the rest of the healthcare system.
As concerning as this gap in the state’s analysis may be, there is a bigger one: State officials have only published estimates for the first year of the Colorado option plan. The reports produced for the state do not offer any predictions beyond 2022, even though current plans call for major expansion of the Colorado option plan in the near term.
Under the original bill text of HB20-1349, state officials would have the authority “to promulgate rules to expand the Colorado option plan to the small group market” by January 2023. In practical terms, this would mean in the Colorado option plan could start operating in part of the employer-provided insurance market in 2024. An amendment passed in the first committee of reference in the Colorado House, would change this timeline so that an advisory board would first need to vote to introduce the Colorado option plan within the small group market by July 2024 at the earliest. The eventual introduction of the Colorado option plan in the group markets would significantly increase the size and scope of its impacts across the state’s health care system.
But the state-commissioned reports into the Colorado option plan leaves this anticipated expansion totally unexamined. This is remarkable because under current proposals, 2024 would be the Colorado option’s third year of operation. Therefore, as things currently stand, policymakers are being asked to approve a sweeping expansion of state authority in the financing and delivery of healthcare with very limited information about the likely impacts of such an expansion.
Filling the Gaps to Inform the Debate
To shed more light on the debate, the Common Sense Policy Roundtable partnered with international consulting firm Navigant, now a Guidehouse Company, to study the potential impacts of the Colorado option plan. Our work updates and expands upon a September 2019 studyiv on the same subject, using the design recommendations and policy details that the Polis administration and key legislators have unveiled since then.
We examined four different scenarios with a series of sensitivity cases across those four scenarios – low, moderate and high – to better understand the potential impacts of the partial implementation and full implementation of the Colorado option. According to our findings, full implementation of the Colorado option may trigger the following impacts under a moderate case:
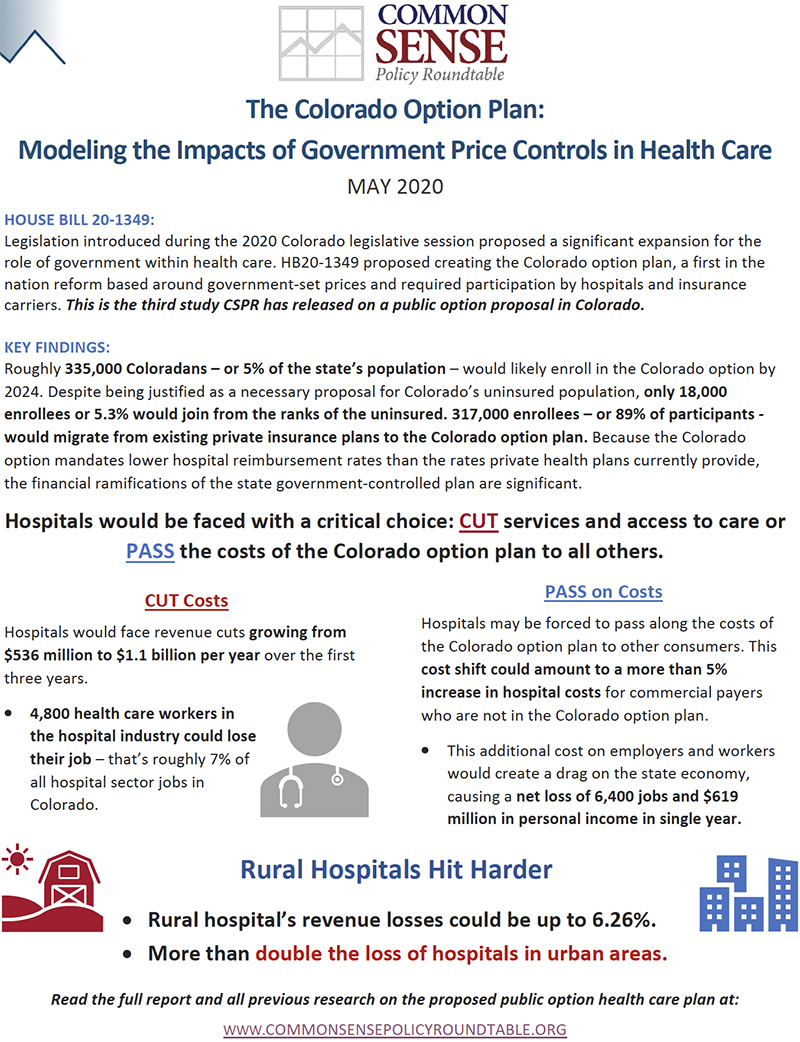
- Roughly 335,000 Coloradans – or 5% of the state’s population – may enroll in the Colorado option by 2024. It would recruit heavily from the private insurance market, with 317,000 enrollees migrating from existing plans to the Colorado option, compared to just 18,000 enrollees who would join from the ranks of the uninsured.
- Because the Colorado option mandates lower hospital reimbursement rates than private health plans, the financial ramifications of the government-controlled plan are significant. As people move from private plans to the Colorado option, hospitals would face revenue reductions of $536 million per year to $1.1 billion per year over the first three years, under moderate enrollment.
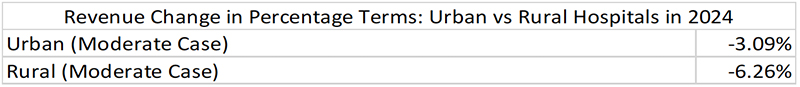
- Rural hospitals would be disproportionately negatively impacted, and face reduction in revenue double what urban hospitals would face on a percentage basis. The modeling results of offering the Colorado option plan in both the individual and small group market, with a federal waiver in 2024, estimate a 3% reduction in revenue for urban hospitals and a 6.3% reduction for rural hospitals.
- Hospitals would be faced with a choice: Cut services and access to care and/or pass the costs of the Colorado option to the private plans that remain in the individual and employer-provided insurance markets.
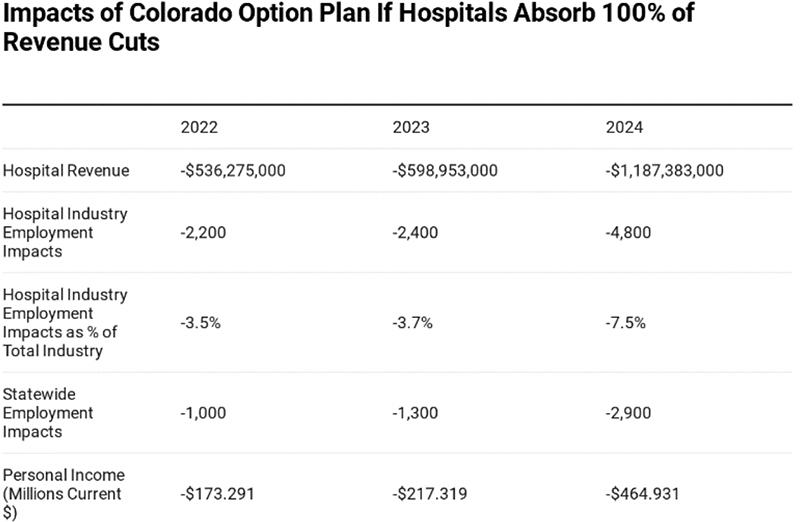
- If hospitals absorb all of the Colorado option’s revenue cuts, hospitals across the state would lose 4,800 health care workers – roughly 7% of all hospital jobs in Colorado. The impact of these job losses would be felt across the entire economy, causing a further loss of 2,500 jobs in other industries and a loss of $465 million in personal income against the baseline each year.
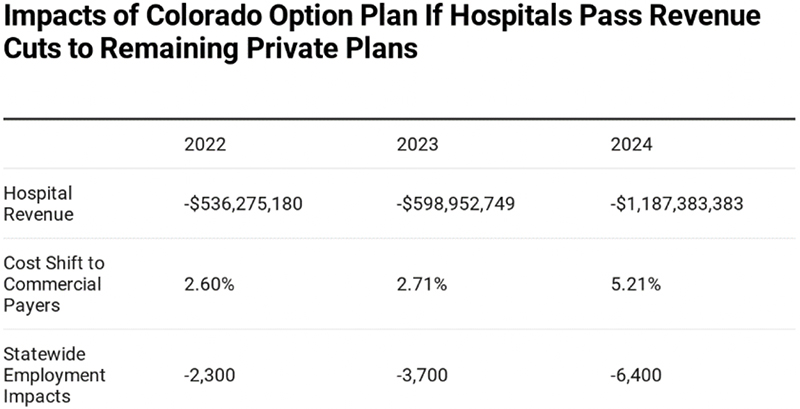
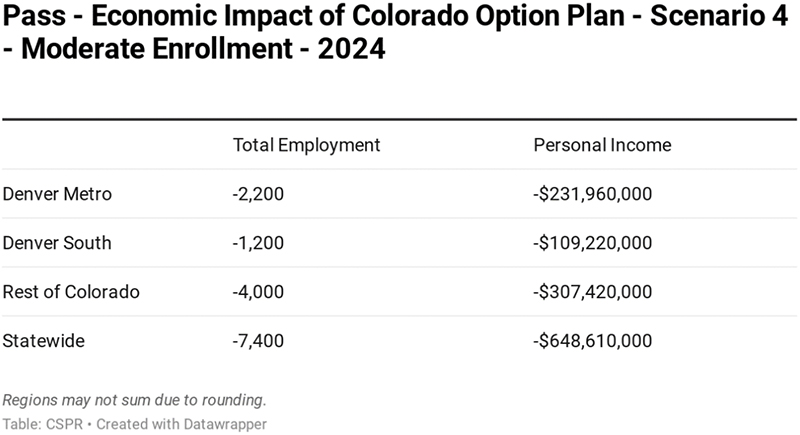
- To avoid reduced services, hospitals may pass along the costs of the Colorado option plan to private plans, including self-insured programs. If this occurs, people who are not enrolled in the Colorado option plan could see their insurance premiums rise by more than 5%. This additional cost on employers and workers would create a drag on the state economy, causing a net loss of 6,400 jobs and $619 million in personal income in 2024.
The Impact of COVID-19
Even under normal conditions, revenue losses of this magnitude would have a major impact on the delivery of healthcare services in Colorado. However, the current conditions of the Colorado healthcare system are anything but normal right now.
Battling the COVID-19 outbreak has inflicted severe financial losses on the Colorado hospital system. According to the Colorado Hospital Association, those losses were conservatively estimated at $1.2 billion as of mid-April 2020 and may reach $3 billion by the end of this year according to more recent reportingv. More than 50 hospitals across Colorado, almost two-thirds of hospitals in our state, are now considered financially vulnerable because they have operating margins of below 4%.
Federal dollars for the COVID-19 response may help, but the odds of this assistance covering all the budget shortfalls caused by the pandemic are “miniscule,” according to hospital sector officials.vi
Therefore, proposals like the Colorado option plan, which may cut annual hospital revenues by a further $1.1 billion within three years, deserve even closer scrutiny than they did before. Further reductions in revenue could push one of the top-rated hospital systems in the countryvii to a breaking point when the COVID-19 crisis has clearly demonstrated the need to make sure hospitals are adequately resourced and well-staffed.
At the same time, the catastrophic economic impacts of the COVID-19 pandemic cannot be overlooked. In the space of five weeks, more than 300,000 Coloradans filed new unemployment claims due to the economic shutdown trigged by COVID-19. This exceeds 10% of the civilian workforce. State and local officials have made tentative steps towards reopening the economy, but it remains to be seen how many businesses will survive and how quickly employers can start putting people back to work.
In this context, the potential economic impacts of the Colorado option plan must be carefully considered. The economic and fiscal impacts of the COVID-19 crisis will be felt for years, and during this time, every job and every dollar of consumer spending will be needed to put Colorado on the path to recovery. Therefore, policymakers should ask themselves whether the state economy can afford anything that would reduce employment, increase the cost of hiring new workers or leave households with less money to spend on goods and services.
Governor Jared Polis recently declared the COVID-19 economic shutdown had left insufficient revenues “to carry on the functions of the state government and support its agencies and institutions.”viii The governor ordered immediate emergency budget cuts to get the state through the current fiscal year, which ends June 30, and state officials are bracing for severe budget shortfalls over the next few budget cycles. According to preliminary estimate produced in late March, the state budget will face a cumulative shortfall of more than $6.7 billion between now and fiscal year 2023. The same presentation also noted the last two recessions in Colorado each lasted four budget years.
In the current environment, it is clear the State of Colorado struggling – quite understandably – to maintain the core functions of government in the face of a global pandemic and the economic shutdown tied to this public health crisis. Therefore, it is to be commended that supporters of HB20-1349 made a welcome decision not to push the Colorado option plan any further during the 2020 legislative session.
However, backers of the Colorado option plan also announced their intention to pass the bill next year, during the 2021 legislative session. While the future remains highly uncertain, it is hard to imagine that Colorado’s state budget, the broader economy or the state’s healthcare system will have recovered from the COVID-19 emergency in less than eight months.
If the backers of the Colorado option plan are planning another legislative push in 2021, it will give them time to expand the scope of their analysis into how their proposal will work, how it will be paid for, how it will impact the state’s healthcare system, and how the broader economy will respond. Getting answers to these questions was critically important while the state was experiencing good economic and fiscal conditions. These questions are even more important in challenging times.
Introduction
Background on CSPR Work on the Topic
Since 2019, the Colorado state legislature and the Polis administration have been developing a proposed state option, or public option, for health insurance coverage. To inform policymakers and the public about the likely impacts of a version of a public option in Colorado, the Common Sense Policy Roundtable has produced two reports on this subject and provided direct feedback to state agencies and legislative committees.
The highlights of CSPR’s involvement in the public option debate are summarized below.
September 2019:
CSPR published a study examining the impacts of a Colorado public option based on actuarial modeling from Washington state on a similarly structured policy.ix CSPR’s economic modeling indicated:
- Reduced reimbursements to health care providers could range from $494 million up to $1.4 billion.
- The loss of 1,500 to 4,500 health care workers across Colorado, exacerbating the state’s existing shortage of health care providers.
- If lost revenues from reduced reimbursements are shifted to employer-provided insurance plans and other private sources, the cost of health care coverage for businesses and workers could increase by more than 5%. This would create a drag on the economy that costs between 2,900 and 8,320 jobs and $320 million to $919 million in total GDP.
- The state’s individual health insurance market could lose 80% to 100% of its members as people drop private coverage in favor of the public option’s subsidized, below-market premiums.
- The employer-provided insurance market, which is the biggest source of health coverage for Coloradans in the state, could also lose 2.7% to 8.3% of its members.
October 2019:
In response to a draft public option proposed from the Colorado Division of Insurance and the Colorado Department of Health Care Policy and Financing, CSPR joined members of the REMI Partnership in submitting formal comments to state officials.x Our submission posed a series of questions for the architects of the public option, including:
- What would be the net change in revenue going to medical providers, by category of provider, as a result of people migrating to the state option?
- What would the projected enrollment in the state option plan be?
- How would the state option impact different regions of the state?
- What is the operational plan for the state to set the state option premium reimbursement rates across the state?
Our submission also included some initial observations about the draft proposal, including state caps on reimbursement to a fixed percentage of Medicare reimbursement rates:
We encourage the administration to slow down, invite all stakeholders to the table, and work with Coloradans to better understand the true impact of changing the health care marketplace. There are other policy tools that can address fundamental issues that are driving the high costs of health care.
This approach does not solve the problem of high costs, it merely ensures that medical providers will be left with the difficult choice between finding ways to reduce costs that may adversely impact quality or bypassing costs on to the remaining private insurance market. We appreciate the administration’s verbal commitment to protecting Colorado’s communities and preventing cost-shifting onto employers but do not see how these efforts are compatible with a proposal that includes statewide benchmarked payments to Medicare, well below current market rates. Legislating lower prices does not make costs disappear, it simply shifts those costs somewhere else. The impact of this inevitable shift is left unanswered by this proposal and it is of the utmost importance.
We encourage the administration to slow down and work with us to better understand the true impacts of fundamentally changing the health care marketplace.
January 2020:
In response to the Polis administration’s final report on the public option, and in anticipation of legislation implementing the report’s design recommendations, CSPR published a follow-up report in partnership with Rick Rush, the managing partner of GERICK, a healthcare actuarial and consulting firm.xi
The report focused on questions left unanswered by the state’s public option report – questions that legislators would have to tackle when drafting a bill to implement the public option. Those questions included:
- If savings for buyers of public option insurance come through lower revenue to both hospitals and insurance companies (with restrictions), without significant change to their costs, how will their decisions impact patient access and choice?
- What choices will hospitals have to make if facing lower revenue and lesser/no change in costs or expectations from investors and community partners?
- How will insurance carriers respond to a mandate to sell the public option insurance product?
- How will other medical service providers, besides hospitals, be impacted by the implementation and possible expansion of the public option?
- How will employers react to a public option plan and will they be impacted by future cost-shifting?
- As employers, regulators, and health care providers, how will Colorado state and local governments be impacted by a public option?
After weighing these questions, the report offered the following conclusion:
There have been numerous structural changes to the health care system that have led to cost increases that are not sustainable. Yet, the system is complex, and involves multiple stakeholders, and layers of laws from both federal and state government. Thoughtful, meaningful reform, that does not cause further market distortions is necessary. The public option debate raises several very important concerns within our health care system; however, the final report still contains many outstanding questions.
Savings resulting from government set rates passed to consumers have to come from somewhere, and by just lowering negotiated rates paid to hospitals, without truly addressing underlying costs of delivering care, a public option stands to benefit a few Colorado consumers, at the expense of every other stakeholder.
Background on Policy and History of Legislation
The policy debate over a public option has taken place on parallel tracks at the federal and state level.
The public option, or a government-run health plan designed to attract customers away from private health insurance, was proposed and rejected by federal policymakers in the debate over the Affordable Care Act in 2009 and 2010. In recent years, however, it has received fresh attention in Congress and on the presidential campaign trail.
For example, a leading proposal in Congress – the Medicare-X Choice Act of 2019xii – would create a new government-run health plan for the individual and small group insurance markets. To lower the cost of premiums, the Medicare-X public option would pay healthcare providers significantly less than private health plans. Instead of using commercial reimbursement rates, Medicare-X would pay the same as the federal Medicare program for senior citizens. This mandatory reimbursement rate – set at 100 percent of Medicare – could be increased no higher than 125 percent of Medicarexiii for medical practices and hospitals in rural areas.
Reimbursement rates at Medicare levels, or a percentage of Medicare levels, have caused concern among healthcare providers in the debate over the public option as well as single-payer proposals such as Medicare for All. This is because average Medicare reimbursement are below the cost of treating patients in hospitals.xiv In Colorado, the total of Medicare payments to Colorado hospitals was just 70% of the average expenses attributed to those patients, according to 2018 data from the Colorado Health Care Affordability and Sustainability Enterprise.
In 2019, Colorado legislators and the Polis administration decided to pursue their own version of the public option at the state level. House Bill 1004 directed state agencies to develop and submit a proposal for a “state option” to the legislature by November 2019. On the day the bill was introduced, one of the authors of HB-1004 said the proposal would have the same fundamental design as the proposed public option at the federal level:
“You’d be buying a plan that’s at Medicare reimbursement rates. … It could potentially be administered through a nonprofit like Kaiser, but it’s not a private company plan.”xv
HB-1004 was signed by Governor Jared Polis on May 17, 2019. After a series of stakeholder engagement sessions, the Colorado Department of Healthcare Policy and Financing and the Colorado Division of Insurance released a draft report on the Polis administration’s recommendations for the design of a “state option” on Oct. 7, 2019.xvi
The draft report recommended against the state setting up and financing its own insurance plan to compete with private health insurance. Instead, state officials would design a new insurance plan and require private insurance carriers to sell it alongside their own plans. The price of public-option premiums would also be fixed by state officials.
The state-sponsored plan would initially be introduced into the individual insurance market, which covers roughly 7% of Colorado’s population, but the proposal also called for an expansion into the small group section of the employer-provided insurance market. In Colorado, employer-provided insurance is the largest source of health coverage. Employer-provided insurance also provides the vast majority of private health coverage in Colorado, accounting for 88 percent of all private plans.
To support lower premiums, a further set of price controls was recommended over healthcare providers. Instead of negotiating rates with hospitals, the draft report recommended the state government would set rates at a percentage of Medicare payment levels.
Since the publication of the draft report, the Polis administration published a final report in November 2019, and then released an update to its final proposal in February 2020. Throughout this process, revisions were made to the Medicare-based reimbursement rate along with the predicted impact of the public option on premium levels in the individual insurance market, and the number of people who would leave the ranks of the uninsured.
These updates and revisions were accompanied by a series of forecasts prepared by Wakely Consulting Group, which are summarized in the table below.xvii
Figure 1: Summary of Series of Wakely Modeling and Key Figures
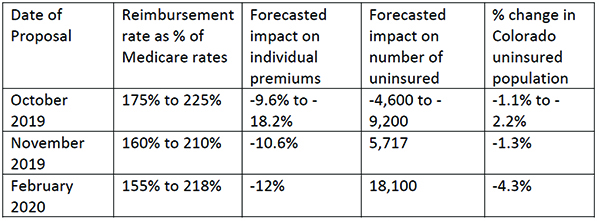
These forecasts included some important caveats. Wakely observed that “[t]he assumptions and resulting estimates included in this report and produced by the modeling are inherently uncertain,” and the uncertainty was “amplified” because “in most instances Colorado specific data was not available.”
However, even if these forecasts are taken at face value, they shed important light on the debate. In particular, the forecasts commissioned by the Polis administration show the public option would reduce the state’s uninsured population – which currently stands at approximately 425,000 according to the Kaiser Family Foundation – by only 1.1% to 4.3%.
This runs contrary to one of the core objectives of the public option. For example, the introduction of the October 2019 draft report on the public option says “90% of uninsured Coloradans cite ‘cost’ as the reason they are not covered” and further states that “affordability is the largest barrier to coverage.” Likewise, strong supporters of the public option – including the Center for Health Progress and Colorado Fiscal Institute – have suggested this proposal as a solution for the roughly 8% of Coloradans who are uninsured. “[W]e have a shared priority in finding a pathway forward for a public option because we sincerely believe that the 90% of uninsured Coloradans who list cost as the primary reason they lack coverage need more affordable options,” the groups wrote in a recent letter to state lawmakers.xviii
But the Wakely forecasts indicate fewer than 1 in 20 uninsured Coloradans would obtain health insurance after the introduction of a public option. This is consistent with other work showing that 58% of the uninsured population are already eligible for public coverage yet were not enrolled.
The Wakely forecasts also suggest that without an approval from the federal government, the public option may increase rather than decrease the cost of insurance for households already in the individual insurance market. Under the federal Affordable Care Act, lower income and middle-income households – i.e. those making 400 percent of the federal poverty line or less – receive tax subsidies to reduce the cost of monthly health insurance premiums.
However, the impact of the proposed public option on the ACA formula would reduce the value of these tax credits and increase how much these households pay for individual market health insurance if they choose to keep their current plan. In its November 2019 forecast, Wakely found “subsidized members who choose to remain in their current plan, rather than switching to the public option would see an increase in their net premium after subsidy.”
In February 2020, Wakely reiterated that these households “could pay higher premiums under the Colorado Health Insurance Option as the reduction in premium subsidy reduces their buying power.” Wakely’s forecast suggested state officials could ask the federal government for more funding, by means of a ACA waiver, to “partially or fully offset this loss of buying power.” But the authors of the forecast declined to comment on the likelihood of additional federal funds being approved.
In March 2020, the public option debate took a further step forward with the introduction of HB-1349. The bill would authorize state officials to design and implement the Colorado Affordable Health Care Option by Jan. 1, 2022.
According to the bill summary prepared HB-1349 sponsorsxix and an analysis prepared by Legislative Council,xx the proposed legislation would:
- Authorize the Colorado Insurance Commissioner to develop and implement a Colorado option plan for the individual health insurance market
- Require private insurance carriers to sell the Colorado option plan in counties where they provide their own individual health insurance plans
- Require insurance carriers spend a minimum of 85 percent of premiums collected on patient care
- Reimburse hospitals for inpatient and outpatient services using a formula based on Medicare reimbursement rates
- Require hospitals to participate in the Colorado option
- Authorize state officials to impose fines, or suspend, revoke, or impose conditions on the hospital’s license if they do not agree to participate in the Colorado option
- Authorize the Colorado Insurance Commissioner to expand the Colorado option plan into the small-group employer-provided insurance market starting in 2024
The base reimbursement rate for hospitals under HB-1349 would be 155% of Medicare. The Colorado Insurance Commissioner would have the authority to increase the reimbursement rate of individual hospitals by as much as 110% of the Medicare reimbursement rate under certain conditions. One day after the introduction of HB-1349, the Polis administration released a list of proposed maximum reimbursement rates for individual Colorado hospitals, ranging between 155 percent and 238 percent of Medicare.xxi
HB-1349 also instructs the Colorado Insurance Commissioner to develop rules that will “mitigate any adverse impacts the Colorado option plan has on the purchasing power” of households below 400 percent of the federal poverty line. This reflects the Wakely Consulting Group’s finding that these households will receive lower federal tax credits and pay more in monthly premiums after the introduction of a public option.
HB-1349 received its first legislative hearing in the House Committee on Health & Insurance on March 11, 2020. It passed the committee along party lines before the legislative session was suspended in response to a state of emergency declared due to the COVID-19 pandemic.
Modeling the Impacts of the Colorado Option Plan
Guidehouse Colorado Option Plan Model
The actuarial analysis previously released by the state evaluating different public option proposals for Colorado, have looked at several key areas of the issue. The reports produced by Wakely have evaluated the potential premium reductions for consumers across Colorado and have estimated the potential enrollment in a public option plan from those that were previously uninsured. Yet what has not been released as part of the debate thus far, is exactly how a broader range of stakeholders will be impacted.
The effort behind the Colorado option plan is to reduce health insurance premiums for Coloradans. However, as discussed earlier in the paper, the manner with which the Colorado option plan delivers those savings, comes at the expense of many other stakeholders.
The stakeholder most directly impacted is arguably hospitals, as they would be required to accept the Colorado option plan, with the state-set reimbursement rates. This would have the effect of lowering the amount of revenue that hospitals are paid for each patient they treat with the Colorado option plan, who was previously insured through a different commercial plan.
The government already sets rates for Medicare and Medicaid, which according to recent analysis from the state, don’t cover the full cost of care. The current cost shift dynamic underlying our health care marketplace is driven from the need to compensate for losses from public payers. The Colorado option plan and the government entrance into setting prices within the private marketplace, would only put further pressure on this dynamic.
CSPR contracted with Navigant, now a Guidehouse company, to build a model capable of estimating the direct impacts to hospital revenues resulting from the potential implementation of the Colorado option plan. The model is set up to allow for several scenarios.
The results shown in this report cover 4 scenarios with three different potential enrollment migration levels.
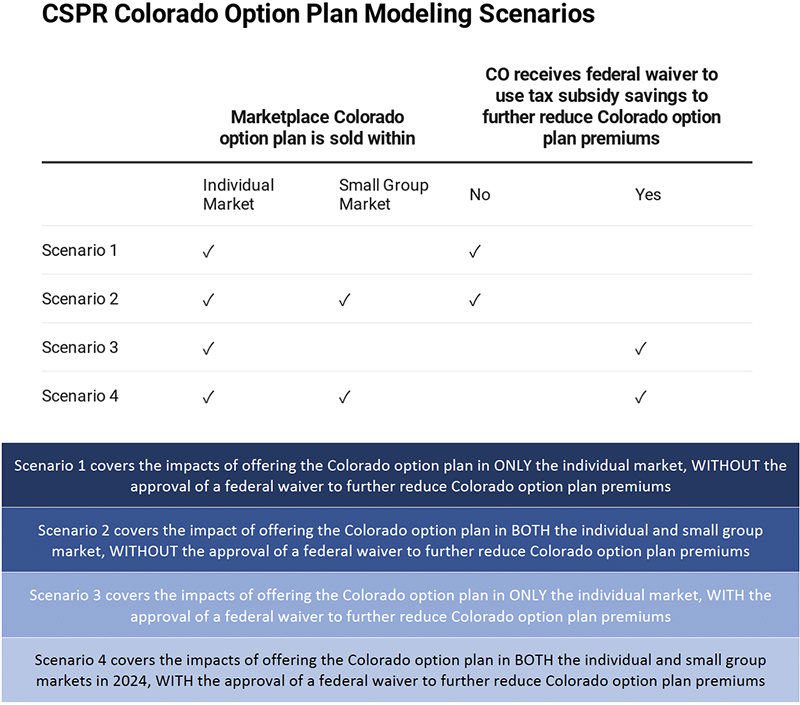
Modeling Scenarios
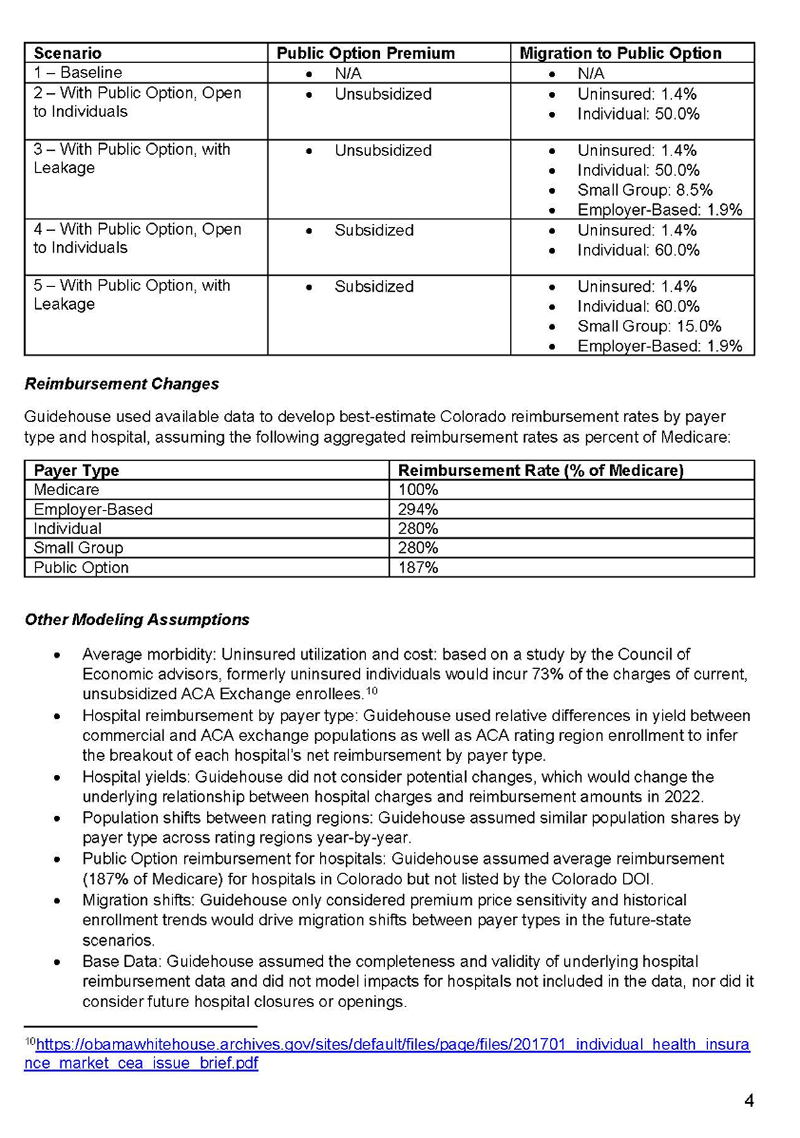
Included in the appendix of this report is a letter from the Guidehouse consulting team describing the methodology for how the model was constructed. While there are many different variables that go into modeling the potential impacts of the Colorado option plan, the scenarios developed for this report reflect varying levels of impacts based on two sets of potential outcomes.
The first potential outcome is whether or not the Colorado option plan is offered within just the individual group market, or the small group market as well. The final report, developed by the state under HB19-1004, recommended the eventual offering of a public option plan in the small group market. The current legislation, HB20-1349, allows for the offering of a Colorado option plan in the small group market with a majority vote by the advisory board and the development of new rules by the DOI commissioner by July 2024.
The second potential outcome is whether or not Colorado receives the approval of a federal waiver to use the savings from reduced premium tax credits from those in the individual market who switch to the Colorado option plan, to further reduce premiums, through what has been referred to as a premium wrap. The most recent actuarial modeling released by the state assumes that the state does receive the federal waiver and therefore is able to lower premiums even further.
The model includes growth assumption in population, insurance coverage trends and medical cost trends to estimate a 2022 through 2024 baseline. While the current crisis due to COVID-19 may alter the longer-term outlook for health care, this model reflects projected trends prior to the current crisis. As explained earlier in this paper, the impacts of COVID-19 are expected to worsen the financial position of hospitals and medical providers and therefore the results of the modeling scenarios shown here, would only add to the projected revenue losses experienced during the current crisis.
The table below shows the key assumptions in each of the four scenarios.
Figure 2: Modeling Scenarios Outline
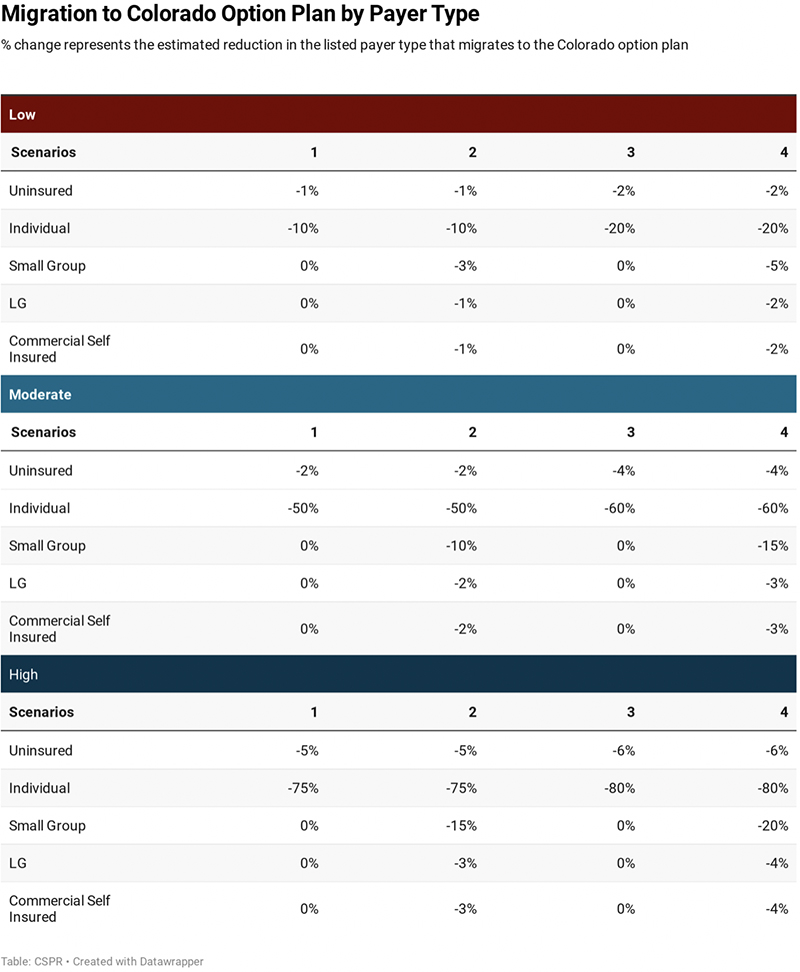
Enrollment Migration Assumptions
Under each scenario, there are three different potential enrollment migration levels to the Colorado option plan. Enrollment migration captures how many people enroll in the public option, and what type of payer those individuals were, prior to enrolling in the Colorado option plan.
For each scenario there are a set of low, moderate, and high enrollment migration responses. The table below shows the migration changes for each set of enrollment assumptions. The percent reduction for each type of payer reflects the share of that group that choose to enroll in the Colorado option plan.
The moderate enrollment levels reflect the most likely impacts of the Colorado option plan based on available data and expert knowledge. The high scenario reflects slightly higher levels of migration to the Colorado option plan, and the low scenario reflects lower levels of migration.
Most of the results shown in this report reflect the potential impacts for the calendar year 2024 against the trended baseline. Based upon an amendment to the current legislation, the earliest the Colorado option plan could be offered in the small group market is July 2024 however the results shown in this report reflect the estimated full calendar year impacts to give a better sense of the scale of the impacts and reflect the original bill text.
Figure 3: Enrollment Migration Level Modeling Assumptions
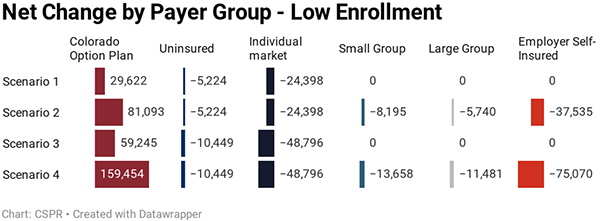
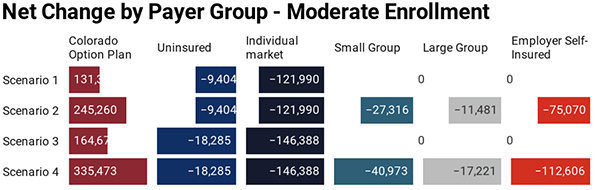
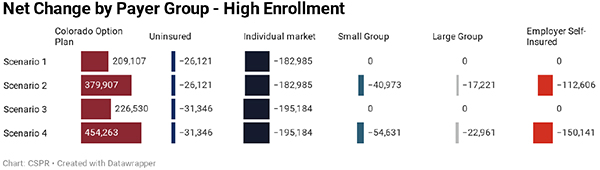
Based upon the enrollment migration assumptions, a certain portion of existing commercial payers migrate to the Colorado option plan. Figure 4 shows the projected level of enrollment in the Colorado option plan based on each scenario and alternative migration enrollment level. It also shows the Colorado option plan enrollment as a percent of the entire state population.
Figure 4: Enrollment in Colorado Option Plan by Scenario and Enrollment Migration Level – 2024
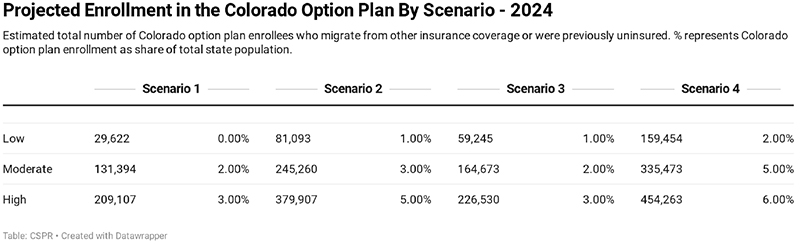
Figure 4 shows the number of individuals who are projected to enroll in the Colorado option plan in 2024, along with how many fewer people are projected to be in each of the other payer categories. The sum of the reductions in each non-Colorado-option-plan payer group equals the total enrollment in the Colorado option plan.
Figure 5: Enrollment Migration Levels by Scenario – 2024
Migration from Uninsured
The potential enrollment in the Colorado option plan from those who were previously uninsured are the only enrollment migration estimates which have been offered in previous actuarial modeling. Estimates from Wakely on those who were previously uninsured and chose to enroll in the Colorado option plan have ranged from 5,717xxii to 18,100xxiii depending on the scenario and the underlying assumptions.
The moderate level migration from those that are currently uninsured to the Colorado option plan is assumed to be 1.8% to 3.5% of the total number of uninsured depending on whether or not a federal waiver is approved. That translates to between 9,404 and 18,285 individuals, within the range estimated by Wakely.
The migration of individuals who were previously uninsured to the Colorado option plan has the effect of increasing hospital revenue. This is because the amount paid in Colorado option plan premiums, is assumed to be more than what they were paying for hospital services previously.
Migration from Within the Individual Market
The market expected to be impacted the most will be the individual market for health insurance. There are many reasons to believe that a large share of those on existing plans within the individual market would migrate to the Colorado option plan given it will offer premiums below current market rates and maintain similar benefits.
While the Wakely reports do not provide a specific number, the most recent analysis released as part of their February 21st report “assumed that 50% of subsidized enrollees would remain in their current plan offering, rather than switching to the Colorado Health Insurance Option Plans”. Using this assumption, we can extrapolate to get a sense of a range of potential enrollment in the Colorado option plan from the current individual market plans.
Key assumptions:
- The DOI 2017 Health Cost report indicates 56% of the individual market is on the exchange
- The 2017 Connect for Health Annual report indicated 76% of those on the exchange receive financial support
While Wakely does not indicate their assumed level of migration from the unsubsidized market, if it was the same as their assumed level for the subsidized market, it would mean that 50% of the total individual market would be on a Colorado option plan. It is likely that enrollment in Colorado option plans would be much higher for the unsubsidized portion of the individual market, as there are no federal tax credits. If 75% of the unsubsidized market migrated to a Colorado option plan it would mean that over 64% of the individual market would be on the Colorado option plan. At 90% the share of the current individual market enrolled on the Colorado option plan increases to 73%.
The low, moderate and high enrollment migration estimates shown in figure 2, reflect this range of potential migration levels. The high scenario reaches 80% migration which would assume a higher level of migration from the currently subsidized market than indicated in the Wakely modeling.
Migration from Employer Sponsored Coverage
The employer market includes several payer groups such as the small group market, the large group market and the commercially self-insured. The levels of migration from existing employer coverage reflects less of an impact than the level of migration from within the individual market.
Both the traditional small group and large group market represent firms who have chosen to buy fully insured health insurance coverage from an insurance company. The insurance products purchased by these two payers are regulated by the Colorado Division of insurance and cover 12% of all Coloradans, with 4% covered by small group plans and 8% covered by large group plans.
The commercially self-insured payers include companies who offer health coverage for their employees but don’t purchase a traditional insurance product to do so. This group of payers covers 52% of Coloradans in the model.
While the modeling scenarios only cover the Colorado option plan being explicitly offered within the individual and small group markets, it is likely that large employers would also see some of their covered employees migrate to the Colorado option plan. This would occur largely dependent upon how an employer had their premium cost sharing for health care set up. Employees may find it more attractive to purchase the Colorado option plan than use financial support from their employer to cover the premiums.
Results
The combined effects of the migration from different payer groups to the Colorado option plan, causes a net reduction in hospital revenue across all scenarios, given the lower payments to hospitals from the Colorado option plan relative to other commercial payers.
Figure 6 shows the statewide impact on hospital revenue across all 4 scenarios and 3 enrollment migration levels.
Figure 6: Impact of Colorado Option Plan Scenarios on Hospital Revenue
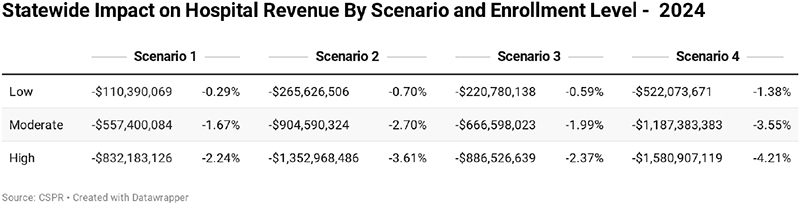
Figure 7: Map of Colorado Health Insurance Rating Areas
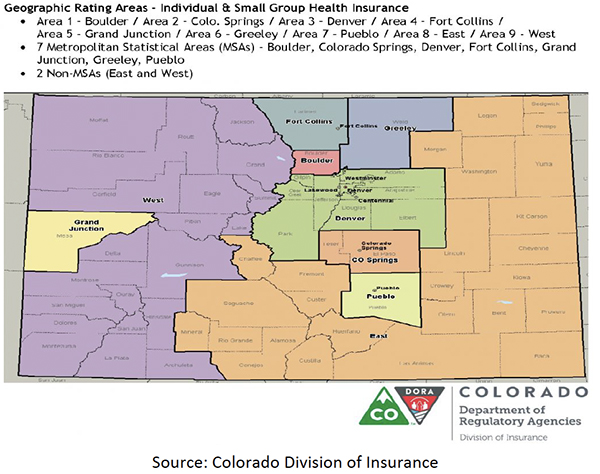
Figure 8 breaks the results down even further to show the hospital revenue impacts by insurance rating area.
Figure 8: Impacts on Hospital Revenue by Insurance Rating Area
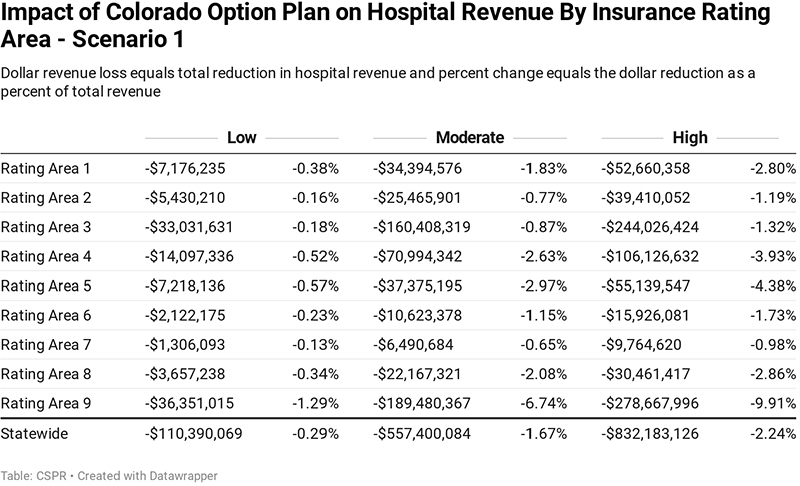
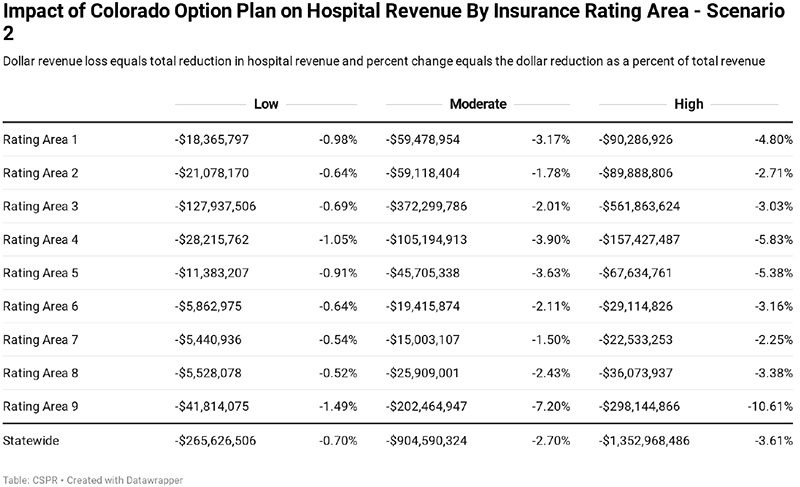
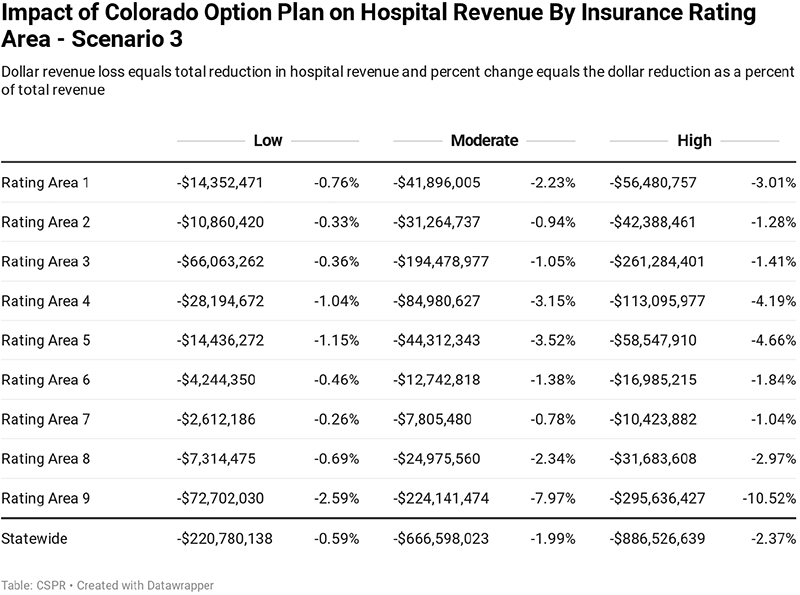
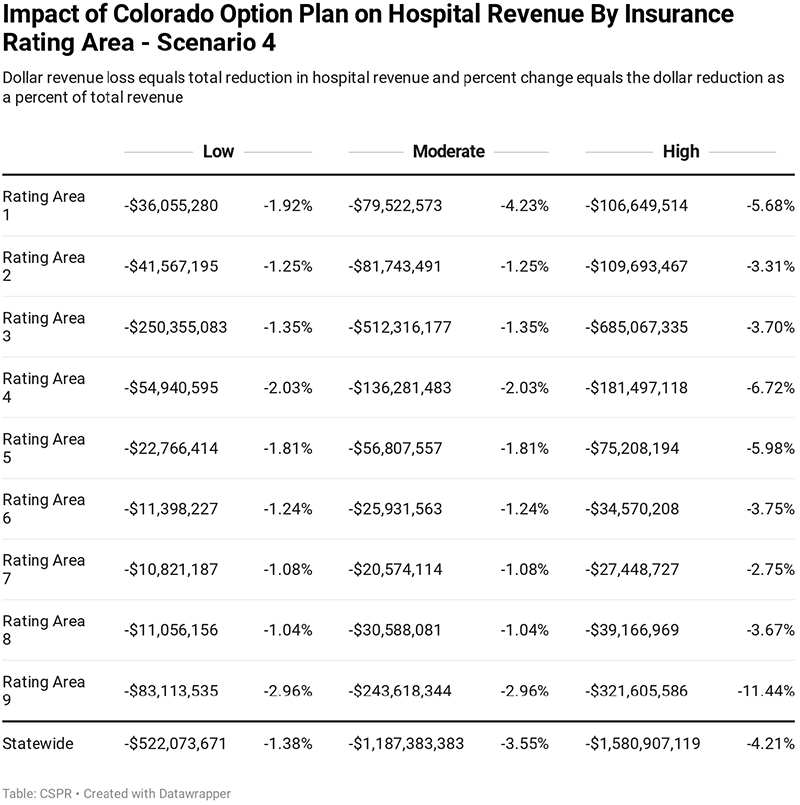
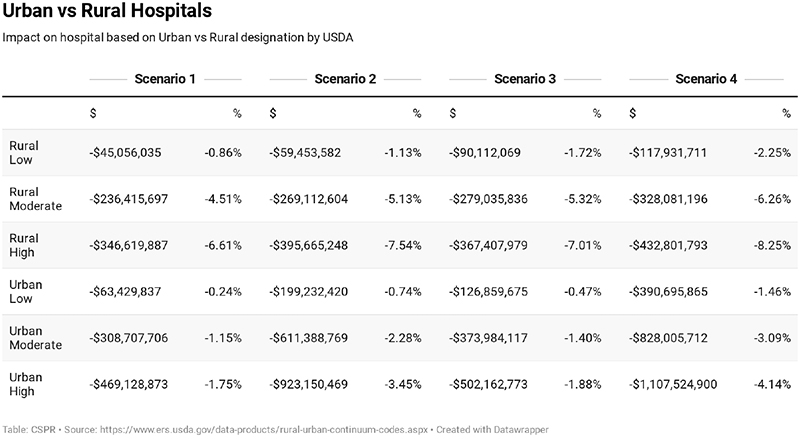
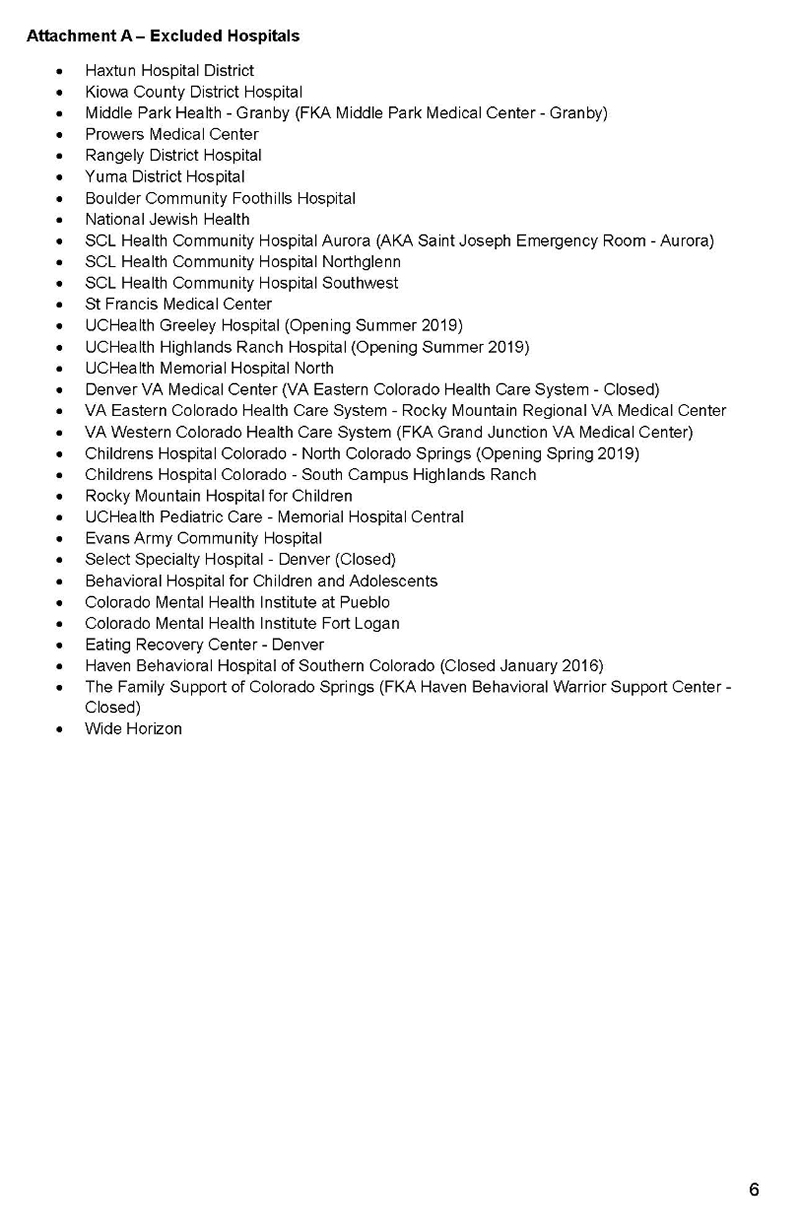
Figure 9 breaks the impacts on hospital revenue out based on an urban vs rural distinction. The distinction of urban vs rural hospitals is broken out based on USDA coding.1
Figure 9: Impact on Rural vs Urban Hospital Revenue
Economic Impact Modeling
The economic impacts of the Colorado option plan on the state’s economy were determined using the REMI PI+ model. PI+ is a dynamic economic and demographic forecasting and simulation model, built by the company REMI, or Regional Economic Models Inc.
The PI+ model licensed by CSPR contains three regions that cover the entire state of Colorado. Metro Denver covers the counties of Denver, Boulder, Broomfield, Adams, and Jefferson. Denver South covers the counties of Arapahoe and Douglas. The rest of Colorado region covers all other counties in Colorado.
Figure 10: REMI PI+ Model Regions

As a simulation model, PI+ allows the model user to input variable changes, to simulate the economic impact of single or multiple direct shocks across all sectors of the economy. More information on the REMI PI+ model can be found in the report appendix.
Cut or Pass
The economic simulations consider two alternative outcomes of the direct revenue reductions to hospitals due to the introduction of the Colorado option plan.
The loss in revenue may cause hospitals to reduce expenses and cut spending or services in a way that may impact quality or access for certain populations across Colorado. A potential reduction in hospital revenue is modeled in PI+ as a reduction in the model’s output variable across each REMI region. This captures an across the board reduction in hospital economic activity including reductions in jobs, equipment, intermediate supply demand, capital construction and maintenance.
Instead of reducing services or employment, hospitals may be forced to pass costs on the remaining commercial insurance market through cost shifting.
The increase in the cost shift is modeled as an across the board increase in the PI+ production cost variable, reflecting an increase in the cost of doing business for Colorado employers.
HB20-1349 includes the following language aimed at preventing further cost shifting from occurring.
“THE COMMISSIONER SHALL DENY ANY RATE IN THE INDIVIDUAL, 2 SMALL GROUP, OR LARGE GROUP MARKET THAT REFLECTS A COST SHIFT 3 BETWEEN THE COLORADO OPTION PLAN DESCRIBED IN SECTION 4 10-16-1205 AND THE PLAN FOR WHICH THE RATES ARE SUBMITTED…”xxiv
It is unclear how effective this measure could be given two important aspects of the market. First, the Division of Insurance only regulates the fully-insured marketplace, meaning that commercially self-insured plans, or over 50% of all payers, would still be subject to cost shifting. Second, cost shifting, occurs at the provider level. Insurance companies already face laws which prevent using one insurance product to subsidize another. This would mean that the DOI would be authorizing and potentially denying health insurance premiums, based upon the prices that plans were paying hospitals and the suspicion that hospitals had increased prices to compensate for Colorado option plan losses.
Consumer Savings
While the premium reductions offered by the Colorado option plan are driven by reduced revenue for hospitals, they also amount to savings for Colorado option plan consumers.
From a modeling perspective, these savings amount to additional money available for Colorado option plan consumers to spend on other items, or to save. Within the PI+ model, the increase in consumer savings is modeled as an increase in consumer spending. This alone has a positive impact on the Colorado economy has there is an increase in consumer demand which many consumer facing sectors such as retail, accommodations, restaurants, and other personal services benefit from.
Impact on Insurance Carriers
Health insurance carriers will also be directly impacted by the Colorado option plan. While the scope of the Guidehouse modeling does not directly cover the likely impacts to carriers, significant questions remain regarding the financial ability of carriers to offer the plan.
State officials often state that a primary benefit of the Colorado option plan is that the state does not then have to directly assume the risk associated with acting as insurer. This only means that the risk of insolvency is shifted onto the private carriers.
Health insurance carriers operate under state and federal guidelines for how much revenue they can retain for overhead and profits, termed the medical loss ratio, or MLR. For individual and small group this medical loss ratio is 80%. This means that health insurance companies can only retain 20% or less of all the money they collect and 80% must be paid out in benefit claims.
Under the Colorado option plan, the MLR is increased to 85%. This would mean that insurance carriers could retain 15% of all the money they collect in premiums compared to 20% now. That would be a 25% reduction in the revenue they could retain for administration of the plan.
As has been brought up in our previous work on the topic, important questions remain with how insurance companies will react to these financial constraints.
The reduction in revenue going to carriers is assumed to be 17% of the total reductions in hospital revenue to account for the 85% MLR. In the REMI model it is input as a change in exogenous final demand for the insurance sector.
Figure 11: Cut – Economic Impact if 100% of Revenue Losses Lead to Reduction in Hospital Output
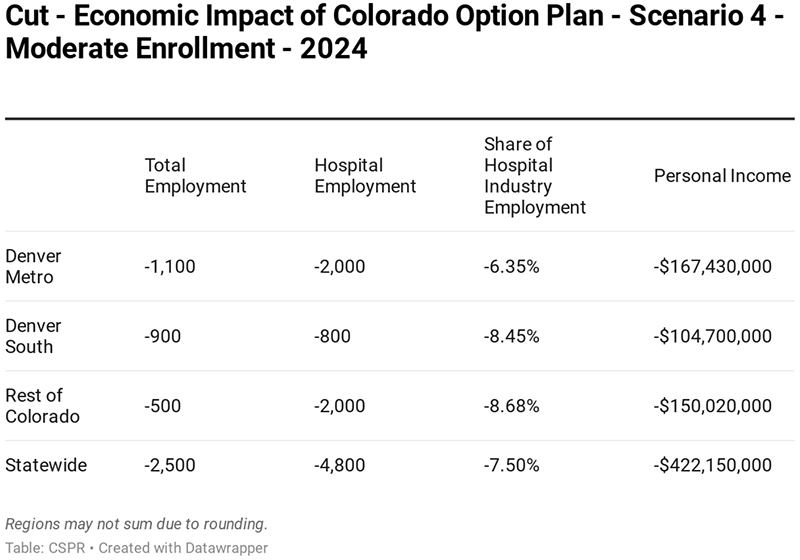
Figure 12: Cost Shift if 100% of Revenue Losses are Passed onto Remaining Commercial Insurance Market
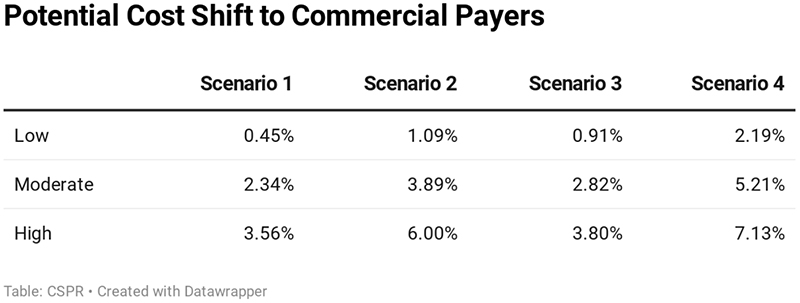
Figure 13: Pass- Economic Impact if 100% of Revenue Losses are Passed onto the Remaining Commercial Health Insurance Market
Appendix
Guidehouse Letter

REMI PI+ Overviewxxv
Model Framework
PI+, Tax-PI and TranSight are structural economic forecasting and policy analysis model. The following core framework applies to all REMI model builds. The model integrates input-output, computable general equilibrium, econometric and economic geography methodologies. The model is dynamic, with forecasts and simulations generated on an annual basis and behavioral responses to compensation, price, and other economic factors.
The model consists of thousands of simultaneous equations with a structure that is relatively straightforward. The exact number of equations used varies depending on the extent of industry, demographic, demand, and other detail in the specific model being used. The overall structure of the model can be summarized in five major blocks: (1) Output and Demand, (2) Labor and Capital Demand, (3) Population and Labor Supply, (4) Compensation, Prices, and Costs, and (5) Market Shares. The blocks and their key interactions are shown in Figures 1 and 2.
Figure 1: REMI Model Linkages
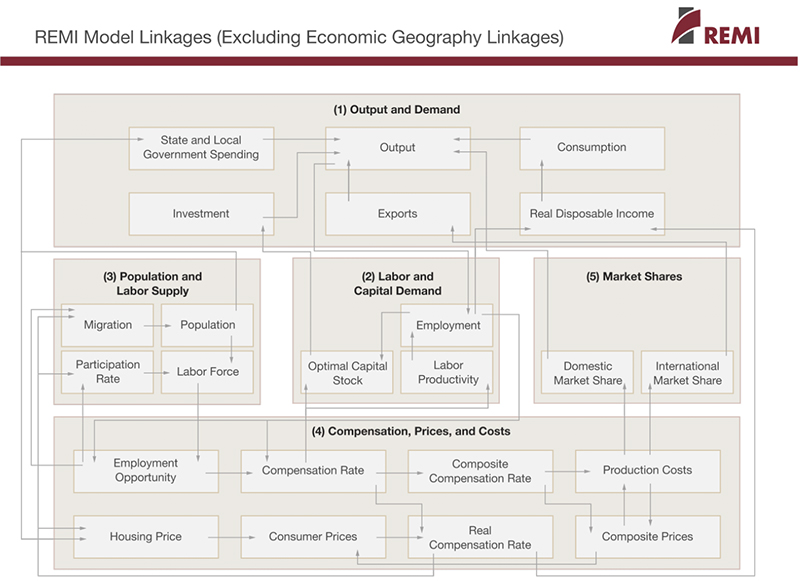
Figure 2: Economic Geography Linkages
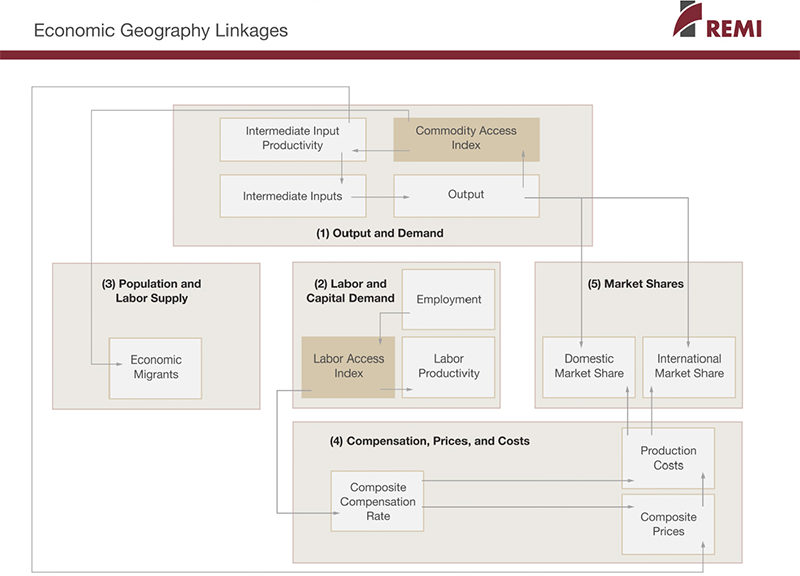
The Output and Demand block consists of output, demand, consumption, investment, government spending, exports, and imports, as well as feedback from output change due to the change in the productivity of intermediate inputs. The Labor and Capital Demand block includes labor intensity and productivity as well as demand for labor and capital. Labor force participation rate and migration equations are in the Population and Labor Supply block. The Compensation, Prices, and Costs block includes composite prices, determinants of production costs, the consumption price deflator, housing prices, and the compensation equations. The proportion of local, inter-regional, and export markets captured by each region is included in the Market Shares block.
Models can be built as single region, multi-region, or multi-region national models. A region is defined broadly as a sub-national area, and could consist of a state, province, county, or city, or any combination of sub-national areas.
Single-region models consist of an individual region, called the home region. The rest of the nation is also represented in the model. However, since the home region is only a small part of the total nation, the changes in the region do not have an endogenous effect on the variables in the rest of the nation.
Multi-regional models have interactions among regions, such as trade and commuting flows. These interactions include trade flows from each region to each of the other regions. These flows are illustrated for a three-region model in Figure 3.
Figure 3: Trade and Commuter Flow Linkages
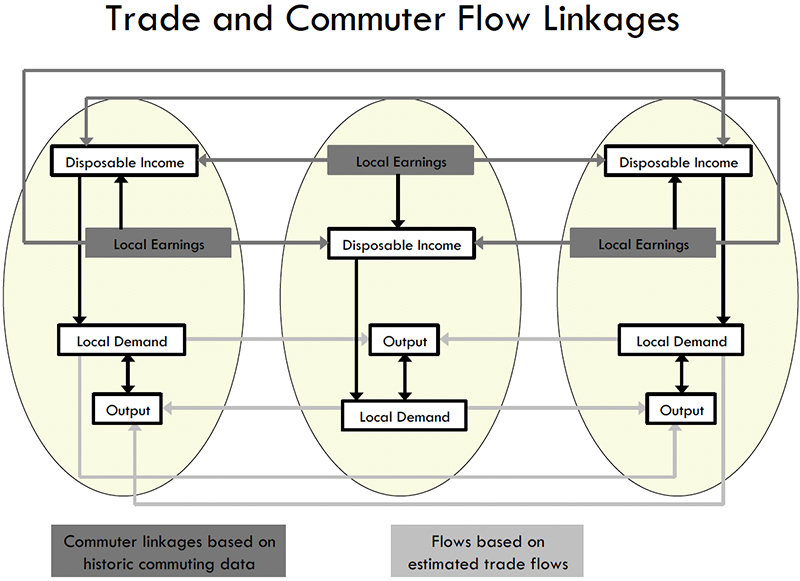
Multiregional national models also include a central bank monetary response that constrains labor markets. Models that only encompass a relatively small portion of a nation are not endogenously constrained by changes in exchange rates or monetary responses.
Block 1. Output and Demand
This block includes output, demand, consumption, investment, government spending, import, commodity access, and export concepts. Output for each industry in the home region is determined by industry demand in all regions in the nation, the home region’s share of each market, and international exports from the region.
For each industry, demand is determined by the amount of output, consumption, investment, and capital demand on that industry. Consumption depends on real disposable income per capita, relative prices, differential income elasticities, and population. Input productivity depends on access to inputs because a larger choice set of inputs means it is more likely that the input with the specific characteristics required for the job will be found. In the capital stock adjustment process, investment occurs to fill the difference between optimal and actual capital stock for residential, non-residential, and equipment investment. Government spending changes are determined by changes in the population.
Block 2. Labor and Capital Demand
The Labor and Capital Demand block includes the determination of labor productivity, labor intensity, and the optimal capital stocks. Industry-specific labor productivity depends on the availability of workers with differentiated skills for the occupations used in each industry. The occupational labor supply and commuting costs determine firms’ access to a specialized labor force.
Labor intensity is determined by the cost of labor relative to the other factor inputs, capital and fuel. Demand for capital is driven by the optimal capital stock equation for both non-residential capital and equipment. Optimal capital stock for each industry depends on the relative cost of labor and capital, and the employment weighted by capital use for each industry. Employment in private industries is determined by the value added and employment per unit of value added in each industry.
Block 3. Population and Labor Supply
The Population and Labor Supply block includes detailed demographic information about the region. Population data is given for age, gender, and race, with birth and survival rates for each group. The size and labor force participation rate of each group determines the labor supply. These participation rates respond to changes in employment relative to the potential labor force and to changes in the real after-tax compensation rate. Migration includes retirement, military, international, and economic migration. Economic migration is determined by the relative real after-tax compensation rate, relative employment opportunity, and consumer access to variety.
Block 4. Compensation, Prices and Costs
This block includes delivered prices, production costs, equipment cost, the consumption deflator, consumer prices, the price of housing, and the compensation equation. Economic geography concepts account for the productivity and price effects of access to specialized labor, goods, and services.
These prices measure the price of the industry output, taking into account the access to production locations. This access is important due to the specialization of production that takes place within each industry, and because transportation and transaction costs of distance are significant. Composite prices for each industry are then calculated based on the production costs of supplying regions, the effective distance to these regions, and the index of access to the variety of outputs in the industry relative to the access by other uses of the product.
The cost of production for each industry is determined by the cost of labor, capital, fuel, and intermediate inputs. Labor costs reflect a productivity adjustment to account for access to specialized labor, as well as underlying compensation rates. Capital costs include costs of non-residential structures and equipment, while fuel costs incorporate electricity, natural gas, and residual fuels.
The consumption deflator converts industry prices to prices for consumption commodities. For potential migrants, the consumer price is additionally calculated to include housing prices. Housing prices change from their initial level depending on changes in income and population density.
Compensation changes are due to changes in labor demand and supply conditions and changes in the national compensation rate. Changes in employment opportunities relative to the labor force and occupational demand change determine compensation rates by industry.
Block 5. Market Shares
The market shares equations measure the proportion of local and export markets that are captured by each industry. These depend on relative production costs, the estimated price elasticity of demand, and the effective distance between the home region and each of the other regions. The change in share of a specific area in any region depends on changes in its delivered price and the quantity it produces compared with the same factors for competitors in that market. The share of local and external markets then drives the exports from and imports to the home economy.
1 https://www.ers.usda.gov/data-products/rural-urban-continuum-codes.aspx
ii Wakely Consulting Group, LLC: State of Colorado Actuarial Analysis of a Colorado Health Insurance Option in 2022, Feb. 21, 2020. https://www.colorado.gov/pacific/sites/default/files/Wakely%20Colorado%20Public%20Option%20Report.pdf
iii Wakely Consulting Group, LLC: State of Colorado 2022 Public Option, November 14, 2019: https://www.colorado.gov/pacific/sites/default/files/Final%20Report%20for%20Colorados%20Public%20Option_Includes%20Appendix.pdf
iv Common Sense Policy Roundtable, September 10, 2019: Anticipating a State Option For Health Care: Will Businesses Face Higher Costs Or Will Quality and Access be Cut? https://commonsenseinstituteco.org/state-health-care/
vi Denver Business Journal: Colorado hospitals face a $1.2B loss due to coronavirus — and that’s just the beginning, April 15, 2020: https://www.bizjournals.com/denver/news/2020/04/15/colorado-hospitals-losses-coronavirus.html
vii https://www.healthgrades.com/quality/americas-best-hospitals-for-2020
viii Executive Order D 2020 050, April 30, 2020: https://drive.google.com/file/d/1Aelk2C0MJnNDdNgClukjWtmeuNECGcJC/view
ix https://commonsenseinstituteco.org/state-health-care/
x https://www.colorado.gov/pacific/sites/default/files/Colorados%20Public%20Option%20-%20Appendix%20V.pdf, page 614
xi https://commonsenseinstituteco.org/copublicoptionkeyquestions/
xiv https://www.aha.org/system/files/2019-01/underpayment-by-medicare-medicaid-fact-sheet-jan-2019.pdf
xv https://www.denverpost.com/2019/01/04/colorado-democrats-public-option-health-care/
xvi https://www.colorado.gov/pacific/sites/default/files/HB19-1004%20Draft%20Report%20Colorado%20State%20Coverage%20Option%20and%20Appendix.pdf
xvii Wakely Consulting Group reports, performed for the State of Colorado, can be accessed here:
October 2019: https://www.colorado.gov/pacific/sites/default/files/HB19-1004%20Draft%20Report%20Colorado%20State%20Coverage%20Option%20and%20Appendix.pdf
November 2019: https://www.colorado.gov/pacific/sites/default/files/Final%20Report%20for%20Colorados%20Public%20Option_Includes%20Appendix.pdf
February 2020: https://www.colorado.gov/pacific/sites/default/files/Wakely%20Colorado%20Public%20Option%20Report.pdf
xvii https://www.coloradoindependent.com/2020/03/12/colorado-public-option-healthcare/
xix https://leg.colorado.gov/bills/hb20-1349
xx https://leg.colorado.gov/sites/default/files/documents/2020A/bills/fn/2020a_hb1349_00.pdf
xxi https://drive.google.com/file/d/1reV18qe6KQo0WrJ–nZ2cgaqqIVE2JDP/view
xxii https://www.colorado.gov/pacific/sites/default/files/Final%20Report%20for%20Colorados%20Public%20Option_Includes%20Appendix.pdf
xxiii https://www.colorado.gov/pacific/sites/default/files/Wakely%20Colorado%20Public%20Option%20Report.pdf
xxivhttps://leg.colorado.gov/sites/default/files/documents/2020A/bills/2020a_1349_01.pdf
xxv Content provided by REMI. www.remi.com