

Understanding the Impacts of 1% Growth in Lakewood
On July 2nd 2019, voters in Lakewood, Colorado will decide on whether or not to impose a 1% cap on the growth of the city’s housing. “The Strategic Growth Initiative” was introduced in 2017 and tied up in court for the past two-and-a-half years. In 2017, the REMI Partnership released a study, “Building Gated Cities”, describing the potential economic impacts this initiative would have on the city. 1
The City of Lakewood’s housing is projected to grow at an annual average rate of 1.3% to 1.5% over the next decade. If the 1% growth cap passes, it would mean up to approximately 4,100 fewer housing units will be built, equal to a reduction of 37% of new units over a decade. Given the already low vacancy rate and rapid increase in housing prices and rents, this restriction in supply will have impacts across housing affordability, transportation infrastructure, and city finances.
Growth Caps and the City of Boulder Experience:
Historical data from Colorado shows growth caps have real and lasting impacts on housing markets. Reducing the supply of housing, especially affordable housing, puts upward pressure on the cost of housing, including rents and property taxes.
In the late 1970s, Boulder imposed a 2% annual limit on residential growth. Within a few years, housing costs in Boulder started to accelerate significantly faster compared to other nearby cities.
Then, in the early 1990’s, Boulder’s growth limit was lowered again to 1% per year. This policy, along with others, took Boulder’s already tight housing market to a new level. Due to costs rising much higher and faster than neighboring cities in the Denver Metropolitan Area.
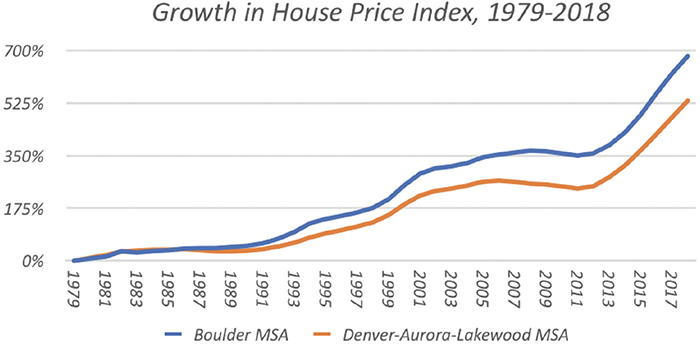
Source: U.S. Federal House Financing Agency, House Price Index2
Today, an almost identical 1% growth limit is under consideration by voters in Lakewood. The following updated key findings of our previous work released October 2017, analyze the impacts of a 1% growth cap to restrict housing supply in Lakewood: 3
Housing Affordability:
- From 2009 to 2016 the median homes sales price rose 75% while the median household income only grew 11%. With housing costs dramatically outpacing income growth, a measure like the 1% growth initiative could force 4,100 potential households away from Lakewood and put even greater pressure on affordability.
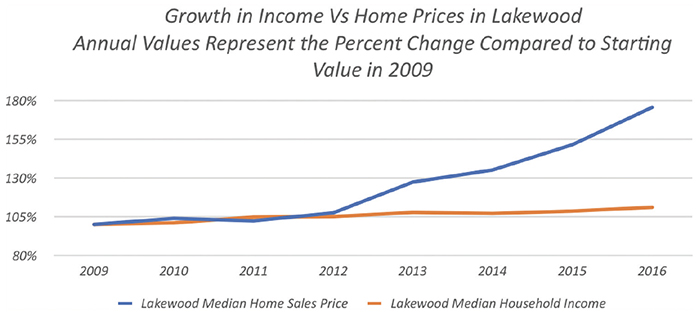
Source: RE Colorado4 and US Census Bureau5
- Median home prices are already beyond what a growing share of local workers can afford, including police, teachers, and firemen on a single salary.6
- In 2015 the median home price in Lakewood was an estimated $66,000 and $98,000 more than a starting police officer or West Metro firefighter could afford on a single salary. By 2016, the gap between what a police officer and firefighter could afford grew to $107,000 and $139,000, respectively.7
- While homeowners may benefit when they sell their homes, the increase in property taxes can be a significant burden.
- As shown below, if the median home price were to increase by 20% as a result of a 1% growth cap, that would amount up to a $527 to $761 increase in property taxes, per year, based upon the mill levy for the property.
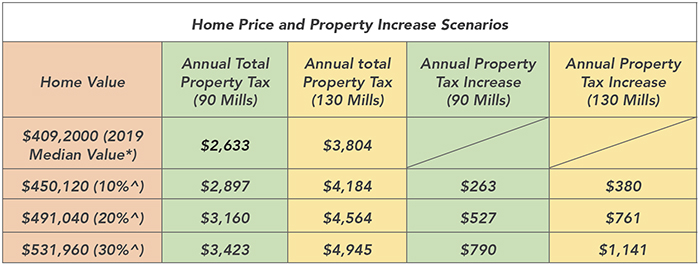
Property Tax Calculation: Property Tax (home value * 7.15% * 90 or 130 mills)8 *Source: Zillow9
- Making fewer permits available on an annual basis, makes it more challenging to obtain multiple permits. This reduces the incentive to build smaller, more affordable units.
- Similar growth restrictions already exist in the nearby cities of Golden and Boulder, where the median home sales price as of May 2019 were 64% and 97% higher, respectively, than the median sales price in Lakewood.
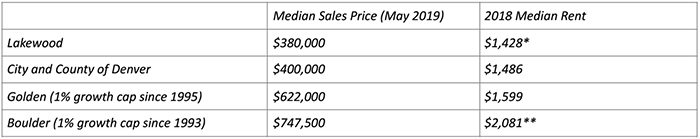
*Average of Lakewood North and South market areas
**Average of City of Boulder University and Non-university market area.
Source: Apartment Association Metro Denver10 and Trulia11
Transportation and Infrastructure:
- The share of in-commuters to Lakewood grew from 9% to 17% from 2002 to 2014 as housing and population growth has not kept pace with employment. This puts additional demand on the city’s transportation network.12
- Reducing the number of housing permits available each year, will make it more challenging to build larger multi-unit develops such as condominiums, as there will be less incentive to use available space to create smaller, more affordable homes. These challenges will decrease the ability to see the impact of more dense and walkable housing growth intended to increase ridership on the West Rail Line.
- The City of Lakewood’s comprehensive plan expects much of the area’s growth to center around areas in walking distance to the West Rail Line.13 In 2011 the Mayor and City Manager stressed how Lakewood was one of the cities in Metro Denver most prepared to accommodate transit-oriented development. A large amount of growth along the rail line would need to be larger multi-family units. Any effort to cut the size and number of residential units would undermine established goals of the city plan.
- Forcing growth in less-dense housing generally results in higher per-unit costs and tends to place added stress on local roadways, utilities, and water services. Thus, the 1% growth initiative may end up doing the opposite of what it intended by putting more strain on local infrastructure. According to EPA guidance, promoting responsible housing density in city centers has a variety of benefits, including protecting outlying open spaces and sensitive habitats, increasing energy efficiency, and protecting water quality.14
Fiscal Impact:
- With less residential investment and lower consumer spending, the city will collect less revenue related to permitting and developing new homes.
- Currently, construction and motor vehicle-related use taxes have become an important source for the City’s General Fund. Given the projections on the reduced number of homes that would be built under a 1% permitting cap, the city could lose an estimated $4,100,000 to $15,700,000 in construction use taxes alone over the next ten years.
- Lakewood would also forgo revenue growth from the cumulative loss in new households, due to lower revenue from general use and sales taxes. The city’s financial report estimates that it had $2,600,000,000 in taxable sales in 2016. At an assumed average use tax rate of 3%, the city would have collected roughly $78,000,000 from taxable consumption, or about two-thirds of all Lakewood taxes collected. By crowding out households and businesses, Lakewood would be limiting a key source of its revenue.
1 Building Gated Cities. https://remipartnership.org/building-gated-cities/
2 U.S. Federal Housing Finance Agency, All-Transactions House Price Index for the Boulder MSA and Denver-Aurora-Lakewood MSA, retrieved from FRED, Federal Reserve Bank of St. Louis; https://fred.stlouisfed.org/
3 https://remipartnership.org/building-gated-cities/; https://remipartnership.org/economic-impact-report/
4 Data provided from REcolorado, November 2017.
5 U.S. Census Bureau, American Community Survey 5-year Estimates, Income In The Past 12 Months. (2013-2017)
6 RRC Associates, City of Lakewood Housing Study. (City of Lakewood, 2017). http://www.lakewood.org/housingstudy/
7 RRC Associates, 6
8 Range of mill levy rates developed from analysis of multiple Lakewood property tax history.
9 Zillow, Lakewood Home Prices and Values. (Zillow, 2019). https://www.zillow.com/lakewood-co/home-values/.
10 Ron Thorpe, Jennifer L. Von Stroh. Denver Metro Area Apartment Vacancy and Rent Survey (Denver Housing Authority, 2019), I-4. https://bit.ly/2IpxVP0.
11 Trulia, Real Estate Market Trends. (Trulia, 2019). www.trulia.com/
12 RRC Associates, 24.
13 RRC Associates, 48
14 Kevin Nelson, et al., Essential Smart Growth Fixes for Urban and Suburban Zoning Codes. (EPA, November 2009) 19. https://bit.ly/2hQlVIw.