

A Look at the Rising Crime in Denver Council Districts & Neighborhoods
ABOUT THE AUTHORS
Steven Byers, Ph.D. is the Senior Economist with Common Sense Institute. Steven’s experience as an economist spans twenty-three years, including work at federal regulatory agencies (SEC, CFTC, PCAOB) and quantitative economic analysis supporting international trade litigation cases brought before the U.S. International Trade Commission.
Cole Anderson is a Research Analyst for Common Sense Institute. Cole graduated from the University of Denver with a degree in public policy and economics before he joined CSI in 2022. His range of experience includes analyzing crime, housing, and workforce issues within Colorado.
2023 Local Elections
In 2023, Coloradans will have municipal elections in our most populated cities. To inform these debates CSI will produce reports on the most pressing issues facing Colorado cities: crime, housing, and homelessness for Fort Collins, Denver, Grand Junction, Pueblo, Colorado Springs, and Aurora.
About Common Sense Institute
Common Sense Institute is a non-partisan research organization dedicated to the protection and promotion of Colorado’s and Arizona’s economy. CSI is at the forefront of important discussions concerning the future of free enterprise in Colorado and aims to have an impact on the issues that matter most to Coloradans and Arizonans. CSI’s mission is to examine the fiscal impacts of policies, initiatives, and proposed laws so that Coloradans and Arizonans are educated and informed on issues impacting their lives. CSI employs rigorous research techniques and dynamic modeling to evaluate the potential impact of these measures on the Colorado and Arizona economy and individual opportunity.
Teams & Fellows Statement
CSI is committed to independent, in-depth research that examines the impacts of policies, initiatives, and proposed laws so that Coloradans and Arizonans are educated and informed on issues impacting their lives. CSI’s commitment to institutional independence is rooted in the individual independence of our researchers, economists, and fellows. At the core of CSI’s mission is a belief in the power of the free enterprise system. Our work explores ideas that protect and promote jobs and the economy, and the CSI team and fellows take part in this pursuit with academic freedom. Our team’s work is driven by data-driven research and evidence. The views and opinions of fellows do not reflect institutional views of CSI. CSI operates independently of any political party and does not take positions.
Introduction and Key Findings
This report looks at the current state of crime in Denver through the lens of publicly available data on the level of crime and crime rates. We used data on neighborhoods made available by the Denver Police Department to study crime at the individual neighborhood level and at the City Council District level.
Crime rates in Denver continue to top pre-pandemic levels. In 2022, Denver’s average monthly crime rate was 43% higher than in 2019, and 75% higher than in 2008. The average monthly crime rate for motor vehicle theft is 172 incidents per 100,000 residents, an increase of 293% compared to 2014, the year that the state passed statutory reductions to motor vehicle penalties.
Compared to other cities in the U.S. with populations over 100,000, Denver ranks third in motor vehicle theft crime rate and sixth in property crime rates, and 10th in rape crime rates.
Relative to other major Colorado cities, Denver is ranked first in motor vehicle thefts and first in property crime.
Concurrent with Denver’s rising crime rates, one would expect a corresponding rise in arrests, convictions, and incarceration for the sake of public safety and justice for victims. Further analysis is warranted to determine how the criminal justice system is responding. The findings in this report show that Denver faces a growing crime problem and addressing it should be a top priority.
Report Key Findings
Denver ranks in the top 10 U.S. cities for crime
- Denver ranks in the top 10 U.S. cities for crime, including: 3rd motor vehicle theft; 6th property crime rate; 10th rape crime rate.
- Approximately 14,980 vehicles were stolen in Denver in 2022. That is equal to nearly every car being stolen from all parking lots surrounding Empower Field during 3 Broncos home games.
While all districts in Denver face challenges, crime is overwhelming in District 9
-
- The number of crime incidences in District 9 (15,987) is 91% higher than the second worst district and more than double the level in the 8 other districts.
- District 9 has a crime rate twice the average for all districts.
- District 9 has 9.09% of the population in Denver yet has 20.4% of all incidents in 2022. This equates to roughly 44 incidents (nearly 50) per day in District 9.
Neighborhoods to Watch
- In 2022, District 9 neighborhoods, including CBD, Five Points, and Union Station, occupied 3 of the top 5 worst neighborhoods by number of crimes.
- The worst neighborhood by the number of crimes, was 4,549 in Five Points.
- In District 9, incidents of crime have increased nearly 40% from 11,468 in 2018 to 15,987 in 2022.
- The neighborhood with the least number of crimes and ranked best in Denver is Wellshire.
- District 2 had the lowest number of incidents, including Harvey Park, Bear Valley, and Marston.
Average Monthly Crimes Rates in Denver
The data in this section comes from Colorado Crime Statistics. Figure 1 shows the evolution of the average monthly crime rate in Denver and Colorado since 2008. The average monthly crime rate in Denver has risen by 75% from 5.14 per 1,000 residents in 2018 to 9.01 in 2022. As of 2022, Denver’s crime rate is 58% higher than the Colorado average. Historically, Denver’s crime rate has been only about 28% higher than the state average.
Figure 1 – Average Monthly Crime Rate per 1,000 Residents in Denver and Colorado
Table 1 shows the average monthly crime rate in 2014, 2018, and 2022, as well as change from 2014 to 2018 and 2014 to 2018 by major crime categories. Crimes against persons rose 22.3% from 2018 to 2022, a seven-fold increase over the period 2014 to 2018. Crimes against property rose 59.5% from 2018 to 2022, a nine-fold increase over the period 2014 to 2018. Crimes against society decreased 10% from 2018 to 2022, after increasing 34% from 2014 to 2018.
Some of the larger increases occurred in aggravated assault, increasing 60.2% from 2018 to 2022, motor vehicle theft rose 176% from 2018 to 2022, more than four times the change from 2014 to 2018.
| Table 1 – Denver Average Monthly Crime Rate per 1,000 residents | |||||
| Crime Rate | Percent Change | ||||
| Average Monthly Crime Rate | 2014 | 2018 | 2022 | 2014-2018 | 2018-2022 |
| Crimes against Person | 1.26 | 1.30 | 1.59 | 3.2% | 22.3% |
| Crimes against Property | 3.97 | 4.23 | 6.75 | 6.6% | 59.5% |
| Crimes against Society | 0.57 | 0.76 | 0.68 | 34.0% | -10.0% |
| Sexual Assault | 0.11 | 0.14 | 0.14 | 26.3% | -5.2% |
| Murder | 0.00 | 0.01 | 0.01 | 266.7% | 0.0% |
| Robbery | 0.14 | 0.14 | 0.15 | 3.0% | 4.1% |
| Aggravated Assault | 0.31 | 0.39 | 0.62 | 25.5% | 60.2% |
| Arson | 0.02 | 0.01 | 0.02 | -23.8% | 62.5% |
| Burglary | 0.57 | 0.47 | 0.58 | -19.0% | 24.0% |
| Larceny | 2.45 | 2.51 | 3.46 | 2.3% | 38.1% |
| Theft from Motor Vehicles | 0.49 | 0.61 | 0.96 | 26.2% | 57.2% |
| Auto Theft | 0.44 | 0.62 | 1.72 | 42.1% | 176.0% |
| Total | 5.79 | 6.29 | 9.02 | 8.5% | 43.5% |
| Source: Colorado Crime Statistics | |||||
Figure 2 shows the evolution of average monthly crimes against a person for Denver relative to Colorado. Denver’s average monthly crime for crimes against a person has consistently been higher than Colorado and is continuing to diverge away from Colorado at a higher rate in each year since 2012.
Figure 2 – Crimes Against Persons: Average Monthly Crime Rates
Figure 3 shows the evolution of average monthly crimes against property relative to Colorado. Denver’s average monthly crime rate against property has been consistently higher than Colorado’s average and tracks fairly close.
Figure 3 – Crimes Against Property: Average Monthly Crime Rate per 1,000 in Denver and Colorado
Figure 4 shows the average monthly crime rate against society relative to Colorado. Denver’s average monthly crime rate against society does not appear to be positively correlated with Colorado’s.
Figure 4 – Crimes Against Society: Average Monthly Crime Rate per 1,000 in Denver and Colorado
Figure 5 shows Denver’s average monthly crime rate for crimes against persons, property, society, and total from 2008 to 2022. Clearly, the large increase in crimes against property account for the majority of the change in the total average monthly crime rate.
Figure 5 – Average Monthly Crime Rate per 1,000 in Denver
Using the latest report from the FBI’s Uniform Crime Reporting Program (UCR) for the third quarter of 2022, CSI converted the number of crimes to crime rates based on population for each reporting city. 168 cities reported to the UCR in Q3 2021 and 188 reported in Q3 2022. Highlighted in Table 2 is Denver’s rankings across several major crime categories. Denver ranks 3rd in motor vehicle thefts in the nation and ranks 6th for property crime in 2021 and 2022 out of nationwide surveyed cities.
| Table 2 – 2021 and 2022 FBI 3rd Quarter Denver Crime Rates Ranked among Reporting Cities[i] | ||||||||||||
| Year | Violent Crime | Murder | Rape | Robbery | Aggravated Assault | Property Crime | Burglary | Larceny/Theft | Motor Vehicle Theft | Arson | ||
| Denver | 2021 | 34 | 38 | 20 | 28 | 36 | 6 | 11 | 11 | 2 | 42 | |
| 2022 | 25 | 46 | 10 | 29 | 29 | 6 | 22 | 13 | 3 | 36 | ||
| Quarterly Uniform Crime Report data for the nation are derived from National Incident-Based Reporting System (NIBRS) reports voluntarily submitted to the FBI. The FBI Quarterly Uniform Crime Report data release for Quarter 3, January – September 2022, was made available on November 28, 2022. This report is based on data received from 12,104 of 18,964 law enforcement agencies in the country. The Quarter 3 release presents the number of violent and property crime offenses known to law enforcement for agencies with resident populations of 100,000 or more that also provided data from the previous year. | ||||||||||||
Crime in Denver City Council Districts
Denver City Council Districts are defined geographically so that each of the eleven districts has approximately an equal population. As such, some neighborhoods or parts of a neighborhood can and do shift districts. In this study, the neighborhood designations are kept constant for all years so that the number of incidents and crime rates are comparable. Table 3 shows the annual crime rate for all districts in Denver based on data from Colorado Crime Statistics. Total crime rates increased 8.6% from 2014 to 2018, and increased 43.5% from 2018 to 2022, more than a five-fold increase.
| Table 3 – Change in Annual Crime Rates, Denver – Districts 1-11 | |||||
| Crime Rate | Percent Change | ||||
| Offense Category | 2014 | 2018 | 2022 | 2014-2018 | 2018-2022 |
| Crimes against Person | 15.1 | 15.6 | 19.08 | 3.2% | 22.5% |
| Crimes against Property | 47.6 | 50.8 | 80.95 | 6.6% | 59.5% |
| Crimes against Society | 6.77 | 9.1 | 8.18 | 34.4% | -10.1% |
| Drug/Narcotics Violations | 4.08 | 5.26 | 2.93 | 28.9% | -44.3% |
| Non-consensual Sex Offenses | 1.38 | 1.72 | 1.65 | 24.6% | -4.1% |
| Murder | 0.05 | 0.09 | 0.12 | 80.0% | 33.3% |
| Aggravated Assault | 3.68 | 4.6 | 7.38 | 25.0% | 60.4% |
| Non-consensual Sex Offenses | 1.38 | 1.72 | 1.65 | 24.6% | -4.1% |
| Robbery | 1.65 | 1.69 | 1.76 | 2.4% | 4.1% |
| Burglary/Breaking & Entering | 6.9 | 5.59 | 6.92 | -19.0% | 23.8% |
| Arson | 0.21 | 0.16 | 0.26 | -23.8% | 62.5% |
| Theft from Motor Vehicles | 5.84 | 7.36 | 11.58 | 26.0% | 57.3% |
| Motor Vehicle Theft | 5.24 | 7.47 | 20.58 | 42.6% | 175.5% |
| Total | 69.5 | 75.4 | 108.2 | 8.6% | 43.5% |
| Source: Colorado Crime Statistics | |||||
In Table 4, crime rates for categories of crime collected by the Denver Police Department are shown. These are the categories of crime that are used to evaluate trends in crime in each district and to compare Denver’s eleven City Council Districts to one another. Based on this data, total crime rate decreased by 7.4% from 2014 – 2018, but then reversed course by rising 31.5% from 2018 to 2022.
| Table 4 – Change in Annual Crime Rates, Denver – Districts 1 -11 | |||||
| Crime Rate | Percent Change | ||||
| Offense Category | 2014 | 2018 | 2022 | 2014 -2018 | 2018 -2022 |
| Public Disorder | 15.43 | 10.82 | 16.65 | -29.9% | 53.9% |
| Drug/Alcohol | 9.29 | 8.20 | 4.39 | -11.7% | -46.5% |
| Sexual Assault | 0.97 | 1.13 | 0.97 | 16.2% | -14.1% |
| Other Crimes against Persons | 6.73 | 4.49 | 5.54 | -33.4% | 23.5% |
| All Other Crimes | 14.23 | 12.45 | 10.48 | -12.5% | -15.8% |
| White-collar Crime | 1.63 | 1.76 | 1.47 | 7.9% | -16.5% |
| Murder | 0.04 | 0.07 | 0.10 | 71.4% | 42.1% |
| Robbery | 1.63 | 1.65 | 1.71 | 0.9% | 4.1% |
| Aggravated Assault | 2.80 | 3.17 | 4.98 | 13.1% | 57.4% |
| Arson | 0.20 | 0.16 | 0.24 | -20.4% | 53.2% |
| Burglary | 6.89 | 5.61 | 6.80 | -18.5% | 21.2% |
| Larceny | 14.13 | 12.43 | 13.58 | -12.0% | 9.2% |
| Theft from Motor Vehicle | 7.69 | 11.20 | 18.86 | 45.6% | 68.4% |
| Auto Theft | 5.30 | 7.38 | 20.09 | 39.3% | 172.3% |
| Total | 88.21 | 82.23 | 107.05 | -7.4% | 31.5% |
| Source: Denver Police Department Open Data Catalog | |||||
District Comparison of Number of Incidents
Total crime incidents have continued to increase dramatically in all districts apart from District 2. Figure 6 shows the situation is most dire in District 9, where the number of incidents has risen from 11,468 in 2018 to 15,987 in 2022, a 38.4% increase.
Figure 6 – Incidents of Crime in Denver’s City Council Districts
Table 5 shows the number of incidents in each Denver City Council District and ranks them where 1 is the worst and 11 is the best. District 9 has the worst overall crime rate (highlighted in orange) in all three years examined, with a crime rate double or more than that of the next worse district.
| Table 5 – Comparison of Total Crime Rates by Denver Council Districts 1–11 | ||||||
| 2014 | 2018 | 2022 | ||||
| Rank | Crime Rate per 1,000 | District | Crime Rate per 1,000 | District | Crime Rate per 1,000 | District |
| 1 | 214.30 | 9 | 181.46 | 9 | 246.31 | 9 |
| 2 | 122.01 | 7 | 123.28 | 10 | 129.90 | 10 |
| 3 | 117.06 | 10 | 98.59 | 7 | 123.81 | 8 |
| 4 | 106.12 | 3 | 94.51 | 3 | 117.79 | 7 |
| 5 | 86.30 | 8 | 84.76 | 8 | 102.43 | 3 |
| 6 | 81.09 | 1 | 76.44 | 1 | 100.43 | 11 |
| 7 | 70.12 | 5 | 63.71 | 5 | 93.19 | 1 |
| 8 | 49.31 | 11 | 57.15 | 4 | 90.63 | 5 |
| 9 | 46.30 | 4 | 52.34 | 11 | 81.99 | 4 |
| 10 | 43.99 | 6 | 39.67 | 6 | 56.65 | 6 |
| 11 | 33.67 | 2 | 32.59 | 2 | 34.43 | 2 |
| Average | 88.21 | 82.23 | 107.5 | |||
| Source: Denver Police Department Open Data Catalog | ||||||
Table 6 presents the number of crime incidents in each district over the four-year periods 2014 – 2018 and 2018 – 2022. District 9 has the greatest number of incidents crime rate, and it is nearly double the next highest number of incidents in District 7. Since each district has approximately the same population (65,000), converting these number of incidents to a crime rate would show that District 9 has a crime rate twice the average for all districts. District 9 has 9.09% of the population in Denver yet has 20.4% of all incidents in 2022. This equates to 44 incidents per day in District 9.
| Table 6 – Total Incidents by Denver Council Districts 1–11 | ||||||
| Year | Percent Change | |||||
| District | 2014 | 2018 | 2022 | 2014-2018 | 2018-2022 | |
| 1 | 4,917 | 5,020 | 6,286 | 2.1% | 25.2% | |
| 2 | 2,090 | 2,192 | 2,378 | 4.8% | 8.5% | |
| 3 | 6,310 | 6,087 | 6,776 | -3.5% | 11.3% | |
| 4 | 2,950 | 3,459 | 5,812 | 17.3% | 68.0% | |
| 5 | 4,360 | 4,291 | 6,269 | -1.6% | 46.1% | |
| 6 | 2,793 | 2,728 | 4,001 | -2.3% | 46.7% | |
| 7 | 7,131 | 6,242 | 7,659 | -12.5% | 22.7% | |
| 8 | 5,041 | 5,364 | 8,047 | 6.4% | 50.0% | |
| 9 | 12,503 | 11,468 | 15,987 | -8.3% | 39.4% | |
| 10 | 6,784 | 7,739 | 8,375 | 14.1% | 8.2% | |
| 11 | 2,991 | 3,439 | 6,777 | 15.0% | 97.0% | |
| District Avg. | 5,261 | 5,275 | 7,124 | 0.3% | 35.0% | |
| Source: Denver Police Department Open Data Catalog | ||||||
Table 7 shows the rank of each City Council district relative to all 11 City Council districts in Denver for total number of incidents. A rank of 1 is the worst (most incidents) and 11 is the best (least number of incidents). District 9 is consistently and overwhelmingly the worst district for the number of incidents followed by District 10. District 2 is consistently the best in that it has the lowest number of incidents.
| Table 7 – Comparison of Total Incidents in Denver Council Districts 1–11 | ||||||
| 2014 | 2018 | 2022 | ||||
| Rank | Number of Incidents | District number | Number of Incidents | District number | Number of Incidents | District number |
| 1 | 12,503 | 9 | 11,468 | 9 | 15,987 | 9 |
| 2 | 7,131 | 7 | 7,739 | 10 | 8,375 | 10 |
| 3 | 6,784 | 10 | 6,242 | 7 | 8,047 | 8 |
| 4 | 6,310 | 3 | 6,087 | 3 | 7,659 | 7 |
| 5 | 5,041 | 8 | 5,364 | 8 | 6,777 | 11 |
| 6 | 4,917 | 1 | 5,020 | 1 | 6,776 | 3 |
| 7 | 4,360 | 5 | 4,291 | 5 | 6,286 | 1 |
| 8 | 2,991 | 11 | 3,459 | 4 | 6,269 | 5 |
| 9 | 2,950 | 4 | 3,439 | 11 | 5,812 | 4 |
| 10 | 2,793 | 6 | 2,728 | 6 | 4,001 | 6 |
| 11 | 2,090 | 2 | 2,192 | 2 | 2,378 | 2 |
| Total | 57,869 | 58,029 | 78,365 | |||
| Source: Denver Police Department Open Data Catalog | ||||||
Individual District and Neighborhood Level Data
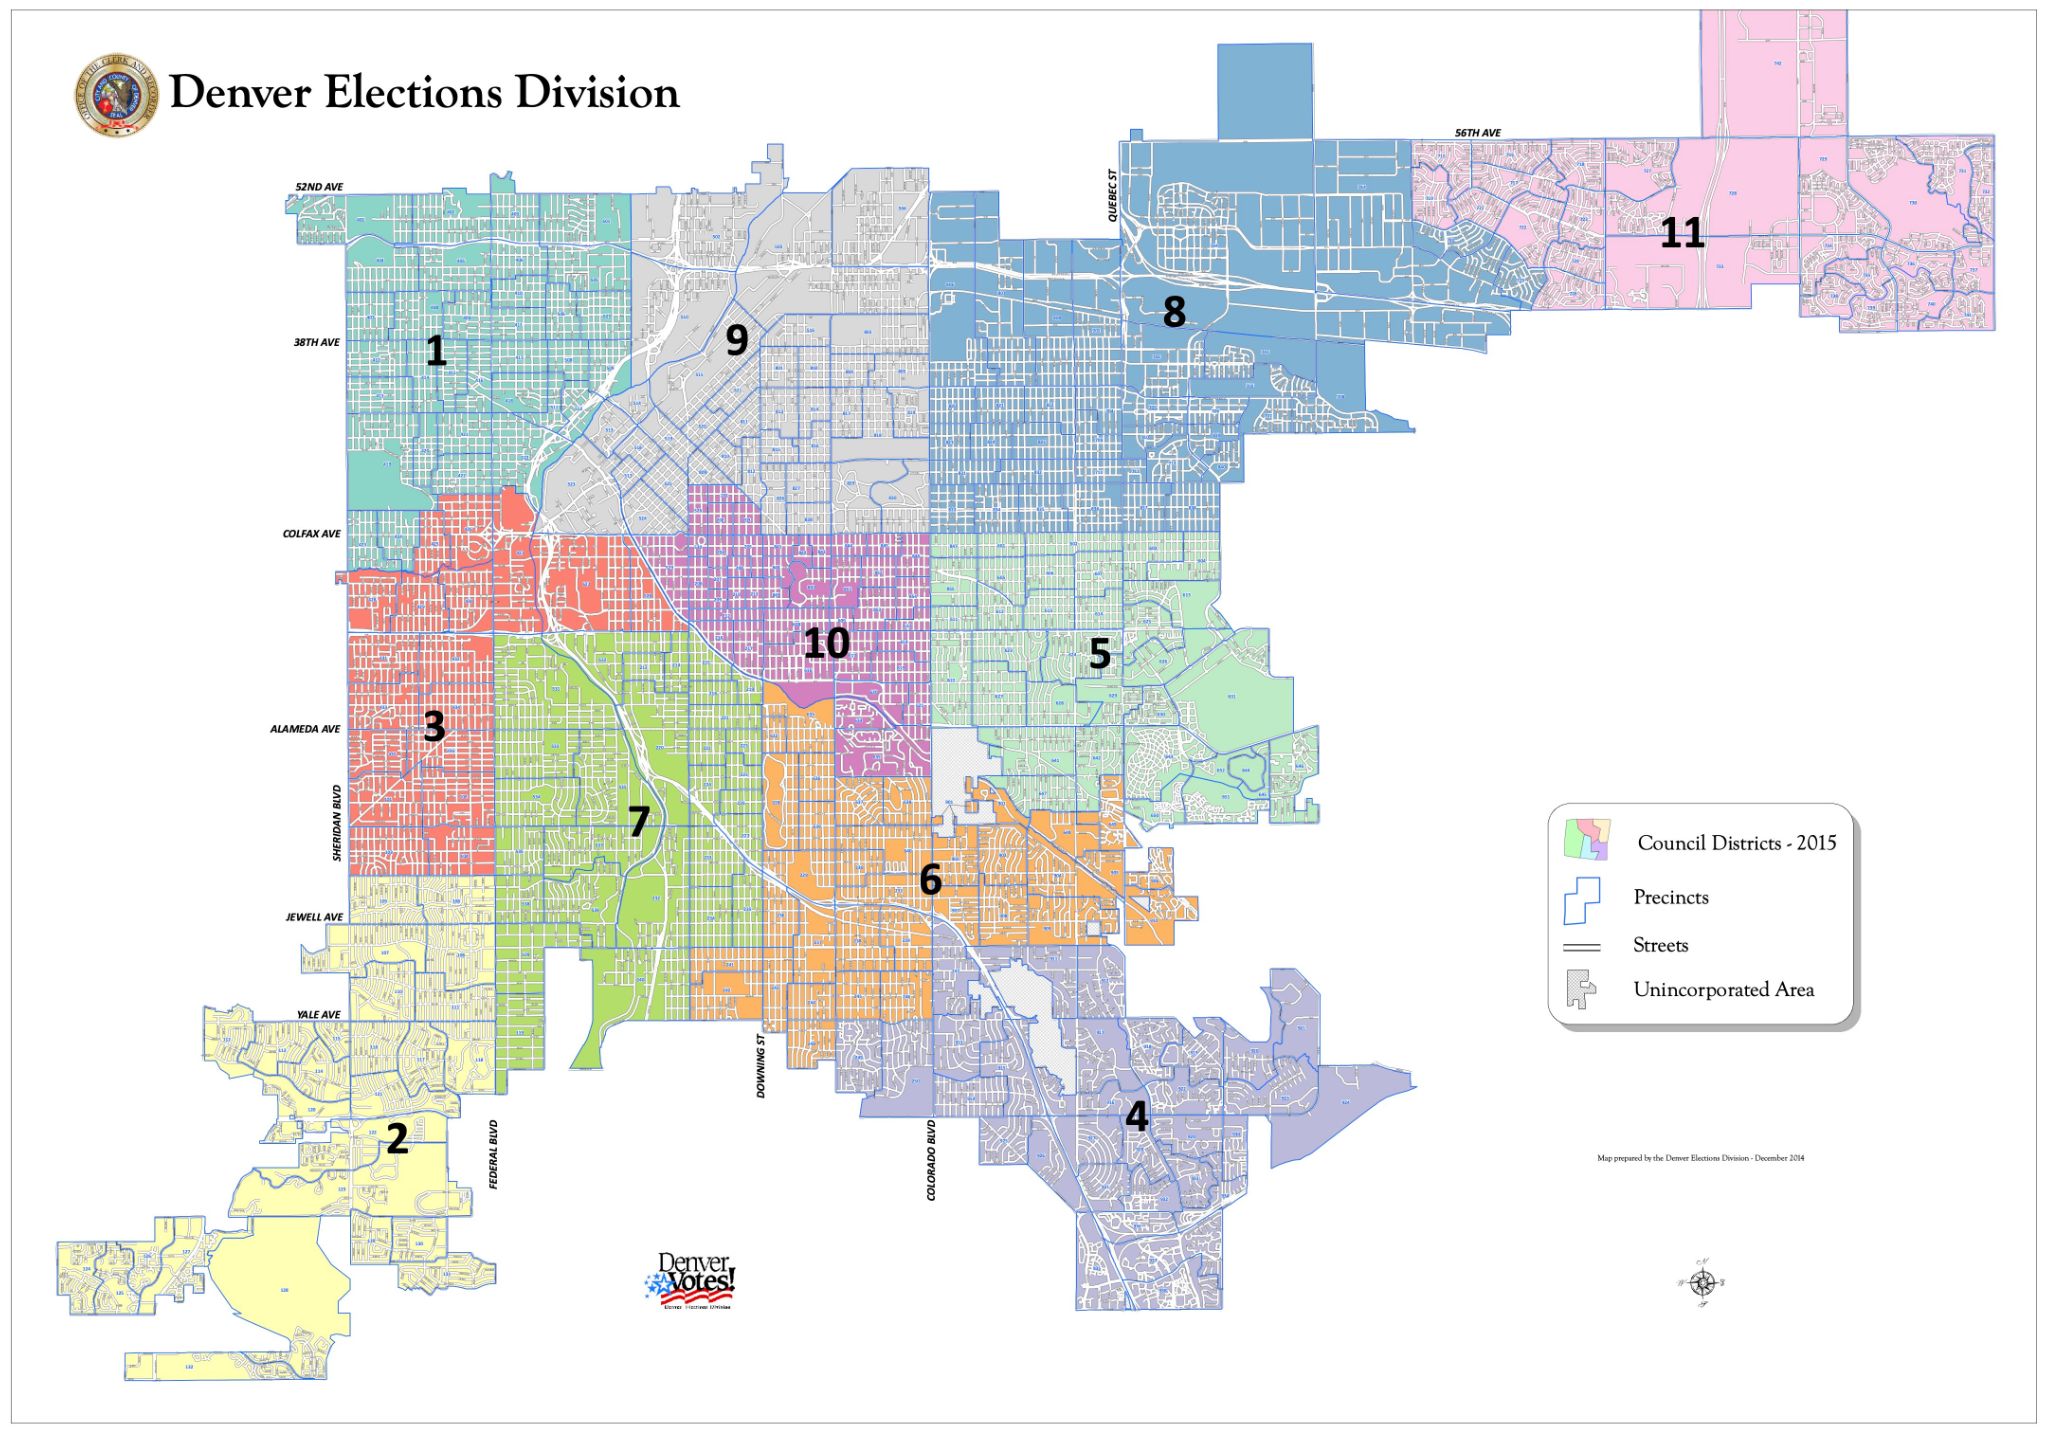
CSI complied data on all 11 districts and their neighborhoods. In the following tables the overall crime rate for the district is provided, then the number of incidents for the district, and finally the number of incidents in each neighborhood associated with the district. Figure 7 shows the location of each district with neighborhoods. This map is from 2015 and was in place until 2023.
Figure 7 – Denver City Council Maps[ii] – Boundaries Are Current through April 2023
Crime in City Council District 1
City Council District 1 consists of the following neighborhoods: Auraria, Berkeley, Chaffee Park, Globeville, Highland, Jefferson Park, Regis, Sloan’s Lake, Sunny Side, Sun Valley, West Colfax, West Highland. The number of incidents by category for the district from 2014 – 2022 are shown in Table 9.
- Incidents of crime have increased 25% from 5,020 in 2018 to 6,286 in 2022.
- Highland has the largest share (21%) of crime incidents among District 1 neighborhoods.
- From 2018 to 2022, theft from a motor vehicle accounted for 21.9% of all crime incidents, followed by auto theft and larceny at 15.5%.
Figure 8 – Incidents of Crime in Denver’s City Council District 1
| Table 8 – Change in Total Crime Rates in Denver Council District 1 | |||||
| 2014 | 2018 | 2022 | 2014-2018 | 2018-2022 | |
| Public Disorder | 16.55 | 11.33 | 14.57 | -31.5% | 28.6% |
| Drug/Alcohol | 6.76 | 5.34 | 1.93 | -21.0% | -63.8% |
| Sexual Assault | 0.70 | 1.17 | 0.62 | 68.4% | -47.3% |
| Other Crimes against Persons | 5.36 | 3.88 | 3.99 | -27.6% | 2.8% |
| All Other Crimes | 11.09 | 8.63 | 6.57 | -22.1% | -23.8% |
| White-collar Crime | 1.36 | 1.29 | 1.15 | -4.7% | -11.2% |
| Murder | 0.02 | 0.04 | 0.09 | 72.3% | 122.6% |
| Robbery | 1.29 | 1.49 | 1.50 | 14.9% | 1.1% |
| Aggravated Assault | 2.30 | 2.23 | 3.83 | -3.3% | 71.9% |
| Arson | 0.20 | 0.17 | 0.16 | -16.6% | -4.4% |
| Burglary | 8.54 | 8.21 | 8.17 | -3.9% | -0.4% |
| Larceny | 11.05 | 11.30 | 13.26 | 2.3% | 17.3% |
| Theft from Motor Vehicle | 9.02 | 13.21 | 20.68 | 46.4% | 56.6% |
| Auto Theft | 6.86 | 8.14 | 16.64 | 18.7% | 104.4% |
| Total | 81.09 | 76.44 | 93.19 | -5.7% | 21.9% |
| Table 9 – District 1, Number of Incidents | |||||||||
| 2014 | 2015 | 2016 | 2017 | 2018 | 2019 | 2020 | 2021 | 2022 | |
| Public Disorder | 1,003 | 886 | 868 | 891 | 744 | 629 | 777 | 878 | 983 |
| Drug/Alcohol | 410 | 394 | 332 | 382 | 351 | 282 | 139 | 156 | 131 |
| Sexual Assault | 42 | 51 | 47 | 75 | 77 | 64 | 32 | 48 | 42 |
| Other Crimes against Persons | 325 | 316 | 360 | 374 | 255 | 236 | 188 | 198 | 269 |
| All Other Crimes | 672 | 638 | 670 | 729 | 567 | 448 | 429 | 431 | 443 |
| White-collar Crime | 82 | 103 | 98 | 113 | 85 | 82 | 66 | 63 | 78 |
| Murder | 2 | 2 | 2 | 3 | 3 | 4 | 5 | 3 | 6 |
| Robbery | 78 | 96 | 88 | 92 | 98 | 90 | 90 | 108 | 101 |
| Aggravated Assault | 140 | 130 | 147 | 175 | 146 | 171 | 164 | 191 | 258 |
| Arson | 12 | 11 | 12 | 9 | 11 | 5 | 3 | 14 | 11 |
| Burglary | 518 | 581 | 556 | 530 | 539 | 460 | 673 | 597 | 551 |
| Larceny | 670 | 659 | 729 | 818 | 742 | 705 | 936 | 948 | 894 |
| Theft from Motor Vehicle | 547 | 613 | 612 | 687 | 867 | 856 | 1,196 | 1,484 | 1,395 |
| Auto Theft | 416 | 461 | 559 | 575 | 535 | 530 | 729 | 1,109 | 1,123 |
| Total | 4,917 | 4,940 | 5,080 | 5,451 | 5,020 | 4,564 | 5,427 | 6,226 | 6,286 |
The number of incidents by neighborhood in District 4 is shown in Table 10. Highland consistently has the largest number of crime incidents in District 4.
| Table 10 – Number of Incidents by Neighborhood, District 1 | |||||||||
| 2014 | 2015 | 2016 | 2017 | 2018 | 2019 | 2020 | 2021 | 2022 | |
| Auraria | 43 | 74 | 62 | 59 | 61 | 58 | 38 | 56 | 62 |
| Berkeley | 603 | 552 | 555 | 631 | 544 | 477 | 608 | 634 | 669 |
| Chaffee Park | 312 | 290 | 303 | 325 | 332 | 244 | 336 | 345 | 331 |
| Globeville | 61 | 58 | 59 | 67 | 68 | 63 | 75 | 80 | 101 |
| Highland | 874 | 866 | 1,047 | 1,049 | 964 | 903 | 1,134 | 1,321 | 1,275 |
| Jefferson Park | 365 | 348 | 386 | 445 | 446 | 436 | 461 | 601 | 515 |
| Regis | 350 | 352 | 310 | 309 | 294 | 284 | 355 | 376 | 351 |
| Sloan’s Lake | 468 | 555 | 488 | 571 | 478 | 427 | 497 | 627 | 587 |
| Sunny Side | 824 | 739 | 744 | 786 | 729 | 645 | 688 | 804 | 886 |
| Sun Valley | 49 | 55 | 61 | 54 | 46 | 39 | 35 | 38 | 46 |
| West Colfax | 468 | 488 | 507 | 602 | 532 | 488 | 540 | 602 | 717 |
| West Highland | 500 | 563 | 557 | 553 | 527 | 499 | 661 | 742 | 746 |
| Total District 1 | 4,917 | 4,940 | 5,080 | 5,451 | 5,020 | 4,564 | 5,427 | 6,226 | 6,286 |
Crime in City Council District 2
City Council District 2 consists of the following neighborhoods: Bear Valley, Fort Logan, Harvey Park, Harvey Park South, Mar Lee, Marston, and Ruby Hill. The number of incidents by category for the district from 2014 – 2022 are shown in Table 11.
- Incidents of crime have increased 8.5% from 2,192 in 2018 to 2,378 in 2022.
- Harvey Park South has the largest share (34.1%) of crime incidents among District 2 neighborhoods.
- From 2018 to 2022, theft from a motor vehicle accounts for 18.1% of all crime incidents, followed by auto theft, 16.9%.
Figure 9 – Incidents of Crime in Denver’s City Council District 2
| Table 11 – Change in Total Crime Rates in Denver Council District 2 | |||||
| 2014 | 2018 | 2022 | 2014-2018 | 2018-2022 | |
| Public Disorder | 7.518 | 4.689 | 6.090 | -37.6% | 29.9% |
| Drug/Alcohol | 2.027 | 1.875 | 0.619 | -7.5% | -67.0% |
| Sexual Assault | 0.383 | 0.578 | 0.480 | 51.2% | -17.0% |
| Other Crimes against Persons | 2.969 | 1.603 | 2.352 | -46.0% | 46.7% |
| All Other Crimes | 2.933 | 3.309 | 3.036 | 12.8% | -8.3% |
| White-collar Crime | 0.882 | 0.764 | 0.662 | -13.3% | -13.3% |
| Murder | 0.008 | 0.004 | 0.072 | -53.8% | 1827.9% |
| Robbery | 0.471 | 0.535 | 0.526 | 13.5% | -1.7% |
| Aggravated Assault | 1.005 | 1.392 | 1.814 | 38.5% | 30.3% |
| Arson | 0.093 | 0.034 | 0.048 | -63.1% | 39.7% |
| Burglary | 2.598 | 2.345 | 2.557 | -9.7% | 9.0% |
| Larceny | 5.643 | 3.866 | 3.636 | -31.5% | -5.9% |
| Theft from Motor Vehicle | 3.713 | 7.285 | 6.164 | 96.2% | -15.4% |
| Auto Theft | 3.430 | 4.313 | 6.373 | 25.8% | 47.8% |
| Total | 33.673 | 32.592 | 34.428 | -3.2% | 5.6% |
| Table 12 – District 2, Number of Incidents | |||||||||
| 2014 | 2015 | 2016 | 2017 | 2018 | 2019 | 2020 | 2021 | 2022 | |
| Public Disorder | 467 | 468 | 419 | 441 | 315 | 348 | 307 | 361 | 421 |
| Drug/Alcohol | 126 | 113 | 99 | 85 | 126 | 113 | 59 | 25 | 43 |
| Sexual Assault | 24 | 25 | 25 | 36 | 39 | 34 | 35 | 18 | 33 |
| Other Crimes against Persons | 184 | 160 | 192 | 239 | 108 | 128 | 130 | 126 | 162 |
| All Other Crimes | 182 | 257 | 190 | 372 | 223 | 217 | 239 | 206 | 210 |
| White-collar Crime | 55 | 59 | 48 | 45 | 51 | 57 | 65 | 51 | 46 |
| Murder | 1 | 3 | 2 | 4 | 0 | 2 | 1 | 3 | 5 |
| Robbery | 29 | 34 | 32 | 36 | 36 | 44 | 42 | 28 | 36 |
| Aggravated Assault | 62 | 68 | 81 | 71 | 94 | 92 | 89 | 110 | 125 |
| Arson | 6 | 9 | 5 | 7 | 2 | 2 | 7 | 7 | 3 |
| Burglary | 161 | 176 | 165 | 183 | 158 | 149 | 167 | 146 | 177 |
| Larceny | 350 | 357 | 331 | 284 | 260 | 300 | 305 | 262 | 251 |
| Theft from Motor Vehicle | 231 | 315 | 376 | 445 | 490 | 344 | 389 | 456 | 426 |
| Auto Theft | 213 | 242 | 287 | 371 | 290 | 247 | 356 | 465 | 440 |
| Total | 2,090 | 2,286 | 2,251 | 2,618 | 2,192 | 2,075 | 2,190 | 2,264 | 2,378 |
The number of incidents by neighborhood in District 2 is shown in Table 13. Bear Valley, Harvey Park South, and Marston are where the greatest number of incidents consistently occur.
| Table 13 – Number of Incidents by Neighborhood, District 2 | |||||||||
| 2014 | 2015 | 2016 | 2017 | 2018 | 2019 | 2020 | 2021 | 2022 | |
| Bear Valley | 474 | 485 | 530 | 620 | 461 | 396 | 459 | 491 | 551 |
| Fort Logan | 252 | 342 | 313 | 387 | 366 | 367 | 307 | 336 | 375 |
| Harvey Park | 129 | 140 | 149 | 155 | 138 | 121 | 147 | 131 | 133 |
| Harvey Park South | 621 | 599 | 522 | 571 | 523 | 485 | 516 | 572 | 546 |
| Mar Lee | 227 | 230 | 251 | 266 | 255 | 232 | 238 | 215 | 236 |
| Marston | 349 | 454 | 447 | 583 | 415 | 442 | 487 | 482 | 498 |
| Ruby Hill | 38 | 36 | 39 | 37 | 33 | 32 | 36 | 37 | 39 |
| Total District 2 | 2,090 | 2,286 | 2,251 | 2,618 | 2,192 | 2,075 | 2,190 | 2,264 | 2,378 |
Crime in City Council District 3
City Council District 3 consists of the following neighborhoods: Barnum, Barnum West, Lincoln Park, Valverde, Ville Park, Westwood, Sun Valley, West Colfax, Mar Lee, Ruby Hill. The number of incidents by category for the district from 2014 -2022 are shown in Table 15.
- Incidents of crime have increased 11.3% from 6,087 in 2018 to 6,776 in 2022.
- Lincoln Park has the largest share (23.8%) of crime incidents among District 3 neighborhoods.
- From 2018 to 2022, public disorder accounts for 15.3% of all crime incidents, followed by auto theft and theft from a motor vehicle at 13.4%.
Figure 10 – Incidents of Crime in Denver’s City Council District 3
| Table 14 – Change in Total Crime Rates in Denver Council District 3 | |||||
| 2014 | 2018 | 2022 | 2014-2018 | 2018-2022 | |
| Public Disorder | 21.49 | 13.47 | 15.89 | -37.3% | 18.0% |
| Drug/Alcohol | 11.69 | 11.70 | 4.91 | 0.1% | -58.0% |
| Sexual Assault | 1.14 | 1.43 | 1.04 | 25.4% | -27.1% |
| Other Crimes against Persons | 10.58 | 5.90 | 6.55 | -44.2% | 11.0% |
| All Other Crimes | 19.25 | 18.93 | 18.17 | -1.7% | -4.0% |
| White-collar Crime | 1.65 | 1.25 | 1.01 | -24.2% | -19.5% |
| Murder | 0.15 | 0.13 | 0.17 | -14.5% | 35.6% |
| Robbery | 2.00 | 2.35 | 1.90 | 17.8% | -19.1% |
| Aggravated Assault | 4.41 | 5.08 | 6.68 | 15.1% | 31.5% |
| Arson | 0.26 | 0.34 | 0.45 | 31.1% | 33.5% |
| Burglary | 7.88 | 5.48 | 6.37 | -30.5% | 16.3% |
| Larceny | 10.07 | 8.16 | 8.91 | -18.9% | 9.2% |
| Theft from Motor Vehicle | 7.26 | 10.26 | 13.92 | 41.3% | 35.7% |
| Auto Theft | 8.30 | 10.04 | 16.45 | 21.0% | 63.9% |
| Total | 106.12 | 94.51 | 102.43 | -10.9% | 8.4% |
| Table 15 – District 3, Number of Incidents | |||||||||
| 2014 | 2015 | 2016 | 2017 | 2018 | 2019 | 2020 | 2021 | 2022 | |
| Public Disorder | 1,278 | 1,255 | 1,174 | 1,079 | 867 | 840 | 876 | 946 | 1,051 |
| Drug/Alcohol | 695 | 636 | 706 | 652 | 753 | 488 | 267 | 233 | 325 |
| Sexual Assault | 68 | 87 | 103 | 111 | 92 | 107 | 70 | 65 | 69 |
| Other Crimes against Persons | 629 | 628 | 650 | 657 | 380 | 431 | 409 | 430 | 433 |
| All Other Crimes | 1,145 | 1,122 | 1,215 | 1,408 | 1,219 | 1,018 | 1,092 | 1,133 | 1,202 |
| White-collar Crime | 98 | 104 | 91 | 98 | 81 | 72 | 69 | 60 | 67 |
| Murder | 9 | 3 | 6 | 4 | 8 | 8 | 14 | 9 | 11 |
| Robbery | 119 | 160 | 134 | 140 | 151 | 133 | 137 | 129 | 126 |
| Aggravated Assault | 263 | 289 | 315 | 317 | 327 | 314 | 353 | 412 | 442 |
| Arson | 15 | 19 | 16 | 20 | 22 | 18 | 19 | 23 | 30 |
| Burglary | 468 | 494 | 395 | 357 | 353 | 282 | 399 | 417 | 421 |
| Larceny | 599 | 568 | 527 | 571 | 526 | 521 | 640 | 559 | 590 |
| Theft from Motor Vehicle | 432 | 526 | 593 | 533 | 661 | 611 | 771 | 942 | 921 |
| Auto Theft | 493 | 650 | 671 | 599 | 647 | 490 | 676 | 1,038 | 1,088 |
| Total | 6,310 | 6,539 | 6,595 | 6,546 | 6,087 | 5,332 | 5,792 | 6,396 | 6,776 |
The number of incidents by neighborhood in District 3 is shown in Table 16.
| Table 16 – Number of Incidents by Neighborhood, District 3 | |||||||||
| 2014 | 2015 | 2016 | 2017 | 2018 | 2019 | 2020 | 2021 | 2022 | |
| Barnum | 550 | 602 | 551 | 606 | 478 | 426 | 464 | 455 | 497 |
| Barnum West | 360 | 370 | 396 | 432 | 361 | 289 | 304 | 375 | 375 |
| Lincoln Park | 1,564 | 1,596 | 1,764 | 1,471 | 1,519 | 1,313 | 1,502 | 1,557 | 1,645 |
| Valverde | 51 | 48 | 45 | 47 | 44 | 38 | 45 | 51 | 55 |
| Ville Park | 814 | 837 | 769 | 833 | 862 | 727 | 826 | 938 | 968 |
| Westwood | 1,459 | 1,495 | 1,362 | 1,346 | 1,199 | 1,079 | 1,131 | 1,418 | 1,361 |
| Sun Valley | 394 | 440 | 491 | 429 | 369 | 310 | 278 | 303 | 368 |
| West Colfax | 701 | 731 | 761 | 904 | 797 | 733 | 809 | 904 | 1,075 |
| Mar Lee | 379 | 384 | 418 | 443 | 425 | 387 | 397 | 358 | 393 |
| Ruby Hill | 38 | 36 | 39 | 37 | 33 | 32 | 36 | 37 | 39 |
| Total District 3 | 6,310 | 6,539 | 6,595 | 6,546 | 6,087 | 5,332 | 5,792 | 6,396 | 6,776 |
Crime in City Council District 4
City Council District 4 consists of the following neighborhoods: Goldsmith, Hampden, Hampden South, Kennedy, Southmoor Park, University Hills, and Wellshire. The number of incidents by category for the district from 2014 -2022 are shown in Table 17.
- Incidents of crime have increased 68% from 3,459 in 2018 to 5,812 in 2022.
- Hampden and Hampden South have the largest share (26.6% and 26.9% respectively) of crime incidents among District 3 neighborhoods.
- From 2018 to 2022, theft from a motor vehicle accounts for the largest share of crime incidents, 23%, followed closely by auto theft, 21.8% public disorder, 15.8%.
Figure 11 – Incidents of Crime in Denver’s City Council District 4
| Table 17 – Change in Total Crime Rates in Denver Council District 4 | |||||
| 2014 | 2018 | 2022 | 2014-2018 | 2018-2022 | |
| Public Disorder | 8.70 | 6.51 | 13.18 | -25.2% | 102.5% |
| Drug/Alcohol | 1.55 | 3.46 | 2.71 | 122.9% | -21.8% |
| Sexual Assault | 0.63 | 0.75 | 0.56 | 20.0% | -25.1% |
| Other Crimes against Persons | 3.56 | 2.20 | 3.63 | -38.2% | 64.6% |
| All Other Crimes | 4.87 | 3.90 | 4.25 | -19.9% | 9.0% |
| White-collar Crime | 1.51 | 1.26 | 1.75 | -16.3% | 38.8% |
| Murder | 0.03 | 0.04 | 0.03 | 38.5% | -35.1% |
| Robbery | 0.77 | 1.10 | 1.38 | 43.2% | 25.6% |
| Aggravated Assault | 1.49 | 1.88 | 3.48 | 26.3% | 85.0% |
| Arson | 0.14 | 0.04 | 0.06 | -69.2% | 29.8% |
| Burglary | 6.07 | 4.23 | 4.81 | -30.3% | 13.7% |
| Larceny | 7.09 | 7.13 | 8.01 | 0.5% | 12.4% |
| Theft from Motor Vehicle | 6.42 | 11.53 | 17.92 | 79.7% | 55.4% |
| Auto Theft | 3.47 | 6.07 | 20.23 | 75.0% | 233.2% |
| Total | 46.30 | 50.12 | 81.99 | 8.2% | 63.6% |
| Table 18 – District 4, Number of Incidents | |||||||||
| 2014 | 2015 | 2016 | 2017 | 2018 | 2019 | 2020 | 2021 | 2022 | |
| Public Disorder | 554 | 713 | 636 | 541 | 449 | 470 | 645 | 884 | 934 |
| Drug/Alcohol | 99 | 121 | 168 | 240 | 239 | 162 | 74 | 71 | 192 |
| Sexual Assault | 40 | 38 | 37 | 58 | 52 | 51 | 41 | 38 | 40 |
| Other Crimes against Persons | 227 | 305 | 259 | 326 | 152 | 172 | 170 | 184 | 257 |
| All Other Crimes | 310 | 328 | 360 | 326 | 269 | 192 | 199 | 234 | 301 |
| White-collar Crime | 96 | 113 | 108 | 94 | 87 | 105 | 93 | 102 | 124 |
| Murder | 2 | 3 | 1 | 4 | 3 | 2 | 5 | 6 | 2 |
| Robbery | 49 | 46 | 54 | 81 | 76 | 66 | 79 | 98 | 98 |
| Aggravated Assault | 95 | 107 | 123 | 101 | 130 | 114 | 180 | 207 | 247 |
| Arson | 9 | 3 | 8 | 6 | 3 | 7 | 5 | 13 | 4 |
| Burglary | 387 | 397 | 335 | 412 | 292 | 274 | 366 | 346 | 341 |
| Larceny | 452 | 463 | 448 | 468 | 492 | 474 | 523 | 513 | 568 |
| Theft from Motor Vehicle | 409 | 526 | 583 | 692 | 796 | 802 | 986 | 1,232 | 1,270 |
| Auto Theft | 221 | 298 | 344 | 518 | 419 | 443 | 912 | 1,266 | 1,434 |
| Total | 2,950 | 3,461 | 3,464 | 3,867 | 3,459 | 3,334 | 4,278 | 5,194 | 5,812 |
The number of incidents by neighborhood in District 4 is shown in Table 19. Hampden and Hampden South are where the greatest number of incidents consistently occur.
| Table 19 – Number of Incidents by Neighborhood, District 4 | |||||||||
| 2014 | 2015 | 2016 | 2017 | 2018 | 2019 | 2020 | 2021 | 2022 | |
| Goldsmith | 407 | 413 | 446 | 586 | 445 | 448 | 538 | 760 | 724 |
| Hampden | 942 | 1,081 | 1,015 | 1,188 | 1,047 | 969 | 1,435 | 1,732 | 1,823 |
| Hampden South | 598 | 814 | 814 | 851 | 730 | 744 | 1,005 | 1,226 | 1,427 |
| Kennedy | 257 | 280 | 302 | 359 | 312 | 356 | 399 | 494 | 593 |
| Southmoor Park | 198 | 246 | 241 | 317 | 281 | 313 | 402 | 415 | 496 |
| University Hills | 479 | 531 | 583 | 482 | 569 | 441 | 436 | 503 | 678 |
| Wellshire | 69 | 96 | 63 | 84 | 75 | 63 | 63 | 64 | 71 |
| Total District 4 | 2,950 | 3,461 | 3,464 | 3,867 | 3,459 | 3,334 | 4,278 | 5,194 | 5,812 |
Crime in City Council District 5
City Council District 5 consists of the following neighborhoods: Belcaro, Cherry Creek, East Colfax, Hale, Hilltop, Lowry Field, Montclair, Washington Virginia Vale, and Windsor. The number of incidents by category for the district from 2014 -2022 are shown in Table 20.
- Incidents of crime have increased 46.1% from 4,291 in 2018 to 6,269 in 2022.
- East Colfax has the largest share (22%) of crime incidents among District 5 neighborhoods.
- From 2018 to 2022, theft from a motor vehicle accounts for the largest share of crime incidents, 18.9%, followed closely by auto theft, 17.5% and larceny, 15.4%.
Figure 12 – Incidents of Crime in Denver’s City Council District 5
| Table 20 – Change in Total Crime Rates in Denver Council District 5 | |||||
| 2014 | 2018 | 2022 | 2014-2018 | 2018-2022 | |
| Public Disorder | 12.59 | 7.95 | 16.11 | -36.9% | 102.7% |
| Drug/Alcohol | 8.49 | 7.65 | 1.37 | -9.9% | -82.1% |
| Sexual Assault | 0.74 | 0.86 | 0.61 | 17.0% | -29.4% |
| Other Crimes against Persons | 5.30 | 3.30 | 3.66 | -37.7% | 10.7% |
| All Other Crimes | 8.57 | 6.84 | 6.62 | -20.1% | -3.2% |
| White-collar Crime | 1.67 | 1.95 | 1.86 | 16.8% | -4.5% |
| Murder | 0.03 | 0.05 | 0.10 | 59.0% | 116.7% |
| Robbery | 1.18 | 1.30 | 1.66 | 10.6% | 27.1% |
| Aggravated Assault | 1.96 | 1.97 | 3.89 | 0.0% | 98.2% |
| Arson | 0.20 | 0.13 | 0.27 | -38.6% | 113.2% |
| Burglary | 6.98 | 5.49 | 6.05 | -21.3% | 10.1% |
| Larceny | 12.74 | 10.61 | 12.05 | -16.7% | 13.6% |
| Theft from Motor Vehicle | 6.50 | 10.11 | 17.29 | 55.6% | 71.1% |
| Auto Theft | 3.17 | 5.50 | 19.09 | 73.7% | 246.8% |
| Total | 70.12 | 63.71 | 90.63 | -9.1% | 42.3% |
| Table 21 – District 5, Number of Incidents | |||||||||
| 2014 | 2015 | 2016 | 2017 | 2018 | 2019 | 2020 | 2021 | 2022 | |
| Public Disorder | 783 | 719 | 752 | 730 | 535 | 543 | 680 | 904 | 1,114 |
| Drug/Alcohol | 528 | 395 | 473 | 430 | 515 | 252 | 122 | 135 | 95 |
| Sexual Assault | 46 | 69 | 51 | 71 | 58 | 66 | 55 | 54 | 42 |
| Other Crimes against Persons | 330 | 338 | 336 | 335 | 223 | 228 | 199 | 215 | 253 |
| All Other Crimes | 533 | 433 | 566 | 613 | 461 | 323 | 414 | 471 | 458 |
| White-collar Crime | 104 | 144 | 123 | 103 | 131 | 144 | 103 | 113 | 129 |
| Murder | 2 | 6 | 4 | 4 | 3 | 5 | 10 | 13 | 7 |
| Robbery | 73 | 86 | 91 | 120 | 88 | 87 | 102 | 97 | 115 |
| Aggravated Assault | 122 | 131 | 139 | 170 | 132 | 137 | 206 | 245 | 269 |
| Arson | 13 | 9 | 6 | 9 | 8 | 6 | 6 | 10 | 19 |
| Burglary | 434 | 548 | 468 | 446 | 370 | 360 | 471 | 553 | 418 |
| Larceny | 792 | 752 | 787 | 756 | 715 | 766 | 849 | 831 | 834 |
| Theft from Motor Vehicle | 404 | 539 | 441 | 571 | 681 | 681 | 911 | 1,233 | 1,196 |
| Auto Theft | 197 | 272 | 271 | 420 | 371 | 453 | 832 | 1,127 | 1,321 |
| Total | 4,360 | 4,441 | 4,508 | 4,779 | 4,291 | 4,050 | 4,961 | 6,001 | 6,269 |
The number of incidents by neighborhood in District 5 is shown in Table 22.
| Table 22 – Number of Incidents by Neighborhood, District 5 | |||||||||
| 2014 | 2015 | 2016 | 2017 | 2018 | 2019 | 2020 | 2021 | 2022 | |
| Belcaro | 11 | 12 | 10 | 11 | 11 | 14 | 17 | 16 | 17 |
| Cherry Creek | 529 | 704 | 637 | 641 | 548 | 693 | 635 | 669 | 837 |
| East Colfax | 1,302 | 1,177 | 1,454 | 1,566 | 1,337 | 927 | 1,151 | 1,362 | 1,336 |
| Hale | 335 | 354 | 384 | 401 | 378 | 391 | 503 | 665 | 714 |
| Hilltop | 250 | 300 | 241 | 228 | 254 | 289 | 349 | 422 | 416 |
| Lowry Field | 531 | 482 | 429 | 479 | 410 | 489 | 628 | 835 | 967 |
| Montclair | 454 | 419 | 442 | 466 | 396 | 349 | 500 | 533 | 534 |
| Washington Virginia Vale | 512 | 548 | 470 | 509 | 508 | 457 | 538 | 695 | 681 |
| Windsor | 437 | 446 | 440 | 478 | 448 | 443 | 641 | 805 | 767 |
| Total District 5 | 4,360 | 4,441 | 4,508 | 4,779 | 4,291 | 4,050 | 4,961 | 6,001 | 6,269 |
Crime in City Council District 6
City Council District 6 consists of the following neighborhoods: Cory Merrill, Indian Creek, Rosedale, University, University Park, Virginia Village, Washington Park, Washington Virginia Vale, Windsor, and Rosedale. The number of incidents by category for the district from 2014 – 2022 are shown in Table 23
- Incidents of crime have increased 46.7% from 2,728 in 2018 to 4,001 in 2022.
- Virginia Village has the largest share (25%) of crime incidents among District 6 neighborhoods.
- From 2018 to 2022, theft from a motor vehicle accounts for the largest share of crime incidents, 23.9%, followed closely by auto theft, 17.1% and larceny, 16.9%.
Figure 13 – Incidents of Crime in Denver’s City Council District 6
| Table 23 – Change in Total Crime Rates in Denver Council District 6 | |||||
| 2014 | 2018 | 2022 | 2014-2018 | 2018-2022 | |
| Public Disorder | 7.99 | 5.34 | 8.68 | -33.2% | 62.7% |
| Drug/Alcohol | 2.21 | 2.72 | 1.09 | 23.0% | -59.8% |
| Sexual Assault | 0.58 | 0.56 | 0.51 | -3.3% | -8.4% |
| Other Crimes against Persons | 2.80 | 1.57 | 2.22 | -43.9% | 41.1% |
| All Other Crimes | 4.51 | 2.78 | 2.16 | -38.4% | -22.5% |
| White-collar Crime | 1.24 | 1.28 | 1.61 | 3.0% | 25.8% |
| Murder | 0.02 | 0.02 | 0.03 | 38.5% | 29.8% |
| Robbery | 0.57 | 0.74 | 0.79 | 29.4% | 7.3% |
| Aggravated Assault | 0.72 | 0.82 | 1.66 | 14.2% | 102.8% |
| Arson | 0.27 | 0.04 | 0.08 | -84.2% | 83.2% |
| Burglary | 6.12 | 3.92 | 4.86 | -35.9% | 24.1% |
| Larceny | 8.60 | 6.97 | 7.73 | -19.0% | 10.9% |
| Theft from Motor Vehicle | 5.47 | 9.03 | 14.25 | 65.1% | 57.9% |
| Auto Theft | 2.89 | 3.89 | 10.97 | 34.4% | 182.4% |
| Total | 43.99 | 39.67 | 56.65 | -9.8% | 42.8% |
| Table 24 – District 6, Number of Incidents | |||||||||
| 2014 | 2015 | 2016 | 2017 | 2018 | 2019 | 2020 | 2021 | 2022 | |
| Public Disorder | 507 | 531 | 473 | 438 | 367 | 306 | 408 | 547 | 613 |
| Drug/Alcohol | 140 | 134 | 150 | 182 | 187 | 160 | 99 | 95 | 77 |
| Sexual Assault | 37 | 28 | 37 | 40 | 39 | 39 | 39 | 40 | 36 |
| Other Crimes against Persons | 178 | 189 | 188 | 204 | 108 | 118 | 120 | 121 | 157 |
| All Other Crimes | 287 | 225 | 202 | 224 | 191 | 169 | 150 | 171 | 152 |
| White-collar Crime | 79 | 113 | 81 | 104 | 88 | 92 | 70 | 89 | 114 |
| Murder | 1 | 1 | 1 | 1 | 2 | 3 | 2 | 0 | 2 |
| Robbery | 36 | 42 | 51 | 41 | 51 | 39 | 39 | 57 | 56 |
| Aggravated Assault | 46 | 63 | 58 | 58 | 56 | 56 | 68 | 95 | 117 |
| Arson | 17 | 6 | 1 | 5 | 3 | 2 | 3 | 3 | 6 |
| Burglary | 388 | 408 | 322 | 377 | 270 | 254 | 305 | 440 | 344 |
| Larceny | 546 | 460 | 451 | 485 | 479 | 411 | 621 | 777 | 546 |
| Theft from Motor Vehicle | 347 | 581 | 386 | 470 | 621 | 603 | 733 | 983 | 1,007 |
| Auto Theft | 184 | 248 | 221 | 278 | 267 | 289 | 569 | 748 | 775 |
| Total | 2,793 | 3,028 | 2,623 | 2,908 | 2,728 | 2,542 | 3,225 | 4,166 | 4,001 |
The number of incidents by neighborhood in District 6 is shown in Table 25.
| Table 25 – Number of Incidents by Neighborhood, District 6 | |||||||||
| 2014 | 2015 | 2016 | 2017 | 2018 | 2019 | 2020 | 2021 | 2022 | |
| Cory Merrill | 292 | 378 | 284 | 288 | 257 | 270 | 311 | 550 | 429 |
| Indian Creek | 67 | 74 | 81 | 84 | 76 | 80 | 130 | 173 | 135 |
| Rosedale | 126 | 122 | 117 | 116 | 109 | 110 | 118 | 118 | 116 |
| University | 419 | 405 | 401 | 474 | 419 | 323 | 370 | 491 | 512 |
| University Park | 348 | 448 | 359 | 398 | 476 | 397 | 534 | 660 | 737 |
| Virginia Village | 696 | 681 | 605 | 716 | 603 | 627 | 859 | 1,060 | 962 |
| Washington Park | 361 | 395 | 324 | 337 | 297 | 257 | 325 | 413 | 416 |
| Washington Virginia Vale | 341 | 366 | 314 | 339 | 339 | 304 | 358 | 463 | 454 |
| Windsor | 49 | 50 | 49 | 53 | 50 | 49 | 71 | 89 | 85 |
| Rosedale | 95 | 110 | 89 | 102 | 103 | 124 | 149 | 148 | 155 |
| Total District 6 | 2,793 | 3,028 | 2,623 | 2,908 | 2,728 | 2,542 | 3,225 | 4,166 | 4,001 |
Crime in City Council District 7
City Council District 7 consists of the following neighborhoods: Cory Merrill, Indian Creek, Rosedale, University, University Park, Virginia Village, Washington Park, Washington Virginia Vale, Windsor, and Rosedale. The number of incidents by category for the district from 2014 -2022 are shown in Table 26.
- Incidents of crime have increased 22.7% from 6,242 in 2018 to 7,659 in 2022.
- Baker has the largest share (18.1%) of crime incidents among District 7 neighborhoods.
- From 2018 to 2022, theft from a motor vehicle accounts for the largest share of crime incidents (18.3%) followed by auto theft (16.4%) and public disorder (16.3%).
Figure 14 – Incidents of Crime in Denver’s City Council District 7
| Table 26 – Change in Total Crime Rates in Denver Council District 7 | |||||
| 2014 | 2018 | 2022 | 2014-2018 | 2018-2022 | |
| Public Disorder | 21.68 | 13.97 | 19.22 | -35.6% | 37.6% |
| Drug/Alcohol | 9.90 | 8.39 | 4.06 | -15.3% | -51.6% |
| Sexual Assault | 1.04 | 1.06 | 1.08 | 2.8% | 1.3% |
| Other Crimes against Persons | 8.20 | 4.74 | 5.76 | -42.2% | 21.4% |
| All Other Crimes | 18.75 | 12.10 | 10.30 | -35.5% | -14.8% |
| White-collar Crime | 2.17 | 2.06 | 1.31 | -4.9% | -36.5% |
| Murder | 0.02 | 0.09 | 0.07 | 311.9% | -21.1% |
| Robbery | 2.25 | 2.28 | 1.95 | 1.3% | -14.4% |
| Aggravated Assault | 4.16 | 3.83 | 5.47 | -7.8% | 42.6% |
| Arson | 0.22 | 0.32 | 0.35 | 47.3% | 11.4% |
| Burglary | 11.14 | 8.24 | 11.36 | -26.0% | 37.8% |
| Larceny | 21.80 | 14.81 | 15.90 | -32.1% | 7.4% |
| Theft from Motor Vehicle | 10.82 | 15.88 | 21.53 | 46.8% | 35.6% |
| Auto Theft | 9.87 | 10.82 | 19.42 | 9.6% | 79.5% |
| Total | 122.01 | 98.59 | 117.79 | -19.2% | 19.5% |
| Table 27 – District 7, Number of Incidents | |||||||||
| 2014 | 2015 | 2016 | 2017 | 2018 | 2019 | 2020 | 2021 | 2022 | |
| Public Disorder | 1,267 | 1,084 | 1,119 | 999 | 884 | 738 | 990 | 1,079 | 1,250 |
| Drug/Alcohol | 579 | 526 | 503 | 544 | 531 | 634 | 380 | 243 | 264 |
| Sexual Assault | 61 | 74 | 80 | 68 | 67 | 76 | 51 | 61 | 70 |
| Other Crimes against Persons | 479 | 524 | 449 | 431 | 300 | 283 | 291 | 294 | 374 |
| All Other Crimes | 1,096 | 853 | 891 | 960 | 766 | 659 | 671 | 598 | 670 |
| White-collar Crime | 127 | 135 | 127 | 140 | 131 | 140 | 117 | 76 | 85 |
| Murder | 1 | 6 | 4 | 7 | 6 | 6 | 9 | 12 | 5 |
| Robbery | 132 | 132 | 118 | 133 | 145 | 122 | 135 | 128 | 127 |
| Aggravated Assault | 243 | 223 | 249 | 221 | 243 | 227 | 321 | 328 | 355 |
| Arson | 13 | 11 | 10 | 25 | 20 | 15 | 26 | 26 | 23 |
| Burglary | 651 | 663 | 721 | 541 | 522 | 437 | 653 | 744 | 739 |
| Larceny | 1,274 | 1,098 | 1,093 | 891 | 937 | 1,008 | 1,078 | 958 | 1,034 |
| Theft from Motor Vehicle | 632 | 716 | 982 | 882 | 1,005 | 888 | 1,282 | 1,450 | 1,400 |
| Auto Theft | 577 | 661 | 687 | 669 | 685 | 570 | 991 | 1,188 | 1,263 |
| Total | 7,131 | 6,706 | 7,031 | 6,510 | 6,242 | 5,803 | 6,994 | 7,185 | 7,659 |
The number of incidents by neighborhood in District 7 is shown in Table 28.
| Table 28 – Number of Incidents by Neighborhood, District 7 | |||||||||
| 2014 | 2015 | 2016 | 2017 | 2018 | 2019 | 2020 | 2021 | 2022 | |
| Athmar Park | 923 | 893 | 900 | 753 | 714 | 596 | 704 | 706 | 785 |
| Baker | 1,389 | 1,153 | 1,228 | 1,134 | 1,037 | 959 | 1,159 | 1,263 | 1,388 |
| College View South Platte | 989 | 970 | 975 | 808 | 776 | 849 | 788 | 760 | 806 |
| Overland | 503 | 425 | 515 | 469 | 503 | 482 | 658 | 565 | 604 |
| Platt Park | 397 | 400 | 383 | 330 | 409 | 344 | 500 | 488 | 523 |
| Speer | 586 | 550 | 628 | 650 | 655 | 596 | 772 | 906 | 933 |
| Washington Park West | 429 | 408 | 414 | 369 | 331 | 346 | 526 | 610 | 628 |
| Sun Valley | 49 | 55 | 61 | 54 | 46 | 39 | 35 | 38 | 46 |
| Harvey Park | 516 | 560 | 597 | 621 | 554 | 486 | 586 | 526 | 531 |
| Mar Lee | 152 | 153 | 167 | 177 | 170 | 155 | 159 | 143 | 157 |
| Ruby Hill | 682 | 641 | 698 | 660 | 599 | 568 | 651 | 667 | 707 |
| Barnum | 61 | 67 | 61 | 67 | 53 | 47 | 52 | 51 | 55 |
| Valverde | 455 | 431 | 404 | 419 | 396 | 338 | 405 | 463 | 495 |
| Total District 7 | 7,131 | 6,706 | 7,031 | 6,510 | 6,242 | 5,803 | 6,994 | 7,185 | 7,659 |
Crime in City Council District 8
City Council District 8 consists of the following neighborhoods: Central Park (Old Stapleton) Montbello, Northeast Park Hill, North Park Hill, Skyland, South Park Hill, and East Colfax. The number of incidents by category for the district from 2014 – 2022 are shown in Table 29.
- Incidents of crime have increased 50% from 5,364 in 2018 to 8,047 in 2022.
- Central Park has the largest share (48%) of crime incidents among District 8 neighborhoods.
- From 2018 to 2022, larceny accounts for the largest share of crime incidents, 198.4%, followed closely by auto theft, 17.9% and theft from a motor vehicle, 16%.
Figure 15 – Incidents of Crime in Denver’s City Council District 8
| Table 29 – Change in Total Crime Rates in Denver Council District 8 | |||||
| 2014 | 2018 | 2022 | 2014-2018 | 2018-2022 | |
| Public Disorder | 13.50 | 10.27 | 18.13 | -23.9% | 76.4% |
| Drug/Alcohol | 5.74 | 6.04 | 2.51 | 5.3% | -58.5% |
| Sexual Assault | 1.14 | 0.98 | 0.92 | -14.3% | -6.1% |
| Other Crimes against Persons | 6.31 | 4.32 | 5.11 | -31.5% | 18.3% |
| All Other Crimes | 10.19 | 11.28 | 9.75 | 10.7% | -13.6% |
| White-collar Crime | 1.89 | 1.77 | 1.65 | -6.6% | -6.9% |
| Murder | 0.09 | 0.11 | 0.09 | 32.9% | -18.9% |
| Robbery | 1.64 | 1.54 | 1.98 | -5.9% | 28.6% |
| Aggravated Assault | 3.12 | 3.23 | 5.36 | 3.6% | 65.7% |
| Arson | 0.23 | 0.18 | 0.19 | -23.3% | 4.3% |
| Burglary | 7.34 | 7.29 | 7.83 | -0.7% | 7.5% |
| Larceny | 21.03 | 18.59 | 20.17 | -11.6% | 8.5% |
| Theft from Motor Vehicle | 8.44 | 11.17 | 21.26 | 32.3% | 90.4% |
| Auto Theft | 5.63 | 7.98 | 28.87 | 41.6% | 262.0% |
| Total | 86.30 | 84.76 | 123.81 | -1.8% | 46.1% |
| Table 30 – District 8, Number of Incidents | |||||||||
| 2014 | 2015 | 2016 | 2017 | 2018 | 2019 | 2020 | 2021 | 2022 | |
| Public Disorder | 789 | 834 | 880 | 762 | 650 | 646 | 760 | 1,044 | 1,178 |
| Drug/Alcohol | 335 | 347 | 443 | 378 | 382 | 345 | 186 | 190 | 163 |
| Sexual Assault | 67 | 60 | 51 | 76 | 62 | 79 | 64 | 62 | 60 |
| Other Crimes against Persons | 369 | 400 | 414 | 398 | 274 | 333 | 319 | 267 | 332 |
| All Other Crimes | 595 | 651 | 761 | 786 | 714 | 642 | 659 | 708 | 634 |
| White-collar Crime | 111 | 135 | 125 | 108 | 112 | 121 | 122 | 96 | 107 |
| Murder | 5 | 8 | 5 | 7 | 7 | 9 | 11 | 12 | 6 |
| Robbery | 96 | 126 | 119 | 114 | 98 | 118 | 134 | 118 | 129 |
| Aggravated Assault | 182 | 215 | 204 | 175 | 205 | 188 | 295 | 302 | 348 |
| Arson | 14 | 13 | 9 | 11 | 11 | 7 | 12 | 15 | 12 |
| Burglary | 429 | 446 | 425 | 366 | 461 | 419 | 459 | 602 | 509 |
| Larceny | 1,229 | 1,111 | 1,104 | 1,110 | 1,176 | 1,219 | 1,184 | 1,229 | 1,311 |
| Theft from Motor Vehicle | 493 | 597 | 541 | 601 | 707 | 719 | 852 | 1,337 | 1,382 |
| Auto Theft | 329 | 363 | 371 | 499 | 505 | 591 | 893 | 1,454 | 1,876 |
| Total | 5,041 | 5,305 | 5,452 | 5,391 | 5,364 | 5,436 | 5,951 | 7,435 | 8,047 |
The number of incidents by neighborhood in District 8 is shown in Table 31. Central Park, Montbello and Northeast Park Hill are where the greatest number of incidents consistently occur.
| Table 31 – Number of Incidents by Neighborhood, District 8 | |||||||||
| 2014 | 2015 | 2016 | 2017 | 2018 | 2019 | 2020 | 2021 | 2022 | |
| Central Park | 2,026 | 2,112 | 2,187 | 2,261 | 2,377 | 2,606 | 2,622 | 3,499 | 4,029 |
| Montbello | 1,025 | 1,010 | 1,074 | 974 | 912 | 933 | 965 | 1,056 | 1,154 |
| Northeast Park Hill | 734 | 818 | 856 | 829 | 856 | 835 | 1,111 | 1,373 | 1,450 |
| North Park Hill | 419 | 438 | 448 | 375 | 386 | 399 | 389 | 487 | 428 |
| Skyland | 108 | 133 | 108 | 110 | 75 | 72 | 114 | 121 | 120 |
| South Park Hill | 405 | 500 | 416 | 451 | 424 | 360 | 463 | 559 | 533 |
| East Colfax | 325 | 294 | 363 | 391 | 334 | 232 | 288 | 340 | 334 |
| Total District 8 | 5,041 | 5,305 | 5,452 | 5,391 | 5,364 | 5,436 | 5,951 | 7,435 | 8,047 |
Crime in City Council District 9
City Council District 9 consists of the following neighborhoods: Central Business District (CBD), City Park, City Park West, Clayton, Cole, Elyria Swansea, Five Points, Union Station, Whittier, Auraria, Globeville, Northeast Park Hill, and Skyland. The number of incidents by category for the district from 2014 – 2022 are shown in Table 32.
- Incidents of crime have increased 39.4% from 11,468 in 2018 to 15,987 in 2022.
- Five Points has the largest share (29.7%) of crime incidents among District 9 neighborhoods.
- From 2018 to 2022, larceny accounts for the largest share of crime incidents, 16.6%, followed closely by public disorder, 15.5% and theft from a motor vehicle, 13.2%.
Figure 16 – Incidents of Crime in Denver’s City Council District 9
| Table 32 – Change in Total Crime Rates in Denver Council District 9 | |||||
| 2014 | 2018 | 2022 | 2014-2018 | 2018-2022 | |
| Public Disorder | 33.29 | 26.02 | 38.32 | -21.8% | 47.3% |
| Drug/Alcohol | 32.92 | 20.09 | 18.96 | -39.0% | -5.7% |
| Sexual Assault | 2.48 | 2.54 | 2.59 | 2.4% | 2.0% |
| Other Crimes against Persons | 16.04 | 12.66 | 15.57 | -21.0% | 23.0% |
| All Other Crimes | 47.76 | 34.26 | 33.60 | -28.3% | -1.9% |
| White-collar Crime | 2.43 | 2.86 | 1.99 | 17.7% | -30.5% |
| Murder | 0.07 | 0.24 | 0.30 | 242.2% | 25.6% |
| Robbery | 4.57 | 4.03 | 4.06 | -12.0% | 0.8% |
| Aggravated Assault | 7.38 | 8.36 | 13.06 | 13.2% | 56.2% |
| Arson | 0.26 | 0.27 | 0.52 | 5.8% | 90.2% |
| Burglary | 10.07 | 8.67 | 12.13 | -13.9% | 39.8% |
| Larceny | 35.91 | 34.17 | 33.19 | -4.8% | -2.9% |
| Theft from Motor Vehicle | 13.36 | 17.15 | 37.35 | 28.3% | 117.9% |
| Auto Theft | 7.73 | 10.13 | 34.66 | 31.0% | 242.3% |
| Total | 214.30 | 181.46 | 246.31 | -15.3% | 35.7% |
| Table 33 – District 9, Number of Incidents | |||||||||
| 2014 | 2015 | 2016 | 2017 | 2018 | 2019 | 2020 | 2021 | 2022 | |
| Public Disorder | 1,942 | 1,869 | 1,889 | 1,934 | 1,644 | 1,862 | 2,069 | 2,325 | 2,487 |
| Drug/Alcohol | 1,921 | 2,107 | 1,918 | 1,525 | 1,270 | 1,132 | 549 | 661 | 1,230 |
| Sexual Assault | 145 | 176 | 194 | 209 | 161 | 176 | 133 | 144 | 168 |
| Other Crimes against Persons | 936 | 1,029 | 1,121 | 1,107 | 800 | 1,021 | 774 | 843 | 1,011 |
| All Other Crimes | 2,787 | 2,856 | 2,798 | 2,829 | 2,165 | 2,480 | 2,036 | 2,025 | 2,181 |
| White-collar Crime | 142 | 204 | 187 | 203 | 181 | 214 | 167 | 148 | 129 |
| Murder | 4 | 12 | 13 | 13 | 15 | 16 | 15 | 14 | 20 |
| Robbery | 267 | 268 | 284 | 269 | 255 | 263 | 252 | 300 | 263 |
| Aggravated Assault | 431 | 536 | 566 | 544 | 528 | 596 | 736 | 804 | 848 |
| Arson | 15 | 16 | 23 | 22 | 17 | 18 | 40 | 54 | 34 |
| Burglary | 588 | 622 | 734 | 630 | 548 | 676 | 941 | 1,047 | 787 |
| Larceny | 2,095 | 2,043 | 2,224 | 2,172 | 2,160 | 2,643 | 2,167 | 2,401 | 2,155 |
| Theft from Motor Vehicle | 780 | 885 | 990 | 1,294 | 1,084 | 1,293 | 1,616 | 2,117 | 2,425 |
| Auto Theft | 451 | 635 | 734 | 720 | 640 | 709 | 1,082 | 1,762 | 2,250 |
| Total | 12,503 | 13,257 | 13,674 | 13,471 | 11,468 | 13,098 | 12,577 | 14,644 | 15,987 |
The number of incidents by neighborhood in District 9 is shown in Table 34. Five Points, Union Station and CBD are where the greatest number of incidents consistently occur.
| Table 34 – Number of Incidents by Neighborhood, District 9 | |||||||||
| 2014 | 2015 | 2016 | 2017 | 2018 | 2019 | 2020 | 2021 | 2022 | |
| CBD | 3,428 | 3,114 | 2,960 | 2,692 | 2,176 | 2,670 | 2,287 | 2,727 | 2,773 |
| City Park | 307 | 290 | 292 | 330 | 328 | 338 | 331 | 355 | 401 |
| City Park West | 828 | 788 | 910 | 924 | 873 | 867 | 869 | 876 | 1,070 |
| Clayton | 439 | 475 | 474 | 505 | 390 | 422 | 462 | 452 | 544 |
| Cole | 650 | 611 | 504 | 497 | 439 | 409 | 427 | 474 | 463 |
| Elyria Swansea | 638 | 830 | 856 | 765 | 634 | 650 | 865 | 979 | 1,014 |
| Five Points | 3,154 | 3,733 | 4,185 | 4,199 | 3,457 | 3,969 | 3,776 | 4,223 | 4,549 |
| Union Station | 1,485 | 1,602 | 1,794 | 1,797 | 1,549 | 2,144 | 1,879 | 2,625 | 2,946 |
| Whittier | 450 | 402 | 405 | 429 | 296 | 372 | 431 | 434 | 482 |
| Auraria | 390 | 666 | 557 | 527 | 546 | 523 | 342 | 504 | 558 |
| Globeville | 545 | 522 | 534 | 603 | 610 | 570 | 671 | 721 | 906 |
| Northeast Park Hill | 82 | 91 | 95 | 92 | 95 | 93 | 123 | 153 | 161 |
| Skyland | 108 | 133 | 108 | 110 | 75 | 72 | 114 | 121 | 120 |
| Total District 9 | 12,503 | 13,257 | 13,674 | 13,471 | 11,468 | 13,098 | 12,577 | 14,644 | 15,987 |
Crime in City Council District 10
City Council District 10 consists of the following neighborhoods: Capitol Hill, Cheeseman Park, Civic Center, Congress Park, Country Club, North Capitol Hill, Belcaro, Cherry Creek, Hale, Hilltop, and Speer. The number of incidents by category for the district from 2014 – 2022 are shown in Table 35.
- Incidents of crime have increased 8.2% from 7,739 in 2018 to 8,375 in 2022.
- Civic Center has the largest share (24.5%) of crime incidents among District 10 neighborhoods.
- From 2018 to 2022, public disorder accounts for the largest share of crime incidents, 15.3%, followed closely by theft from a motor vehicle, 15.1% and larceny, 13.2%.
Figure 17 – Incidents of Crime in Denver’s City Council District 10
| Table 35 – Change in Total Crime Rates in Denver Council District 10 | |||||
| 2014 | 2018 | 2022 | 2014-2018 | 2018-2022 | |
| Public Disorder | 18.01 | 13.39 | 21.30 | -25.7% | 59.1% |
| Drug/Alcohol | 21.85 | 22.61 | 10.32 | 3.5% | -54.3% |
| Sexual Assault | 1.39 | 1.68 | 1.57 | 20.8% | -6.6% |
| Other Crimes against Persons | 9.17 | 6.76 | 8.80 | -26.2% | 30.2% |
| All Other Crimes | 24.95 | 30.72 | 14.61 | 23.2% | -52.4% |
| White-collar Crime | 1.44 | 2.02 | 1.50 | 40.1% | -25.8% |
| Murder | 0.00 | 0.03 | 0.06 | n/a | 94.7% |
| Robbery | 2.50 | 2.02 | 2.09 | -19.3% | 3.7% |
| Aggravated Assault | 2.77 | 4.29 | 5.62 | 55.0% | 31.1% |
| Arson | 0.21 | 0.15 | 0.45 | -26.5% | 191.6% |
| Burglary | 5.85 | 6.00 | 8.05 | 2.6% | 34.1% |
| Larceny | 16.26 | 16.45 | 15.80 | 1.2% | -4.0% |
| Theft from Motor Vehicle | 7.95 | 11.39 | 21.85 | 43.4% | 91.8% |
| Auto Theft | 4.72 | 5.75 | 17.87 | 21.8% | 210.6% |
| Total | 117.06 | 123.28 | 129.90 | 5.3% | 5.4% |
| Table 36 – District 10, Number of Incidents | |||||||||
| 2014 | 2015 | 2016 | 2017 | 2018 | 2019 | 2020 | 2021 | 2022 | |
| Public Disorder | 1,044 | 999 | 1,154 | 1,142 | 840 | 862 | 1,411 | 1,294 | 1,373 |
| Drug/Alcohol | 1,266 | 1,373 | 1,276 | 1,266 | 1,420 | 1,061 | 473 | 567 | 666 |
| Sexual Assault | 81 | 99 | 95 | 123 | 106 | 113 | 92 | 119 | 101 |
| Other Crimes against Persons | 531 | 542 | 644 | 682 | 425 | 555 | 511 | 451 | 567 |
| All Other Crimes | 1,446 | 1,450 | 1,629 | 1,669 | 1,929 | 1,710 | 1,490 | 970 | 942 |
| White-collar Crime | 84 | 124 | 111 | 120 | 127 | 113 | 105 | 92 | 97 |
| Murder | 0 | 3 | 6 | 6 | 2 | 2 | 3 | 8 | 4 |
| Robbery | 145 | 157 | 128 | 123 | 127 | 130 | 128 | 148 | 135 |
| Aggravated Assault | 160 | 193 | 207 | 217 | 269 | 280 | 361 | 356 | 363 |
| Arson | 12 | 4 | 3 | 4 | 10 | 12 | 28 | 17 | 29 |
| Burglary | 339 | 350 | 373 | 434 | 377 | 488 | 662 | 593 | 519 |
| Larceny | 942 | 963 | 976 | 991 | 1,033 | 1,084 | 1,200 | 956 | 1,018 |
| Theft from Motor Vehicle | 461 | 555 | 581 | 773 | 715 | 828 | 1,227 | 1,403 | 1,409 |
| Auto Theft | 274 | 398 | 344 | 423 | 361 | 410 | 661 | 957 | 1,152 |
| Total | 6,784 | 7,208 | 7,528 | 7,974 | 7,739 | 7,647 | 8,353 | 7,933 | 8,375 |
The number of incidents by neighborhood in District 10 is shown in Table 37.
| Table 37 – Number of Incidents by Neighborhood, District 10 | |||||||||
| 2014 | 2015 | 2016 | 2017 | 2018 | 2019 | 2020 | 2021 | 2022 | |
| Capitol Hill | 2,101 | 2,266 | 2,234 | 2,545 | 2,421 | 2,250 | 2,848 | 2,596 | 2,753 |
| Cheeseman Park | 1,059 | 1,038 | 977 | 870 | 939 | 996 | 931 | 845 | 894 |
| Civic Center | 1,343 | 1,467 | 1,842 | 2,031 | 2,084 | 1,931 | 1,735 | 1,438 | 1,504 |
| Congress Park | 463 | 499 | 469 | 592 | 555 | 569 | 652 | 816 | 777 |
| Country Club | 141 | 127 | 142 | 119 | 113 | 132 | 153 | 215 | 147 |
| North Capitol Hill | 1,228 | 1,343 | 1,393 | 1,321 | 1,133 | 1,264 | 1,410 | 1,315 | 1,558 |
| Belcaro | 105 | 123 | 99 | 114 | 115 | 138 | 165 | 164 | 173 |
| Cherry Creek | 28 | 37 | 34 | 34 | 29 | 36 | 33 | 35 | 44 |
| Hale | 37 | 39 | 43 | 45 | 42 | 43 | 56 | 74 | 79 |
| Hilltop | 28 | 33 | 27 | 25 | 28 | 32 | 39 | 47 | 46 |
| Speer | 251 | 236 | 269 | 278 | 281 | 255 | 331 | 388 | 400 |
| Total District 7 | 6,784 | 7,208 | 7,528 | 7,974 | 7,739 | 7,647 | 8,353 | 7,933 | 8,375 |
Crime in City Council District 11
City Council District 11 consists of the following neighborhoods: DIA, Gateway Green Valley Ranch, and Montbello. The number of incidents by category for the district from 2014 – 2022 are shown in Table 38.
- Incidents of crime have increased 97% from 3,439 in 2018 to 6,777 in 2022.
- DIA has the largest share (51.1%) of crime incidents among District 11 neighborhoods.
- From 2018 to 2022, auto theft accounts for the largest share of crime incidents, 25.4%, followed closely by theft from a motor vehicle, 15.3% and public disorder, 14%.
Figure 18 – Incidents of Crime in Denver’s City Council District 11
| Table 38 – Change in Total Crime Rates in Denver Council District 11 | |||||
| 2014 | 2018 | 2022 | 2014-2018 | 2018-2022 | |
| Public Disorder | 10.49 | 7.61 | 13.65 | -27.4% | 79.4% |
| Drug/Alcohol | 1.39 | 2.10 | 0.93 | 50.8% | -55.9% |
| Sexual Assault | 0.62 | 0.94 | 0.84 | 51.4% | -10.5% |
| Other Crimes against Persons | 4.82 | 3.19 | 4.20 | -33.9% | 31.8% |
| All Other Crimes | 6.91 | 7.16 | 8.36 | 3.7% | 16.7% |
| White-collar Crime | 1.78 | 2.96 | 1.67 | 66.3% | -43.4% |
| Murder | 0.03 | 0.05 | 0.12 | 38.5% | 159.7% |
| Robbery | 1.01 | 0.97 | 1.22 | -4.7% | 25.7% |
| Aggravated Assault | 1.95 | 2.29 | 4.68 | 17.7% | 104.1% |
| Arson | 0.12 | 0.11 | 0.16 | -13.8% | 53.0% |
| Burglary | 3.61 | 2.39 | 3.39 | -33.8% | 41.7% |
| Larceny | 7.44 | 6.71 | 12.63 | -9.8% | 88.1% |
| Theft from Motor Vehicle | 6.33 | 6.77 | 16.76 | 6.9% | 147.8% |
| Auto Theft | 2.79 | 9.11 | 31.83 | 226.0% | 249.5% |
| Total | 49.31 | 52.34 | 100.43 | 6.2% | 91.9% |
| Table 39 – District 11 Number of Incidents | |||||||||
| 2014 | 2015 | 2016 | 2017 | 2018 | 2019 | 2020 | 2021 | 2022 | |
| Public Disorder | 636 | 615 | 701 | 533 | 500 | 522 | 596 | 764 | 921 |
| Drug/Alcohol | 85 | 107 | 117 | 131 | 138 | 139 | 132 | 111 | 63 |
| Sexual Assault | 38 | 44 | 48 | 57 | 62 | 47 | 64 | 45 | 57 |
| Other Crimes against Persons | 293 | 306 | 294 | 304 | 210 | 240 | 215 | 204 | 284 |
| All Other Crimes | 419 | 392 | 462 | 545 | 471 | 542 | 566 | 542 | 564 |
| White-collar Crime | 108 | 90 | 103 | 159 | 195 | 188 | 190 | 132 | 113 |
| Murder | 2 | 4 | 6 | 3 | 3 | 3 | 7 | 8 | 8 |
| Robbery | 62 | 73 | 61 | 63 | 64 | 78 | 54 | 71 | 82 |
| Aggravated Assault | 118 | 113 | 145 | 113 | 151 | 173 | 222 | 232 | 316 |
| Arson | 8 | 7 | 6 | 6 | 7 | 6 | 7 | 6 | 11 |
| Burglary | 219 | 207 | 195 | 168 | 157 | 189 | 181 | 222 | 229 |
| Larceny | 452 | 416 | 431 | 407 | 441 | 484 | 490 | 669 | 852 |
| Theft from Motor Vehicle | 384 | 372 | 471 | 389 | 445 | 475 | 541 | 919 | 1,131 |
| Auto Theft | 170 | 249 | 347 | 473 | 599 | 594 | 839 | 1,505 | 2,148 |
| Total | 2,991 | 2,989 | 3,384 | 3,348 | 3,439 | 3,678 | 4,102 | 5,428 | 6,777 |
The number of incidents by neighborhood in District 11 is shown in Table 40.
| Table 40 – Number of Incidents by Neighborhood, District 11 | |||||||||
| 2014 | 2015 | 2016 | 2017 | 2018 | 2019 | 2020 | 2021 | 2022 | |
| DIA | 598 | 683 | 882 | 1,067 | 1,140 | 1,227 | 1,395 | 2,365 | 3,399 |
| Gateway Green Valley Ranch | 1,368 | 1,296 | 1,428 | 1,307 | 1,387 | 1,518 | 1,742 | 2,007 | 2,224 |
| Montbello | 1,025 | 1,010 | 1,074 | 974 | 912 | 933 | 965 | 1,056 | 1,154 |
| Total District 11 | 2,991 | 2,989 | 3,384 | 3,348 | 3,439 | 3,678 | 4,102 | 5,428 | 6,777 |
Number of Incidents in Denver Neighborhoods Ranked
There are 78 neighborhoods in Denver. Table 41 shows the number of incidents in 2014, 2018, and 2022 ranks them relative to all 78 neighborhoods. The top five neighborhoods with the greatest number of incidents are highlighted in orange. In 2014, the Central Business District was ranked first (highest number of incidents) and in 2018 and 2022, Five Points held the number one ranking for the greatest number of incidents.
| Table 41 – Numbers of Crimes by Neighborhood and Rank | |||||||
| Denver Neighborhood | District Number | 2014 | Rank | 2018 | Rank | 2022 | Rank |
| Athmar Park | 7 | 923 | 18 | 714 | 28 | 785 | 35 |
| Auraria | 1, 9 | 433 | 53 | 607 | 33 | 620 | 45 |
| Baker | 7 | 1,389 | 10 | 1,037 | 16 | 1,388 | 17 |
| Barnum | 3, 7 | 611 | 33 | 531 | 39 | 552 | 50 |
| Barnum West | 3 | 360 | 62 | 361 | 62 | 375 | 69 |
| Ber Valley | 2 | 474 | 46 | 461 | 47 | 551 | 51 |
| Belcaro | 5, 6, 10 | 210 | 73 | 229 | 73 | 345 | 72 |
| Berkeley | 1 | 603 | 35 | 544 | 38 | 669 | 42 |
| Capitol Hill | 10 | 2,101 | 3 | 2,421 | 2 | 2,753 | 6 |
| Central Business District | 9 | 3,428 | 1 | 2,176 | 4 | 2,773 | 5 |
| Central Park | 8 | 2,026 | 5 | 2,377 | 3 | 4,029 | 2 |
| Chaffee Park | 1 | 312 | 66 | 332 | 63 | 331 | 73 |
| Cheesman Park | 10 | 1,059 | 15 | 939 | 19 | 894 | 28 |
| Cherry Creek | 5, 10 | 557 | 38 | 577 | 35 | 881 | 30 |
| City Park | 9 | 307 | 67 | 328 | 65 | 401 | 68 |
| City Park West | 9 | 828 | 22 | 873 | 21 | 1,070 | 22 |
| Civic Center | 10 | 1,343 | 12 | 2,084 | 5 | 1,504 | 15 |
| Clayton | 9 | 439 | 52 | 390 | 59 | 544 | 54 |
| Cole | 9 | 650 | 29 | 439 | 52 | 463 | 62 |
| College View – South Platte | 7 | 989 | 16 | 776 | 25 | 806 | 32 |
| Congress-park | 10 | 463 | 49 | 555 | 37 | 777 | 37 |
| Cory Merrill | 6 | 292 | 68 | 257 | 72 | 429 | 65 |
| Country Club | 10 | 141 | 76 | 113 | 76 | 147 | 76 |
| DIA | 11 | 598 | 36 | 1,140 | 13 | 3,399 | 3 |
| East Colfax | 5, 8 | 1,627 | 6 | 1,671 | 7 | 1,670 | 11 |
| Elyria-Swansea | 9 | 638 | 31 | 634 | 32 | 1,014 | 23 |
| Five Points | 9 | 3,154 | 2 | 3,457 | 1 | 4,549 | 1 |
| Fort Logan | 2 | 252 | 71 | 366 | 61 | 375 | 69 |
| Gateway – Green Valley Ranch | 11 | 1,368 | 11 | 1,387 | 10 | 2,224 | 8 |
| Globeville | 1, 9 | 605 | 34 | 678 | 30 | 1,007 | 24 |
| Goldsmith | 4 | 407 | 56 | 445 | 50 | 724 | 40 |
| Hale | 5, 10 | 372 | 59 | 420 | 54 | 793 | 33 |
| Hampden | 4 | 942 | 17 | 1,047 | 15 | 1,823 | 9 |
| Hampden South | 4 | 598 | 36 | 730 | 26 | 1,427 | 16 |
| Harvey Park | 2 | 645 | 30 | 692 | 29 | 664 | 43 |
| Harvey Park South | 2 | 621 | 32 | 523 | 41 | 546 | 53 |
| Highland | 1 | 874 | 19 | 964 | 17 | 1,275 | 20 |
| Hilltop | 5, 10 | 278 | 69 | 282 | 70 | 462 | 63 |
| Indian Creek | 6 | 67 | 78 | 76 | 77 | 135 | 77 |
| Jefferson Park | 1 | 365 | 60 | 446 | 49 | 515 | 58 |
| Kennedy | 4 | 257 | 70 | 312 | 66 | 593 | 47 |
| Lincoln Park | 3 | 1,564 | 7 | 1,519 | 9 | 1,645 | 12 |
| Lowry Field | 5 | 531 | 39 | 410 | 56 | 967 | 26 |
| Mar Lee | 2, 3, 7 | 758 | 26 | 850 | 23 | 785 | 35 |
| Marston | 2 | 349 | 64 | 415 | 55 | 498 | 59 |
| Montbello | 8, 11 | 2,049 | 4 | 1,824 | 6 | 2,307 | 7 |
| Montclair | 5 | 454 | 50 | 396 | 58 | 534 | 55 |
| North Capitol Hill | 10 | 1,228 | 13 | 1,133 | 14 | 1,558 | 14 |
| Northeast Park Hill | 8, 9 | 815 | 24 | 951 | 18 | 1,611 | 13 |
| North Park Hill | 8 | 419 | 55 | 386 | 60 | 428 | 66 |
| Overland | 7 | 503 | 41 | 503 | 42 | 604 | 46 |
| Platt-park | 7 | 397 | 58 | 409 | 57 | 523 | 57 |
| Regis | 1 | 350 | 63 | 294 | 69 | 351 | 71 |
| Rosedale | 6, 7 | 210 | 73 | 182 | 74 | 193 | 75 |
| Ruby Hill | 2, 3, 7 | 758 | 26 | 665 | 31 | 786 | 34 |
| Skyland | 8, 9 | 216 | 72 | 149 | 75 | 239 | 74 |
| Sloan’s Lake | 1 | 468 | 47 | 478 | 44 | 587 | 48 |
| Southmoor Park | 4 | 198 | 75 | 281 | 71 | 496 | 60 |
| South Park Hill | 8 | 405 | 57 | 424 | 53 | 533 | 56 |
| Speer | 7, 10 | 837 | 21 | 935 | 20 | 1,333 | 19 |
| Sunnyside | 1 | 824 | 23 | 729 | 27 | 886 | 29 |
| Sun-valley | 1, 3, 7 | 493 | 43 | 461 | 47 | 460 | 64 |
| Union Station | 9 | 1,485 | 8 | 1,549 | 8 | 2,946 | 4 |
| University | 6, 7 | 465 | 48 | 465 | 46 | 569 | 49 |
| University Hills | 4 | 479 | 45 | 569 | 36 | 678 | 41 |
| University Park | 6 | 348 | 65 | 476 | 45 | 737 | 39 |
| Valverde | 3, 7 | 505 | 40 | 440 | 51 | 550 | 52 |
| Villa Park | 3 | 814 | 25 | 862 | 22 | 968 | 25 |
| Virginia Village | 6 | 696 | 28 | 603 | 34 | 962 | 27 |
| Washington Park | 6 | 361 | 61 | 297 | 67 | 416 | 67 |
| Washington Park West | 7 | 429 | 54 | 331 | 64 | 628 | 44 |
| Washington Virginia Vale | 5, 6 | 853 | 20 | 847 | 24 | 1,135 | 21 |
| Wellshire | 4 | 69 | 77 | 75 | 78 | 71 | 78 |
| West Colfax | 1, 3 | 1,169 | 14 | 1,329 | 11 | 1,792 | 10 |
| West Highland | 1 | 500 | 42 | 527 | 40 | 746 | 38 |
| Westwood | 3 | 1,459 | 9 | 1,199 | 12 | 1,361 | 18 |
| Whittier | 9 | 450 | 51 | 296 | 68 | 482 | 61 |
| Windsor | 5, 6 | 485 | 44 | 498 | 43 | 852 | 31 |
Who Are the Victims of Crime in Denver?
As shown in Figure 19, black people in Denver are the victims of crime at much higher rate relative to their share of the population. White people constitute 76% of the population and victims of 71% of crimes. Black people constitute 11% of the population but victims of 20% of crimes.
Figure 19 – Crime Victims as a Percent of Population by Race
Conclusion
The crime data presented at the city council level offers a unique perspective into recent crime trends across Colorado’s largest city. The information in this report is intended to help voters and elected officials better understand the key areas of concern, so as to better focus policy and resource discussions.
Appendix A: Incidents by Type and Neighborhood District 1
| Table A1 – Auraria, District 1 – Number of Incidents | |||||||||
| 2014 | 2015 | 2016 | 2017 | 2018 | 2019 | 2020 | 2021 | 2022 | |
| Public Disorder | 5 | 7 | 8 | 10 | 9 | 9 | 7 | 6 | 9 |
| Drug/Alcohol | 3 | 8 | 7 | 4 | 4 | 3 | 2 | 3 | 2 |
| Sexual Assault | 1 | 1 | 1 | 1 | 1 | 1 | 0 | 0 | 1 |
| Other Crimes against Persons | 2 | 3 | 3 | 5 | 4 | 4 | 1 | 4 | 5 |
| All Other Crimes | 7 | 27 | 21 | 19 | 22 | 21 | 19 | 24 | 24 |
| White-collar Crime | 1 | 1 | 0 | 1 | 1 | 1 | 0 | 1 | 1 |
| Murder | 0 | 0 | 0 | 0 | 0 | 0 | 0 | 0 | 0 |
| Robbery | 1 | 1 | 0 | 1 | 1 | 1 | 0 | 0 | 0 |
| Aggravated Assault | 0 | 0 | 1 | 1 | 1 | 1 | 1 | 1 | 2 |
| Arson | 0 | 0 | 0 | 0 | 0 | 0 | 0 | 0 | 0 |
| Burglary | 2 | 1 | 2 | 2 | 2 | 3 | 2 | 1 | 2 |
| Larceny | 16 | 18 | 14 | 11 | 13 | 9 | 4 | 8 | 7 |
| Theft from Motor Vehicle | 4 | 5 | 3 | 3 | 2 | 4 | 2 | 4 | 5 |
| Auto Theft | 2 | 2 | 2 | 2 | 1 | 2 | 1 | 3 | 6 |
| Total | 43 | 74 | 62 | 59 | 61 | 58 | 38 | 56 | 62 |
| Source: Denver Police Department | |||||||||
| Table A2 – Berkeley, District 1 – Number of Incidents | |||||||||
| 2014 | 2015 | 2016 | 2017 | 2018 | 2019 | 2020 | 2021 | 2022 | |
| Public Disorder | 118 | 87 | 101 | 99 | 72 | 51 | 74 | 84 | 88 |
| Drug/Alcohol | 40 | 47 | 23 | 41 | 44 | 24 | 22 | 14 | 2 |
| Sexual Assault | 4 | 4 | 3 | 11 | 8 | 7 | 3 | 5 | 5 |
| Other Crimes against Persons | 37 | 28 | 39 | 46 | 28 | 29 | 13 | 15 | 28 |
| All Other Crimes | 87 | 84 | 76 | 78 | 60 | 37 | 43 | 35 | 42 |
| White-collar Crime | 11 | 14 | 13 | 13 | 8 | 7 | 5 | 3 | 8 |
| Murder | 0 | 0 | 0 | 0 | 0 | 1 | 1 | 0 | 1 |
| Robbery | 10 | 8 | 14 | 7 | 9 | 15 | 10 | 5 | 11 |
| Aggravated Assault | 15 | 12 | 10 | 13 | 17 | 12 | 14 | 16 | 18 |
| Arson | 0 | 0 | 2 | 0 | 0 | 0 | 0 | 0 | 1 |
| Burglary | 76 | 73 | 71 | 71 | 59 | 56 | 102 | 67 | 47 |
| Larceny | 75 | 54 | 72 | 122 | 83 | 83 | 92 | 117 | 130 |
| Theft from Motor Vehicle | 82 | 88 | 77 | 70 | 99 | 102 | 145 | 176 | 174 |
| Auto Theft | 48 | 53 | 54 | 60 | 57 | 53 | 84 | 97 | 114 |
| Total | 603 | 552 | 555 | 631 | 544 | 477 | 608 | 634 | 669 |
| Source: Denver Police Department | |||||||||
| Table A3 – Chaffee-Park, District 1 – Number of Incidents | |||||||||
| 2014 | 2015 | 2016 | 2017 | 2018 | 2019 | 2020 | 2021 | 2022 | |
| Public Disorder | 72 | 55 | 44 | 33 | 63 | 33 | 53 | 36 | 46 |
| Drug/Alcohol | 30 | 28 | 34 | 51 | 27 | 33 | 10 | 21 | 18 |
| Sexual Assault | 0 | 3 | 3 | 3 | 4 | 3 | 1 | 1 | 1 |
| Other Crimes against Persons | 28 | 20 | 25 | 28 | 14 | 12 | 9 | 16 | 13 |
| All Other Crimes | 39 | 51 | 46 | 43 | 32 | 18 | 23 | 24 | 26 |
| White-collar Crime | 4 | 6 | 13 | 9 | 5 | 3 | 4 | 2 | 10 |
| Murder | 0 | 0 | 0 | 0 | 0 | 0 | 1 | 0 | 0 |
| Robbery | 10 | 8 | 6 | 12 | 10 | 10 | 20 | 9 | 9 |
| Aggravated Assault | 7 | 10 | 9 | 9 | 13 | 12 | 8 | 21 | 12 |
| Arson | 1 | 1 | 1 | 0 | 0 | 2 | 1 | 1 | 1 |
| Burglary | 35 | 27 | 35 | 18 | 16 | 13 | 21 | 24 | 47 |
| Larceny | 39 | 36 | 24 | 44 | 49 | 33 | 56 | 36 | 22 |
| Theft from Motor Vehicle | 27 | 22 | 22 | 30 | 54 | 42 | 70 | 74 | 65 |
| Auto Theft | 20 | 23 | 41 | 45 | 45 | 30 | 59 | 80 | 61 |
| Total | 312 | 290 | 303 | 325 | 332 | 244 | 336 | 345 | 331 |
| Source: Denver Police Department | |||||||||
| Table A4 – Globeville, District 1 – Number of Incidents | |||||||||
| 2014 | 2015 | 2016 | 2017 | 2018 | 2019 | 2020 | 2021 | 2022 | |
| Public Disorder | 12 | 9 | 9 | 9 | 10 | 8 | 10 | 12 | 16 |
| Drug/Alcohol | 8 | 6 | 7 | 7 | 7 | 12 | 6 | 2 | 4 |
| Sexual Assault | 2 | 2 | 1 | 1 | 1 | 1 | 1 | 1 | 1 |
| Other Crimes against Persons | 3 | 4 | 5 | 4 | 3 | 2 | 4 | 3 | 6 |
| All Other Crimes | 10 | 13 | 12 | 19 | 12 | 9 | 12 | 7 | 12 |
| White-collar Crime | 1 | 1 | 1 | 1 | 2 | 2 | 2 | 1 | 1 |
| Murder | 0 | 0 | 0 | 0 | 0 | 0 | 0 | 0 | 0 |
| Robbery | 1 | 1 | 1 | 1 | 1 | 1 | 1 | 2 | 2 |
| Aggravated Assault | 2 | 2 | 1 | 3 | 3 | 4 | 5 | 6 | 7 |
| Arson | 0 | 0 | 0 | 0 | 0 | 0 | 0 | 1 | 1 |
| Burglary | 6 | 5 | 3 | 3 | 5 | 5 | 5 | 5 | 6 |
| Larceny | 6 | 4 | 7 | 5 | 7 | 6 | 8 | 7 | 9 |
| Theft from Motor Vehicle | 5 | 6 | 5 | 7 | 10 | 7 | 9 | 15 | 16 |
| Auto Theft | 5 | 6 | 6 | 7 | 7 | 7 | 13 | 18 | 20 |
| Total | 61 | 58 | 59 | 67 | 68 | 63 | 75 | 80 | 101 |
| Source: Denver Police Department | |||||||||
| Table A5 – Highland, District 1 – Number of Incidents | |||||||||
| 2014 | 2015 | 2016 | 2017 | 2018 | 2019 | 2020 | 2021 | 2022 | |
| Public Disorder | 166 | 149 | 157 | 177 | 137 | 108 | 132 | 200 | 206 |
| Drug/Alcohol | 76 | 68 | 63 | 44 | 27 | 27 | 17 | 14 | 17 |
| Sexual Assault | 11 | 12 | 6 | 12 | 18 | 12 | 7 | 11 | 6 |
| Other Crimes against Persons | 41 | 44 | 74 | 53 | 42 | 57 | 30 | 34 | 49 |
| All Other Crimes | 120 | 95 | 145 | 144 | 119 | 89 | 66 | 59 | 68 |
| White-collar Crime | 8 | 18 | 17 | 19 | 15 | 20 | 16 | 12 | 7 |
| Murder | 0 | 0 | 0 | 0 | 0 | 0 | 1 | 1 | 1 |
| Robbery | 10 | 15 | 9 | 21 | 21 | 15 | 12 | 12 | 15 |
| Aggravated Assault | 19 | 20 | 22 | 34 | 13 | 28 | 32 | 27 | 47 |
| Arson | 2 | 2 | 3 | 1 | 0 | 1 | 0 | 3 | 0 |
| Burglary | 87 | 126 | 115 | 109 | 102 | 94 | 175 | 147 | 120 |
| Larceny | 139 | 148 | 207 | 165 | 177 | 182 | 230 | 235 | 199 |
| Theft from Motor Vehicle | 104 | 97 | 121 | 170 | 189 | 180 | 289 | 348 | 304 |
| Auto Theft | 91 | 72 | 108 | 100 | 104 | 90 | 127 | 218 | 236 |
| Total | 874 | 866 | 1,047 | 1,049 | 964 | 903 | 1,134 | 1,321 | 1,275 |
| Source: Denver Police Department | |||||||||
| Table A6 – Jefferson Park, District 1 – Number of Incidents | |||||||||
| 2014 | 2015 | 2016 | 2017 | 2018 | 2019 | 2020 | 2021 | 2022 | |
| Public Disorder | 72 | 50 | 64 | 60 | 50 | 62 | 77 | 83 | 84 |
| Drug/Alcohol | 26 | 26 | 33 | 30 | 50 | 38 | 11 | 12 | 4 |
| Sexual Assault | 3 | 4 | 1 | 6 | 8 | 6 | 3 | 7 | 2 |
| Other Crimes against Persons | 19 | 17 | 11 | 24 | 15 | 21 | 8 | 16 | 13 |
| All Other Crimes | 58 | 31 | 49 | 57 | 51 | 29 | 32 | 50 | 21 |
| White-collar Crime | 7 | 5 | 10 | 15 | 9 | 12 | 2 | 3 | 5 |
| Murder | 0 | 0 | 0 | 0 | 0 | 1 | 0 | 1 | 0 |
| Robbery | 5 | 9 | 5 | 5 | 9 | 2 | 4 | 9 | 7 |
| Aggravated Assault | 8 | 11 | 12 | 15 | 9 | 12 | 10 | 20 | 16 |
| Arson | 1 | 1 | 0 | 0 | 2 | 1 | 1 | 0 | 1 |
| Burglary | 29 | 32 | 33 | 36 | 48 | 40 | 59 | 57 | 33 |
| Larceny | 73 | 76 | 83 | 83 | 80 | 83 | 87 | 93 | 108 |
| Theft from Motor Vehicle | 40 | 44 | 48 | 62 | 68 | 78 | 115 | 137 | 117 |
| Auto Theft | 24 | 42 | 37 | 52 | 47 | 51 | 52 | 113 | 104 |
| Total | 365 | 348 | 386 | 445 | 446 | 436 | 461 | 601 | 515 |
| Source: Denver Police Department | |||||||||
| Table A7 – Regis, District 1 – Number of Incidents | |||||||||
| 2014 | 2015 | 2016 | 2017 | 2018 | 2019 | 2020 | 2021 | 2022 | |
| Public Disorder | 49 | 52 | 38 | 37 | 38 | 28 | 53 | 56 | 50 |
| Drug/Alcohol | 59 | 64 | 25 | 35 | 26 | 26 | 22 | 24 | 10 |
| Sexual Assault | 5 | 2 | 4 | 8 | 6 | 4 | 6 | 3 | 8 |
| Other Crimes against Persons | 23 | 26 | 16 | 16 | 12 | 11 | 13 | 19 | 21 |
| All Other Crimes | 56 | 47 | 50 | 46 | 22 | 33 | 19 | 24 | 31 |
| White-collar Crime | 9 | 6 | 4 | 7 | 7 | 7 | 9 | 3 | 3 |
| Murder | 0 | 1 | 0 | 0 | 0 | 0 | 0 | 0 | 0 |
| Robbery | 8 | 8 | 4 | 2 | 1 | 1 | 5 | 11 | 1 |
| Aggravated Assault | 7 | 3 | 7 | 9 | 11 | 12 | 13 | 8 | 18 |
| Arson | 0 | 0 | 0 | 2 | 3 | 0 | 0 | 1 | 0 |
| Burglary | 36 | 36 | 60 | 32 | 27 | 30 | 34 | 21 | 30 |
| Larceny | 33 | 43 | 33 | 37 | 34 | 37 | 52 | 35 | 32 |
| Theft from Motor Vehicle | 41 | 30 | 31 | 30 | 64 | 54 | 72 | 89 | 71 |
| Auto Theft | 24 | 34 | 38 | 48 | 43 | 41 | 57 | 82 | 76 |
| Total | 350 | 352 | 310 | 309 | 294 | 284 | 355 | 376 | 351 |
| Source: Denver Police Department | |||||||||
| Table A8 – Sloan Lake, District 1 – Number of Incidents | |||||||||
| 2014 | 2015 | 2016 | 2017 | 2018 | 2019 | 2020 | 2021 | 2022 | |
| Public Disorder | 100 | 105 | 85 | 95 | 88 | 69 | 74 | 105 | 93 |
| Drug/Alcohol | 27 | 14 | 14 | 26 | 18 | 18 | 3 | 16 | 6 |
| Sexual Assault | 4 | 2 | 4 | 9 | 4 | 3 | 3 | 4 | 3 |
| Other Crimes against Persons | 31 | 30 | 25 | 30 | 25 | 17 | 17 | 16 | 25 |
| All Other Crimes | 58 | 43 | 40 | 47 | 38 | 32 | 47 | 43 | 26 |
| White-collar Crime | 9 | 19 | 6 | 7 | 4 | 2 | 3 | 8 | 5 |
| Murder | 0 | 1 | 0 | 0 | 1 | 0 | 0 | 0 | 0 |
| Robbery | 9 | 7 | 9 | 2 | 7 | 6 | 4 | 16 | 13 |
| Aggravated Assault | 13 | 8 | 10 | 21 | 13 | 18 | 18 | 19 | 27 |
| Arson | 1 | 1 | 1 | 0 | 3 | 0 | 0 | 1 | 0 |
| Burglary | 61 | 87 | 71 | 83 | 84 | 59 | 75 | 74 | 63 |
| Larceny | 81 | 79 | 79 | 79 | 39 | 52 | 85 | 76 | 85 |
| Theft from Motor Vehicle | 44 | 105 | 85 | 93 | 97 | 87 | 108 | 142 | 137 |
| Auto Theft | 30 | 54 | 59 | 79 | 57 | 64 | 60 | 107 | 104 |
| Total | 468 | 555 | 488 | 571 | 478 | 427 | 497 | 627 | 587 |
| Source: Denver Police Department | |||||||||
| Table A9 – Sunny Side, District 1 – Number of Incidents | |||||||||
| 2014 | 2015 | 2016 | 2017 | 2018 | 2019 | 2020 | 2021 | 2022 | |
| Public Disorder | 203 | 162 | 144 | 145 | 141 | 97 | 126 | 109 | 161 |
| Drug/Alcohol | 57 | 60 | 58 | 49 | 39 | 30 | 22 | 22 | 24 |
| Sexual Assault | 6 | 9 | 12 | 10 | 7 | 9 | 1 | 5 | 7 |
| Other Crimes against Persons | 64 | 54 | 70 | 82 | 51 | 31 | 25 | 20 | 46 |
| All Other Crimes | 117 | 118 | 90 | 114 | 84 | 64 | 59 | 60 | 74 |
| White-collar Crime | 18 | 15 | 14 | 12 | 13 | 12 | 14 | 18 | 25 |
| Murder | 0 | 0 | 1 | 2 | 1 | 0 | 0 | 0 | 1 |
| Robbery | 9 | 16 | 14 | 15 | 19 | 19 | 16 | 21 | 17 |
| Aggravated Assault | 39 | 33 | 31 | 26 | 28 | 32 | 29 | 29 | 52 |
| Arson | 3 | 2 | 3 | 2 | 2 | 0 | 0 | 4 | 1 |
| Burglary | 70 | 80 | 55 | 63 | 67 | 66 | 75 | 77 | 79 |
| Larceny | 67 | 57 | 74 | 109 | 95 | 61 | 73 | 113 | 96 |
| Theft from Motor Vehicle | 85 | 62 | 76 | 84 | 105 | 141 | 125 | 168 | 163 |
| Auto Theft | 86 | 71 | 102 | 73 | 77 | 83 | 123 | 158 | 140 |
| Total | 824 | 739 | 744 | 786 | 729 | 645 | 688 | 804 | 886 |
| Source: Denver Police Department | |||||||||
| Table A10 – Sun Valley, District 1 – Number of Incidents | |||||||||
| 2014 | 2015 | 2016 | 2017 | 2018 | 2019 | 2020 | 2021 | 2022 | |
| Public Disorder | 12 | 13 | 10 | 9 | 6 | 7 | 6 | 6 | 8 |
| Drug/Alcohol | 3 | 3 | 8 | 9 | 8 | 5 | 2 | 2 | 2 |
| Sexual Assault | 1 | 1 | 1 | 1 | 1 | 0 | 1 | 0 | 0 |
| Other Crimes against Persons | 7 | 9 | 6 | 7 | 3 | 2 | 3 | 3 | 4 |
| All Other Crimes | 9 | 11 | 15 | 11 | 11 | 8 | 7 | 9 | 7 |
| White-collar Crime | 0 | 1 | 1 | 0 | 1 | 0 | 0 | 0 | 0 |
| Murder | 0 | 0 | 0 | 0 | 0 | 0 | 0 | 0 | 0 |
| Robbery | 1 | 1 | 1 | 2 | 1 | 2 | 2 | 1 | 1 |
| Aggravated Assault | 3 | 3 | 2 | 4 | 4 | 2 | 2 | 2 | 4 |
| Arson | 0 | 0 | 0 | 0 | 0 | 0 | 0 | 0 | 0 |
| Burglary | 1 | 2 | 3 | 2 | 1 | 1 | 3 | 3 | 3 |
| Larceny | 6 | 5 | 7 | 5 | 5 | 7 | 3 | 4 | 5 |
| Theft from Motor Vehicle | 3 | 3 | 4 | 2 | 2 | 2 | 3 | 4 | 5 |
| Auto Theft | 3 | 2 | 4 | 3 | 3 | 3 | 2 | 4 | 7 |
| Total | 49 | 55 | 61 | 54 | 46 | 39 | 35 | 38 | 46 |
| Source: Denver Police Department | |||||||||
| Table A11 – West Colfax, District 1 – Number of Incidents | |||||||||
| 2014 | 2015 | 2016 | 2017 | 2018 | 2019 | 2020 | 2021 | 2022 | |
| Public Disorder | 101 | 106 | 107 | 117 | 77 | 86 | 92 | 92 | 114 |
| Drug/Alcohol | 53 | 52 | 36 | 67 | 73 | 50 | 16 | 17 | 35 |
| Sexual Assault | 4 | 4 | 9 | 8 | 10 | 12 | 5 | 7 | 5 |
| Other Crimes against Persons | 49 | 48 | 47 | 58 | 32 | 30 | 40 | 37 | 39 |
| All Other Crimes | 81 | 81 | 92 | 106 | 85 | 68 | 84 | 73 | 85 |
| White-collar Crime | 6 | 6 | 5 | 8 | 8 | 4 | 5 | 6 | 4 |
| Murder | 1 | 0 | 0 | 1 | 1 | 1 | 2 | 0 | 2 |
| Robbery | 7 | 12 | 13 | 14 | 8 | 12 | 12 | 12 | 12 |
| Aggravated Assault | 15 | 19 | 30 | 30 | 25 | 26 | 27 | 31 | 43 |
| Arson | 2 | 3 | 1 | 4 | 1 | 1 | 1 | 2 | 4 |
| Burglary | 37 | 32 | 30 | 37 | 46 | 34 | 39 | 41 | 53 |
| Larceny | 44 | 49 | 47 | 65 | 66 | 64 | 80 | 78 | 88 |
| Theft from Motor Vehicle | 32 | 35 | 42 | 45 | 58 | 59 | 74 | 105 | 113 |
| Auto Theft | 34 | 40 | 47 | 43 | 42 | 42 | 64 | 102 | 119 |
| Total | 468 | 488 | 507 | 602 | 532 | 488 | 540 | 602 | 717 |
| Source: Denver Police Department | |||||||||
| Table A12 – West Highland, District 1 – Number of Incidents | |||||||||
| 2014 | 2015 | 2016 | 2017 | 2018 | 2019 | 2020 | 2021 | 2022 | |
| Public Disorder | 93 | 91 | 101 | 100 | 53 | 71 | 74 | 89 | 108 |
| Drug/Alcohol | 27 | 18 | 23 | 18 | 28 | 16 | 7 | 9 | 6 |
| Sexual Assault | 2 | 7 | 2 | 5 | 9 | 7 | 2 | 4 | 3 |
| Other Crimes against Persons | 21 | 33 | 39 | 21 | 26 | 19 | 24 | 15 | 21 |
| All Other Crimes | 30 | 37 | 34 | 45 | 31 | 41 | 18 | 23 | 28 |
| White-collar Crime | 8 | 11 | 13 | 21 | 13 | 12 | 6 | 7 | 9 |
| Murder | 0 | 0 | 0 | 0 | 0 | 1 | 0 | 0 | 1 |
| Robbery | 8 | 10 | 11 | 10 | 10 | 7 | 3 | 9 | 13 |
| Aggravated Assault | 11 | 8 | 12 | 11 | 10 | 12 | 6 | 10 | 12 |
| Arson | 2 | 1 | 1 | 0 | 0 | 0 | 0 | 1 | 2 |
| Burglary | 78 | 80 | 78 | 75 | 83 | 60 | 84 | 79 | 69 |
| Larceny | 91 | 90 | 82 | 93 | 94 | 88 | 166 | 146 | 113 |
| Theft from Motor Vehicle | 80 | 116 | 99 | 91 | 119 | 101 | 184 | 223 | 225 |
| Auto Theft | 49 | 61 | 62 | 63 | 51 | 64 | 87 | 127 | 136 |
| Total | 500 | 563 | 557 | 553 | 527 | 499 | 661 | 742 | 746 |
| Source: Denver Police Department | |||||||||
Appendix B: Incidents by Type and Neighborhood District 2
| Table B1 – Bear Valley, District 2 – Number of Incidents | |||||||||
| 2014 | 2015 | 2016 | 2017 | 2018 | 2019 | 2020 | 2021 | 2022 | |
| Public Disorder | 118 | 108 | 104 | 116 | 64 | 66 | 82 | 97 | 103 |
| Drug/Alcohol | 37 | 26 | 28 | 25 | 40 | 21 | 6 | 7 | 10 |
| Sexual Assault | 7 | 4 | 4 | 9 | 10 | 7 | 5 | 1 | 5 |
| Other Crimes against Persons | 38 | 33 | 56 | 64 | 20 | 26 | 28 | 31 | 36 |
| All Other Crimes | 39 | 45 | 48 | 85 | 48 | 41 | 37 | 33 | 43 |
| White-collar Crime | 10 | 12 | 8 | 7 | 9 | 18 | 13 | 7 | 8 |
| Murder | 0 | 0 | 1 | 0 | 0 | 1 | 0 | 0 | 1 |
| Robbery | 8 | 2 | 2 | 8 | 9 | 7 | 7 | 5 | 8 |
| Aggravated Assault | 16 | 12 | 17 | 13 | 25 | 17 | 10 | 17 | 28 |
| Arson | 2 | 5 | 1 | 1 | 0 | 0 | 2 | 1 | 1 |
| Burglary | 37 | 38 | 31 | 44 | 35 | 34 | 40 | 23 | 40 |
| Larceny | 39 | 50 | 54 | 41 | 35 | 32 | 39 | 38 | 46 |
| Theft from Motor Vehicle | 56 | 91 | 89 | 110 | 88 | 73 | 90 | 109 | 99 |
| Auto Theft | 67 | 59 | 87 | 97 | 78 | 53 | 100 | 122 | 123 |
| Total | 474 | 485 | 530 | 620 | 461 | 396 | 459 | 491 | 551 |
| Source: Denver Police Department | |||||||||
| Table B2 – Fort Logan, District 2 – Number of Incidents | |||||||||
| 2014 | 2015 | 2016 | 2017 | 2018 | 2019 | 2020 | 2021 | 2022 | |
| Public Disorder | 64 | 88 | 66 | 57 | 68 | 67 | 43 | 40 | 66 |
| Drug/Alcohol | 1 | 13 | 6 | 4 | 8 | 5 | 8 | 1 | 4 |
| Sexual Assault | 4 | 6 | 3 | 2 | 4 | 6 | 7 | 2 | 5 |
| Other Crimes against Persons | 30 | 27 | 27 | 45 | 15 | 22 | 21 | 20 | 27 |
| All Other Crimes | 22 | 60 | 14 | 43 | 22 | 36 | 30 | 39 | 34 |
| White-collar Crime | 7 | 5 | 6 | 6 | 4 | 4 | 6 | 6 | 11 |
| Murder | 0 | 1 | 0 | 1 | 0 | 0 | 0 | 0 | 0 |
| Robbery | 0 | 4 | 5 | 2 | 0 | 5 | 3 | 1 | 3 |
| Aggravated Assault | 4 | 14 | 11 | 9 | 15 | 18 | 15 | 27 | 21 |
| Arson | 0 | 0 | 1 | 2 | 1 | 0 | 0 | 1 | 0 |
| Burglary | 31 | 23 | 32 | 48 | 40 | 31 | 23 | 24 | 28 |
| Larceny | 29 | 21 | 41 | 35 | 23 | 25 | 19 | 27 | 36 |
| Theft from Motor Vehicle | 42 | 41 | 59 | 75 | 126 | 93 | 85 | 82 | 77 |
| Auto Theft | 18 | 39 | 42 | 58 | 40 | 55 | 47 | 66 | 63 |
| Total | 252 | 342 | 313 | 387 | 366 | 367 | 307 | 336 | 375 |
| Source: Denver Police Department | |||||||||
| Table B3 – Harvey Park, District 2 – Number of Incidents | |||||||||
| 2014 | 2015 | 2016 | 2017 | 2018 | 2019 | 2020 | 2021 | 2022 | |
| Public Disorder | 29 | 30 | 34 | 34 | 24 | 16 | 26 | 20 | 23 |
| Drug/Alcohol | 8 | 7 | 9 | 9 | 12 | 13 | 6 | 3 | 3 |
| Sexual Assault | 2 | 2 | 2 | 2 | 3 | 2 | 1 | 2 | 2 |
| Other Crimes against Persons | 11 | 18 | 14 | 11 | 7 | 8 | 8 | 6 | 12 |
| All Other Crimes | 13 | 16 | 17 | 21 | 17 | 17 | 22 | 15 | 14 |
| White-collar Crime | 3 | 3 | 3 | 4 | 2 | 3 | 4 | 2 | 1 |
| Murder | 0 | 0 | 0 | 0 | 0 | 0 | 0 | 0 | 0 |
| Robbery | 3 | 4 | 2 | 3 | 3 | 4 | 3 | 3 | 1 |
| Aggravated Assault | 6 | 5 | 6 | 7 | 9 | 6 | 13 | 8 | 12 |
| Arson | 0 | 0 | 1 | 1 | 0 | 0 | 0 | 1 | 1 |
| Burglary | 11 | 11 | 11 | 10 | 7 | 6 | 10 | 11 | 9 |
| Larceny | 16 | 14 | 12 | 13 | 11 | 16 | 19 | 13 | 13 |
| Theft from Motor Vehicle | 13 | 16 | 25 | 22 | 26 | 18 | 18 | 25 | 21 |
| Auto Theft | 13 | 13 | 14 | 18 | 17 | 11 | 17 | 23 | 21 |
| Total | 129 | 140 | 149 | 155 | 138 | 121 | 147 | 131 | 133 |
| Source: Denver Police Department | |||||||||
| Table B4 – Harvey Park South, District 2 – Number of Incidents | |||||||||
| 2014 | 2015 | 2016 | 2017 | 2018 | 2019 | 2020 | 2021 | 2022 | |
| Public Disorder | 133 | 117 | 79 | 105 | 72 | 72 | 55 | 94 | 97 |
| Drug/Alcohol | 52 | 36 | 23 | 16 | 24 | 38 | 24 | 7 | 13 |
| Sexual Assault | 6 | 7 | 8 | 14 | 10 | 8 | 7 | 6 | 10 |
| Other Crimes against Persons | 58 | 31 | 34 | 33 | 33 | 34 | 32 | 37 | 41 |
| All Other Crimes | 45 | 81 | 47 | 45 | 63 | 44 | 61 | 56 | 55 |
| White-collar Crime | 13 | 17 | 12 | 13 | 16 | 11 | 17 | 15 | 10 |
| Murder | 0 | 2 | 0 | 2 | 0 | 0 | 0 | 3 | 1 |
| Robbery | 11 | 9 | 15 | 10 | 15 | 12 | 11 | 9 | 3 |
| Aggravated Assault | 21 | 20 | 15 | 22 | 16 | 20 | 23 | 32 | 27 |
| Arson | 2 | 2 | 1 | 2 | 0 | 1 | 2 | 2 | 0 |
| Burglary | 33 | 49 | 32 | 41 | 26 | 26 | 48 | 48 | 54 |
| Larceny | 119 | 98 | 104 | 83 | 81 | 90 | 79 | 81 | 78 |
| Theft from Motor Vehicle | 63 | 73 | 88 | 98 | 101 | 69 | 71 | 86 | 79 |
| Auto Theft | 65 | 57 | 64 | 87 | 66 | 60 | 86 | 96 | 78 |
| Total | 621 | 599 | 522 | 571 | 523 | 485 | 516 | 572 | 546 |
| Source: Denver Police Department | |||||||||
| Table B5 – Mar Lee, District 2 – Number of Incidents | |||||||||
| 2014 | 2015 | 2016 | 2017 | 2018 | 2019 | 2020 | 2021 | 2022 | |
| Public Disorder | 45 | 43 | 44 | 42 | 36 | 36 | 41 | 29 | 45 |
| Drug/Alcohol | 21 | 15 | 19 | 17 | 27 | 24 | 11 | 5 | 6 |
| Sexual Assault | 1 | 2 | 4 | 4 | 6 | 4 | 4 | 3 | 2 |
| Other Crimes against Persons | 20 | 21 | 21 | 23 | 14 | 18 | 17 | 14 | 17 |
| All Other Crimes | 33 | 27 | 27 | 41 | 47 | 44 | 34 | 34 | 35 |
| White-collar Crime | 10 | 4 | 5 | 7 | 5 | 3 | 6 | 3 | 3 |
| Murder | 0 | 0 | 1 | 1 | 0 | 1 | 1 | 0 | 1 |
| Robbery | 4 | 7 | 5 | 7 | 7 | 5 | 5 | 4 | 7 |
| Aggravated Assault | 10 | 11 | 15 | 12 | 16 | 15 | 15 | 14 | 17 |
| Arson | 1 | 1 | 1 | 1 | 1 | 0 | 1 | 0 | 0 |
| Burglary | 20 | 21 | 20 | 17 | 15 | 16 | 16 | 10 | 14 |
| Larceny | 25 | 27 | 23 | 24 | 21 | 22 | 19 | 20 | 18 |
| Theft from Motor Vehicle | 20 | 24 | 34 | 25 | 30 | 25 | 33 | 41 | 33 |
| Auto Theft | 17 | 28 | 32 | 45 | 31 | 20 | 35 | 38 | 39 |
| Total | 227 | 230 | 251 | 266 | 255 | 232 | 238 | 215 | 236 |
| Source: Denver Police Department | |||||||||
| Table B6 – Marston, District 2 – Number of Incidents | |||||||||
| 2014 | 2015 | 2016 | 2017 | 2018 | 2019 | 2020 | 2021 | 2022 | |
| Public Disorder | 69 | 75 | 85 | 80 | 47 | 87 | 55 | 76 | 81 |
| Drug/Alcohol | 4 | 15 | 11 | 12 | 12 | 8 | 2 | 1 | 5 |
| Sexual Assault | 3 | 3 | 3 | 4 | 5 | 6 | 10 | 4 | 9 |
| Other Crimes against Persons | 24 | 26 | 37 | 59 | 17 | 18 | 21 | 16 | 27 |
| All Other Crimes | 24 | 23 | 32 | 132 | 22 | 30 | 49 | 26 | 24 |
| White-collar Crime | 11 | 18 | 14 | 8 | 15 | 17 | 18 | 17 | 12 |
| Murder | 0 | 0 | 0 | 0 | 0 | 0 | 0 | 0 | 2 |
| Robbery | 2 | 7 | 3 | 5 | 1 | 11 | 12 | 5 | 14 |
| Aggravated Assault | 4 | 4 | 14 | 7 | 11 | 14 | 11 | 9 | 17 |
| Arson | 1 | 1 | 0 | 0 | 0 | 0 | 2 | 1 | 1 |
| Burglary | 26 | 30 | 35 | 20 | 32 | 34 | 27 | 28 | 28 |
| Larceny | 120 | 145 | 95 | 85 | 86 | 112 | 127 | 80 | 57 |
| Theft from Motor Vehicle | 34 | 66 | 75 | 110 | 114 | 61 | 87 | 107 | 112 |
| Auto Theft | 27 | 41 | 43 | 61 | 53 | 44 | 66 | 112 | 109 |
| Total | 349 | 454 | 447 | 583 | 415 | 442 | 487 | 482 | 498 |
| Source: Denver Police Department | |||||||||
| Table B7 – Ruby Hill, District 2 – Number of Incidents | |||||||||
| 2014 | 2015 | 2016 | 2017 | 2018 | 2019 | 2020 | 2021 | 2022 | |
| Public Disorder | 9 | 7 | 7 | 6 | 5 | 4 | 6 | 6 | 6 |
| Drug/Alcohol | 3 | 2 | 3 | 3 | 3 | 4 | 2 | 1 | 2 |
| Sexual Assault | 0 | 0 | 1 | 0 | 1 | 1 | 1 | 0 | 1 |
| Other Crimes against Persons | 3 | 3 | 3 | 3 | 2 | 2 | 2 | 3 | 3 |
| All Other Crimes | 6 | 5 | 5 | 5 | 4 | 5 | 6 | 3 | 6 |
| White-collar Crime | 1 | 1 | 1 | 1 | 1 | 1 | 1 | 1 | 1 |
| Murder | 0 | 0 | 0 | 0 | 0 | 0 | 0 | 0 | 0 |
| Robbery | 1 | 1 | 1 | 1 | 1 | 1 | 1 | 1 | 1 |
| Aggravated Assault | 2 | 2 | 2 | 1 | 2 | 2 | 3 | 3 | 3 |
| Arson | 0 | 0 | 0 | 0 | 0 | 0 | 0 | 0 | 0 |
| Burglary | 3 | 3 | 4 | 3 | 3 | 2 | 3 | 3 | 4 |
| Larceny | 3 | 2 | 2 | 3 | 2 | 3 | 3 | 3 | 3 |
| Theft from Motor Vehicle | 2 | 4 | 6 | 6 | 5 | 5 | 5 | 6 | 5 |
| Auto Theft | 5 | 5 | 5 | 5 | 5 | 4 | 6 | 7 | 7 |
| Total | 38 | 36 | 39 | 37 | 33 | 32 | 36 | 37 | 39 |
| Source: Denver Police Department | |||||||||
Appendix C: Incidents by Type and Neighborhood District 3
| Table C1 – Barnum, District 3 – Number of Incidents | |||||||||
| 2014 | 2015 | 2016 | 2017 | 2018 | 2019 | 2020 | 2021 | 2022 | |
| Public Disorder | 128 | 111 | 116 | 99 | 83 | 76 | 53 | 68 | 67 |
| Drug/Alcohol | 36 | 49 | 55 | 50 | 58 | 40 | 37 | 21 | 35 |
| Sexual Assault | 2 | 13 | 10 | 8 | 7 | 8 | 5 | 6 | 0 |
| Other Crimes against Persons | 49 | 42 | 50 | 44 | 23 | 32 | 19 | 22 | 21 |
| All Other Crimes | 99 | 106 | 99 | 154 | 99 | 84 | 105 | 104 | 136 |
| White-collar Crime | 10 | 11 | 6 | 10 | 7 | 10 | 12 | 8 | 5 |
| Murder | 1 | 1 | 2 | 0 | 1 | 1 | 1 | 1 | 2 |
| Robbery | 14 | 16 | 11 | 13 | 17 | 15 | 12 | 7 | 5 |
| Aggravated Assault | 18 | 32 | 25 | 30 | 22 | 28 | 33 | 32 | 41 |
| Arson | 0 | 4 | 4 | 2 | 4 | 2 | 5 | 3 | 4 |
| Burglary | 39 | 60 | 44 | 48 | 17 | 24 | 41 | 31 | 31 |
| Larceny | 39 | 32 | 25 | 35 | 26 | 27 | 33 | 18 | 34 |
| Theft from Motor Vehicle | 50 | 55 | 46 | 62 | 59 | 46 | 56 | 63 | 52 |
| Auto Theft | 67 | 71 | 58 | 51 | 57 | 34 | 52 | 70 | 65 |
| Total | 550 | 602 | 551 | 606 | 478 | 426 | 464 | 455 | 497 |
| Source: Denver Police Department | |||||||||
| Table C2 – Barnum West, District 3 – Number of Incidents | |||||||||
| 2014 | 2015 | 2016 | 2017 | 2018 | 2019 | 2020 | 2021 | 2022 | |
| Public Disorder | 79 | 54 | 70 | 56 | 29 | 54 | 38 | 42 | 58 |
| Drug/Alcohol | 56 | 41 | 49 | 53 | 52 | 37 | 26 | 16 | 12 |
| Sexual Assault | 4 | 3 | 5 | 7 | 0 | 4 | 3 | 2 | 4 |
| Other Crimes against Persons | 25 | 23 | 28 | 28 | 20 | 15 | 13 | 11 | 23 |
| All Other Crimes | 48 | 37 | 46 | 84 | 67 | 59 | 74 | 81 | 100 |
| White-collar Crime | 5 | 4 | 8 | 5 | 2 | 4 | 4 | 5 | 10 |
| Murder | 0 | 1 | 0 | 0 | 1 | 1 | 0 | 2 | 0 |
| Robbery | 5 | 6 | 6 | 6 | 7 | 2 | 3 | 5 | 3 |
| Aggravated Assault | 13 | 17 | 11 | 13 | 17 | 11 | 22 | 22 | 20 |
| Arson | 0 | 2 | 0 | 1 | 2 | 2 | 0 | 0 | 1 |
| Burglary | 27 | 53 | 25 | 33 | 32 | 14 | 14 | 26 | 20 |
| Larceny | 22 | 22 | 20 | 31 | 25 | 8 | 19 | 21 | 25 |
| Theft from Motor Vehicle | 33 | 49 | 62 | 59 | 52 | 38 | 45 | 63 | 46 |
| Auto Theft | 43 | 58 | 66 | 56 | 55 | 40 | 43 | 79 | 53 |
| Total | 360 | 370 | 396 | 432 | 361 | 289 | 304 | 375 | 375 |
| Source: Denver Police Department | |||||||||
| Table C3 – Lincoln Park, District 3 – Number of Incidents | |||||||||
| 2014 | 2015 | 2016 | 2017 | 2018 | 2019 | 2020 | 2021 | 2022 | |
| Public Disorder | 268 | 244 | 305 | 255 | 259 | 209 | 259 | 288 | 299 |
| Drug/Alcohol | 251 | 222 | 285 | 139 | 150 | 72 | 44 | 32 | 34 |
| Sexual Assault | 23 | 23 | 28 | 38 | 33 | 35 | 25 | 23 | 25 |
| Other Crimes against Persons | 141 | 152 | 194 | 216 | 126 | 160 | 144 | 140 | 127 |
| All Other Crimes | 379 | 383 | 384 | 315 | 346 | 235 | 228 | 194 | 162 |
| White-collar Crime | 26 | 25 | 27 | 22 | 16 | 19 | 17 | 10 | 18 |
| Murder | 1 | 0 | 0 | 0 | 2 | 2 | 2 | 2 | 1 |
| Robbery | 17 | 22 | 26 | 22 | 38 | 18 | 24 | 28 | 28 |
| Aggravated Assault | 32 | 38 | 68 | 56 | 85 | 71 | 80 | 85 | 85 |
| Arson | 1 | 5 | 3 | 1 | 6 | 4 | 2 | 12 | 7 |
| Burglary | 56 | 61 | 79 | 51 | 55 | 61 | 69 | 107 | 113 |
| Larceny | 235 | 221 | 200 | 172 | 159 | 192 | 247 | 177 | 184 |
| Theft from Motor Vehicle | 85 | 99 | 82 | 93 | 137 | 145 | 206 | 226 | 269 |
| Auto Theft | 49 | 101 | 83 | 91 | 107 | 90 | 155 | 233 | 293 |
| Total | 1,564 | 1,596 | 1,764 | 1,471 | 1,519 | 1,313 | 1,502 | 1,557 | 1,645 |
| Source: Denver Police Department | |||||||||
| Table C4 – Valverde, District 3 – Number of Incidents | |||||||||
| 2014 | 2015 | 2016 | 2017 | 2018 | 2019 | 2020 | 2021 | 2022 | |
| Public Disorder | 11 | 7 | 7 | 7 | 6 | 5 | 6 | 7 | 9 |
| Drug/Alcohol | 4 | 5 | 4 | 3 | 4 | 4 | 3 | 3 | 4 |
| Sexual Assault | 1 | 1 | 0 | 0 | 0 | 1 | 1 | 0 | 0 |
| Other Crimes against Persons | 4 | 4 | 3 | 3 | 2 | 2 | 2 | 2 | 2 |
| All Other Crimes | 7 | 6 | 7 | 8 | 6 | 5 | 6 | 8 | 7 |
| White-collar Crime | 0 | 2 | 1 | 1 | 1 | 1 | 1 | 1 | 0 |
| Murder | 0 | 0 | 0 | 0 | 0 | 0 | 0 | 0 | 0 |
| Robbery | 1 | 1 | 1 | 2 | 1 | 1 | 2 | 1 | 1 |
| Aggravated Assault | 3 | 2 | 3 | 3 | 3 | 2 | 3 | 3 | 3 |
| Arson | 0 | 0 | 0 | 0 | 0 | 0 | 0 | 0 | 0 |
| Burglary | 4 | 5 | 5 | 4 | 3 | 4 | 4 | 6 | 7 |
| Larceny | 6 | 4 | 3 | 5 | 4 | 3 | 5 | 3 | 6 |
| Theft from Motor Vehicle | 4 | 5 | 7 | 6 | 6 | 5 | 5 | 9 | 8 |
| Auto Theft | 6 | 7 | 5 | 6 | 8 | 5 | 7 | 8 | 9 |
| Total | 51 | 48 | 45 | 47 | 44 | 38 | 45 | 51 | 55 |
| Source: Denver Police Department | |||||||||
| Table C5 – Ville Park, District 3 – Number of Incidents | |||||||||
| 2014 | 2015 | 2016 | 2017 | 2018 | 2019 | 2020 | 2021 | 2022 | |
| Public Disorder | 150 | 161 | 131 | 106 | 94 | 101 | 115 | 120 | 93 |
| Drug/Alcohol | 72 | 67 | 46 | 95 | 138 | 70 | 43 | 51 | 88 |
| Sexual Assault | 7 | 7 | 15 | 14 | 6 | 9 | 7 | 8 | 9 |
| Other Crimes against Persons | 81 | 85 | 73 | 63 | 33 | 46 | 44 | 52 | 48 |
| All Other Crimes | 101 | 94 | 120 | 214 | 185 | 173 | 176 | 166 | 195 |
| White-collar Crime | 7 | 15 | 11 | 15 | 10 | 6 | 4 | 13 | 6 |
| Murder | 0 | 0 | 0 | 0 | 0 | 0 | 2 | 1 | 4 |
| Robbery | 24 | 27 | 17 | 23 | 23 | 31 | 23 | 25 | 26 |
| Aggravated Assault | 49 | 42 | 32 | 36 | 36 | 34 | 48 | 67 | 55 |
| Arson | 5 | 0 | 3 | 4 | 4 | 3 | 2 | 1 | 3 |
| Burglary | 114 | 97 | 58 | 47 | 64 | 46 | 79 | 61 | 62 |
| Larceny | 60 | 52 | 48 | 61 | 63 | 51 | 86 | 78 | 71 |
| Theft from Motor Vehicle | 62 | 60 | 83 | 53 | 102 | 88 | 102 | 137 | 121 |
| Auto Theft | 82 | 130 | 132 | 102 | 104 | 69 | 95 | 158 | 187 |
| Total | 814 | 837 | 769 | 833 | 862 | 727 | 826 | 938 | 968 |
| Source: Denver Police Department | |||||||||
| Table C6 – Westwood, District 3 – Number of Incidents | |||||||||
| 2014 | 2015 | 2016 | 2017 | 2018 | 2019 | 2020 | 2021 | 2022 | |
| Public Disorder | 312 | 338 | 223 | 236 | 167 | 149 | 144 | 182 | 212 |
| Drug/Alcohol | 134 | 125 | 117 | 110 | 131 | 108 | 55 | 60 | 70 |
| Sexual Assault | 17 | 21 | 18 | 19 | 15 | 23 | 12 | 9 | 17 |
| Other Crimes against Persons | 166 | 143 | 145 | 121 | 77 | 80 | 68 | 98 | 93 |
| All Other Crimes | 254 | 233 | 250 | 312 | 223 | 222 | 261 | 341 | 358 |
| White-collar Crime | 20 | 23 | 10 | 19 | 17 | 18 | 11 | 8 | 13 |
| Murder | 3 | 1 | 3 | 2 | 3 | 1 | 3 | 2 | 0 |
| Robbery | 34 | 46 | 37 | 24 | 31 | 27 | 31 | 30 | 24 |
| Aggravated Assault | 84 | 84 | 86 | 85 | 70 | 85 | 82 | 114 | 111 |
| Arson | 5 | 3 | 2 | 3 | 3 | 5 | 6 | 2 | 6 |
| Burglary | 126 | 112 | 81 | 76 | 75 | 45 | 83 | 79 | 62 |
| Larceny | 76 | 75 | 67 | 86 | 71 | 50 | 69 | 78 | 64 |
| Theft from Motor Vehicle | 91 | 137 | 158 | 129 | 144 | 139 | 160 | 182 | 156 |
| Auto Theft | 137 | 154 | 165 | 124 | 172 | 127 | 146 | 233 | 175 |
| Total | 1,459 | 1,495 | 1,362 | 1,346 | 1,199 | 1,079 | 1,131 | 1,418 | 1,361 |
| Source: Denver Police Department | |||||||||
| Table C7 – Sun Valley, District 3 – Number of Incidents | |||||||||
| 2014 | 2015 | 2016 | 2017 | 2018 | 2019 | 2020 | 2021 | 2022 | |
| Public Disorder | 95 | 103 | 81 | 68 | 50 | 54 | 50 | 47 | 62 |
| Drug/Alcohol | 25 | 23 | 62 | 70 | 63 | 38 | 14 | 14 | 18 |
| Sexual Assault | 6 | 9 | 6 | 4 | 4 | 2 | 4 | 2 | 3 |
| Other Crimes against Persons | 54 | 68 | 48 | 53 | 26 | 19 | 27 | 24 | 30 |
| All Other Crimes | 74 | 90 | 120 | 89 | 84 | 61 | 54 | 70 | 54 |
| White-collar Crime | 3 | 9 | 11 | 3 | 7 | 2 | 2 | 2 | 2 |
| Murder | 2 | 0 | 0 | 0 | 0 | 0 | 2 | 0 | 0 |
| Robbery | 6 | 10 | 9 | 18 | 10 | 12 | 15 | 6 | 8 |
| Aggravated Assault | 22 | 25 | 18 | 29 | 29 | 18 | 18 | 17 | 32 |
| Arson | 0 | 0 | 2 | 1 | 0 | 0 | 0 | 2 | 2 |
| Burglary | 10 | 19 | 21 | 12 | 11 | 8 | 22 | 26 | 21 |
| Larceny | 51 | 42 | 53 | 41 | 42 | 55 | 26 | 30 | 40 |
| Theft from Motor Vehicle | 22 | 25 | 30 | 18 | 19 | 15 | 26 | 30 | 39 |
| Auto Theft | 25 | 17 | 33 | 24 | 24 | 24 | 18 | 34 | 57 |
| Total | 394 | 440 | 491 | 429 | 369 | 310 | 278 | 303 | 368 |
| Source: Denver Police Department | |||||||||
| Table C8 – West Colfax, District 3 – Number of Incidents | |||||||||
| 2014 | 2015 | 2016 | 2017 | 2018 | 2019 | 2020 | 2021 | 2022 | |
| Public Disorder | 152 | 158 | 161 | 176 | 116 | 129 | 137 | 138 | 172 |
| Drug/Alcohol | 80 | 78 | 55 | 101 | 110 | 76 | 23 | 26 | 53 |
| Sexual Assault | 7 | 7 | 14 | 13 | 16 | 17 | 7 | 10 | 7 |
| Other Crimes against Persons | 74 | 72 | 70 | 87 | 47 | 45 | 60 | 56 | 58 |
| All Other Crimes | 121 | 122 | 139 | 159 | 128 | 101 | 126 | 109 | 128 |
| White-collar Crime | 10 | 8 | 7 | 11 | 11 | 6 | 7 | 8 | 6 |
| Murder | 2 | 0 | 1 | 1 | 1 | 2 | 2 | 1 | 3 |
| Robbery | 11 | 19 | 20 | 20 | 13 | 18 | 19 | 19 | 19 |
| Aggravated Assault | 23 | 29 | 44 | 45 | 38 | 38 | 40 | 46 | 64 |
| Arson | 3 | 4 | 1 | 6 | 1 | 1 | 1 | 3 | 6 |
| Burglary | 55 | 48 | 46 | 55 | 68 | 52 | 58 | 61 | 79 |
| Larceny | 65 | 73 | 71 | 97 | 98 | 95 | 121 | 117 | 133 |
| Theft from Motor Vehicle | 49 | 53 | 63 | 67 | 87 | 89 | 111 | 157 | 170 |
| Auto Theft | 51 | 61 | 70 | 65 | 63 | 63 | 96 | 152 | 178 |
| Total | 701 | 731 | 761 | 904 | 797 | 733 | 809 | 904 | 1,075 |
| Source: Denver Police Department | |||||||||
| Table C9 – Mar Lee, District 3 – Number of Incidents | |||||||||
| 2014 | 2015 | 2016 | 2017 | 2018 | 2019 | 2020 | 2021 | 2022 | |
| Public Disorder | 75 | 72 | 74 | 71 | 60 | 60 | 68 | 49 | 75 |
| Drug/Alcohol | 35 | 25 | 31 | 28 | 45 | 40 | 19 | 9 | 10 |
| Sexual Assault | 2 | 4 | 7 | 7 | 11 | 7 | 7 | 5 | 3 |
| Other Crimes against Persons | 34 | 35 | 35 | 39 | 24 | 31 | 29 | 23 | 28 |
| All Other Crimes | 55 | 45 | 46 | 69 | 78 | 74 | 57 | 57 | 58 |
| White-collar Crime | 16 | 7 | 9 | 11 | 9 | 6 | 11 | 5 | 6 |
| Murder | 1 | 0 | 1 | 1 | 0 | 1 | 2 | 0 | 2 |
| Robbery | 7 | 12 | 8 | 12 | 12 | 8 | 9 | 7 | 11 |
| Aggravated Assault | 17 | 19 | 26 | 20 | 26 | 25 | 25 | 23 | 28 |
| Arson | 1 | 1 | 2 | 2 | 2 | 1 | 2 | 1 | 1 |
| Burglary | 34 | 35 | 33 | 29 | 25 | 26 | 27 | 17 | 23 |
| Larceny | 42 | 45 | 39 | 41 | 36 | 36 | 32 | 34 | 31 |
| Theft from Motor Vehicle | 34 | 40 | 57 | 41 | 50 | 42 | 55 | 68 | 55 |
| Auto Theft | 29 | 47 | 54 | 75 | 52 | 34 | 58 | 64 | 65 |
| Total | 379 | 384 | 418 | 443 | 425 | 387 | 397 | 358 | 393 |
| Source: Denver Police Department | |||||||||
| Table C10 – Ruby Hill, District 3 – Number of Incidents | |||||||||
| 2014 | 2015 | 2016 | 2017 | 2018 | 2019 | 2020 | 2021 | 2022 | |
| Public Disorder | 9 | 7 | 7 | 6 | 5 | 4 | 6 | 6 | 6 |
| Drug/Alcohol | 3 | 2 | 3 | 3 | 3 | 4 | 2 | 1 | 2 |
| Sexual Assault | 0 | 0 | 1 | 0 | 1 | 1 | 1 | 0 | 1 |
| Other Crimes against Persons | 3 | 3 | 3 | 3 | 2 | 2 | 2 | 3 | 3 |
| All Other Crimes | 6 | 5 | 5 | 5 | 4 | 5 | 6 | 3 | 6 |
| White-collar Crime | 1 | 1 | 1 | 1 | 1 | 1 | 1 | 1 | 1 |
| Murder | 0 | 0 | 0 | 0 | 0 | 0 | 0 | 0 | 0 |
| Robbery | 1 | 1 | 1 | 1 | 1 | 1 | 1 | 1 | 1 |
| Aggravated Assault | 2 | 2 | 2 | 1 | 2 | 2 | 3 | 3 | 3 |
| Arson | 0 | 0 | 0 | 0 | 0 | 0 | 0 | 0 | 0 |
| Burglary | 3 | 3 | 4 | 3 | 3 | 2 | 3 | 3 | 4 |
| Larceny | 3 | 2 | 2 | 3 | 2 | 3 | 3 | 3 | 3 |
| Theft from Motor Vehicle | 2 | 4 | 6 | 6 | 5 | 5 | 5 | 6 | 5 |
| Auto Theft | 5 | 5 | 5 | 5 | 5 | 4 | 6 | 7 | 7 |
| Total | 38 | 36 | 39 | 37 | 33 | 32 | 36 | 37 | 39 |
| Source: Denver Police Department | |||||||||
Appendix D: Incidents by Type and Neighborhood District 4
| Table D1 – Goldsmith, District 4 – Number of Incidents | |||||||||
| 2014 | 2015 | 2016 | 2017 | 2018 | 2019 | 2020 | 2021 | 2022 | |
| Public Disorder | 77 | 80 | 79 | 91 | 55 | 62 | 75 | 102 | 104 |
| Drug/Alcohol | 8 | 8 | 30 | 89 | 62 | 46 | 12 | 29 | 16 |
| Sexual Assault | 7 | 6 | 5 | 13 | 7 | 5 | 9 | 7 | 5 |
| Other Crimes against Persons | 37 | 51 | 52 | 61 | 19 | 33 | 23 | 37 | 38 |
| All Other Crimes | 49 | 39 | 54 | 53 | 45 | 32 | 24 | 45 | 33 |
| White-collar Crime | 10 | 22 | 18 | 8 | 9 | 12 | 13 | 17 | 14 |
| Murder | 0 | 0 | 0 | 2 | 0 | 1 | 0 | 1 | 0 |
| Robbery | 7 | 10 | 9 | 11 | 6 | 9 | 18 | 13 | 14 |
| Aggravated Assault | 14 | 16 | 21 | 17 | 20 | 18 | 32 | 49 | 41 |
| Arson | 0 | 1 | 0 | 0 | 1 | 0 | 1 | 1 | 1 |
| Burglary | 48 | 33 | 35 | 49 | 28 | 35 | 44 | 56 | 49 |
| Larceny | 65 | 49 | 41 | 51 | 46 | 55 | 61 | 68 | 57 |
| Theft from Motor Vehicle | 56 | 56 | 54 | 57 | 87 | 82 | 100 | 152 | 150 |
| Auto Theft | 29 | 42 | 48 | 84 | 60 | 58 | 126 | 183 | 202 |
| Total | 407 | 413 | 446 | 586 | 445 | 448 | 538 | 760 | 724 |
| Source: Denver Police Department | |||||||||
| Table D2 – Hampden, District 4 – Number of Incidents | |||||||||
| 2014 | 2015 | 2016 | 2017 | 2018 | 2019 | 2020 | 2021 | 2022 | |
| Public Disorder | 203 | 237 | 187 | 186 | 146 | 153 | 246 | 318 | 314 |
| Drug/Alcohol | 20 | 19 | 17 | 39 | 52 | 32 | 12 | 15 | 18 |
| Sexual Assault | 10 | 9 | 11 | 18 | 15 | 19 | 18 | 14 | 13 |
| Other Crimes against Persons | 85 | 103 | 95 | 109 | 60 | 62 | 69 | 62 | 88 |
| All Other Crimes | 64 | 88 | 97 | 102 | 86 | 54 | 72 | 90 | 113 |
| White-collar Crime | 36 | 35 | 34 | 24 | 20 | 36 | 25 | 36 | 40 |
| Murder | 0 | 0 | 1 | 0 | 1 | 1 | 3 | 2 | 2 |
| Robbery | 20 | 14 | 19 | 27 | 26 | 23 | 31 | 47 | 36 |
| Aggravated Assault | 38 | 31 | 41 | 36 | 48 | 37 | 70 | 72 | 90 |
| Arson | 2 | 2 | 4 | 1 | 0 | 1 | 2 | 4 | 2 |
| Burglary | 129 | 133 | 87 | 120 | 103 | 65 | 117 | 100 | 118 |
| Larceny | 132 | 138 | 111 | 123 | 120 | 116 | 142 | 146 | 147 |
| Theft from Motor Vehicle | 129 | 156 | 184 | 227 | 224 | 222 | 299 | 383 | 374 |
| Auto Theft | 74 | 116 | 127 | 176 | 146 | 148 | 329 | 443 | 468 |
| Total | 942 | 1,081 | 1,015 | 1,188 | 1,047 | 969 | 1,435 | 1,732 | 1,823 |
| Source: Denver Police Department | |||||||||
| Table D3 – Hampden South, District 4 – Number of Incidents | |||||||||
| 2014 | 2015 | 2016 | 2017 | 2018 | 2019 | 2020 | 2021 | 2022 | |
| Public Disorder | 85 | 174 | 134 | 98 | 90 | 109 | 145 | 208 | 225 |
| Drug/Alcohol | 21 | 18 | 53 | 52 | 47 | 31 | 30 | 11 | 55 |
| Sexual Assault | 6 | 11 | 8 | 16 | 8 | 9 | 4 | 6 | 8 |
| Other Crimes against Persons | 38 | 73 | 46 | 62 | 32 | 30 | 32 | 28 | 47 |
| All Other Crimes | 74 | 71 | 72 | 49 | 53 | 37 | 37 | 43 | 54 |
| White-collar Crime | 23 | 25 | 29 | 37 | 35 | 25 | 30 | 25 | 36 |
| Murder | 0 | 1 | 0 | 2 | 0 | 0 | 2 | 1 | 0 |
| Robbery | 10 | 7 | 6 | 24 | 18 | 11 | 13 | 14 | 20 |
| Aggravated Assault | 13 | 21 | 17 | 18 | 22 | 23 | 31 | 23 | 43 |
| Arson | 2 | 0 | 1 | 2 | 0 | 5 | 1 | 5 | 0 |
| Burglary | 70 | 93 | 81 | 92 | 70 | 62 | 85 | 95 | 72 |
| Larceny | 104 | 124 | 127 | 113 | 96 | 98 | 149 | 117 | 146 |
| Theft from Motor Vehicle | 101 | 137 | 168 | 167 | 191 | 198 | 251 | 351 | 349 |
| Auto Theft | 51 | 59 | 72 | 119 | 68 | 106 | 195 | 299 | 372 |
| Total | 598 | 814 | 814 | 851 | 730 | 744 | 1,005 | 1,226 | 1,427 |
| Source: Denver Police Department | |||||||||
| Table D4 – Kennedy, District 4 – Number of Incidents | |||||||||
| 2014 | 2015 | 2016 | 2017 | 2018 | 2019 | 2020 | 2021 | 2022 | |
| Public Disorder | 47 | 55 | 60 | 55 | 53 | 51 | 52 | 94 | 106 |
| Drug/Alcohol | 3 | 9 | 9 | 11 | 11 | 11 | 5 | 9 | 20 |
| Sexual Assault | 8 | 7 | 8 | 5 | 10 | 6 | 3 | 4 | 5 |
| Other Crimes against Persons | 24 | 31 | 22 | 47 | 18 | 20 | 21 | 27 | 41 |
| All Other Crimes | 21 | 32 | 26 | 37 | 30 | 22 | 29 | 32 | 42 |
| White-collar Crime | 6 | 5 | 2 | 1 | 2 | 9 | 2 | 6 | 6 |
| Murder | 2 | 1 | 0 | 0 | 1 | 0 | 0 | 2 | 0 |
| Robbery | 4 | 5 | 9 | 8 | 11 | 9 | 8 | 10 | 12 |
| Aggravated Assault | 17 | 17 | 20 | 15 | 19 | 18 | 32 | 35 | 45 |
| Arson | 5 | 0 | 0 | 1 | 2 | 0 | 1 | 3 | 1 |
| Burglary | 40 | 31 | 26 | 33 | 15 | 25 | 37 | 22 | 27 |
| Larceny | 21 | 17 | 21 | 24 | 24 | 25 | 30 | 30 | 30 |
| Theft from Motor Vehicle | 38 | 34 | 52 | 68 | 66 | 102 | 71 | 90 | 87 |
| Auto Theft | 21 | 36 | 47 | 54 | 50 | 58 | 108 | 130 | 171 |
| Total | 257 | 280 | 302 | 359 | 312 | 356 | 399 | 494 | 593 |
| Source: Denver Police Department | |||||||||
| Table D5 – Southmoor Park, District 4 – Number of Incidents | |||||||||
| 2014 | 2015 | 2016 | 2017 | 2018 | 2019 | 2020 | 2021 | 2022 | |
| Public Disorder | 33 | 54 | 47 | 37 | 39 | 39 | 54 | 73 | 87 |
| Drug/Alcohol | 14 | 21 | 10 | 14 | 9 | 6 | 1 | 0 | 3 |
| Sexual Assault | 3 | 1 | 3 | 1 | 3 | 5 | 4 | 4 | 5 |
| Other Crimes against Persons | 12 | 22 | 19 | 19 | 8 | 9 | 10 | 11 | 20 |
| All Other Crimes | 24 | 22 | 15 | 16 | 20 | 15 | 13 | 5 | 28 |
| White-collar Crime | 5 | 5 | 11 | 9 | 6 | 10 | 11 | 2 | 7 |
| Murder | 0 | 0 | 0 | 0 | 0 | 0 | 0 | 0 | 0 |
| Robbery | 0 | 2 | 1 | 2 | 5 | 1 | 2 | 4 | 3 |
| Aggravated Assault | 4 | 5 | 3 | 4 | 8 | 2 | 7 | 14 | 12 |
| Arson | 0 | 0 | 2 | 2 | 0 | 0 | 0 | 0 | 0 |
| Burglary | 36 | 29 | 37 | 55 | 21 | 37 | 26 | 28 | 21 |
| Larceny | 28 | 33 | 38 | 41 | 33 | 36 | 37 | 35 | 54 |
| Theft from Motor Vehicle | 27 | 39 | 40 | 84 | 88 | 114 | 150 | 115 | 140 |
| Auto Theft | 12 | 13 | 15 | 33 | 41 | 39 | 87 | 124 | 116 |
| Total | 198 | 246 | 241 | 317 | 281 | 313 | 402 | 415 | 496 |
| Source: Denver Police Department | |||||||||
| Table D6 – University Hills, District 4 – Number of Incidents | |||||||||
| 2014 | 2015 | 2016 | 2017 | 2018 | 2019 | 2020 | 2021 | 2022 | |
| Public Disorder | 89 | 98 | 121 | 59 | 55 | 45 | 65 | 81 | 93 |
| Drug/Alcohol | 31 | 45 | 46 | 30 | 55 | 33 | 13 | 7 | 77 |
| Sexual Assault | 5 | 4 | 2 | 4 | 8 | 7 | 2 | 3 | 4 |
| Other Crimes against Persons | 28 | 22 | 23 | 26 | 12 | 16 | 14 | 19 | 21 |
| All Other Crimes | 76 | 73 | 94 | 62 | 35 | 30 | 21 | 19 | 30 |
| White-collar Crime | 15 | 12 | 13 | 12 | 14 | 11 | 11 | 14 | 18 |
| Murder | 0 | 1 | 0 | 0 | 1 | 0 | 0 | 0 | 0 |
| Robbery | 8 | 8 | 10 | 9 | 8 | 13 | 6 | 9 | 11 |
| Aggravated Assault | 9 | 17 | 19 | 10 | 11 | 15 | 8 | 13 | 12 |
| Arson | 0 | 0 | 1 | 0 | 0 | 1 | 0 | 0 | 0 |
| Burglary | 55 | 60 | 50 | 49 | 47 | 38 | 52 | 40 | 48 |
| Larceny | 94 | 92 | 102 | 108 | 163 | 139 | 92 | 108 | 126 |
| Theft from Motor Vehicle | 40 | 72 | 76 | 68 | 113 | 65 | 93 | 118 | 142 |
| Auto Theft | 29 | 27 | 26 | 45 | 47 | 28 | 59 | 72 | 96 |
| Total | 479 | 531 | 583 | 482 | 569 | 441 | 436 | 503 | 678 |
| Source: Denver Police Department | |||||||||
| Table D7 – Wellshire, District 4 – Number of Incidents | |||||||||
| 2014 | 2015 | 2016 | 2017 | 2018 | 2019 | 2020 | 2021 | 2022 | |
| Public Disorder | 20 | 15 | 8 | 15 | 11 | 11 | 8 | 8 | 5 |
| Drug/Alcohol | 2 | 1 | 3 | 5 | 3 | 3 | 1 | 0 | 3 |
| Sexual Assault | 1 | 0 | 0 | 1 | 1 | 0 | 1 | 0 | 0 |
| Other Crimes against Persons | 3 | 3 | 2 | 2 | 3 | 2 | 1 | 0 | 2 |
| All Other Crimes | 2 | 3 | 2 | 7 | 0 | 2 | 3 | 0 | 1 |
| White-collar Crime | 1 | 9 | 1 | 3 | 1 | 2 | 1 | 2 | 3 |
| Murder | 0 | 0 | 0 | 0 | 0 | 0 | 0 | 0 | 0 |
| Robbery | 0 | 0 | 0 | 0 | 2 | 0 | 1 | 1 | 2 |
| Aggravated Assault | 0 | 0 | 2 | 1 | 2 | 1 | 0 | 1 | 4 |
| Arson | 0 | 0 | 0 | 0 | 0 | 0 | 0 | 0 | 0 |
| Burglary | 9 | 18 | 19 | 14 | 8 | 12 | 5 | 5 | 6 |
| Larceny | 8 | 10 | 8 | 8 | 10 | 5 | 12 | 9 | 8 |
| Theft from Motor Vehicle | 18 | 32 | 9 | 21 | 27 | 19 | 22 | 23 | 28 |
| Auto Theft | 5 | 5 | 9 | 7 | 7 | 6 | 8 | 15 | 9 |
| Total | 69 | 96 | 63 | 84 | 75 | 63 | 63 | 64 | 71 |
| Source: Denver Police Department | |||||||||
Appendix E: Incidents by Type and Neighborhood District 5
| Table E1 – Belcaro, District 5 – Number of Incidents | |||||||||
| 2014 | 2015 | 2016 | 2017 | 2018 | 2019 | 2020 | 2021 | 2022 | |
| Public Disorder | 1 | 2 | 1 | 1 | 1 | 1 | 2 | 2 | 2 |
| Drug/Alcohol | 0 | 0 | 1 | 1 | 1 | 0 | 0 | 0 | 0 |
| Sexual Assault | 0 | 0 | 0 | 0 | 0 | 0 | 0 | 0 | 0 |
| Other Crimes against Persons | 0 | 1 | 1 | 1 | 0 | 1 | 1 | 0 | 1 |
| All Other Crimes | 1 | 1 | 1 | 1 | 1 | 1 | 1 | 1 | 1 |
| White-collar Crime | 0 | 0 | 0 | 0 | 0 | 0 | 0 | 0 | 1 |
| Murder | 0 | 0 | 0 | 0 | 0 | 0 | 0 | 0 | 0 |
| Robbery | 0 | 0 | 0 | 0 | 0 | 0 | 0 | 0 | 0 |
| Aggravated Assault | 0 | 0 | 0 | 0 | 0 | 0 | 0 | 0 | 0 |
| Arson | 0 | 0 | 0 | 0 | 0 | 0 | 0 | 0 | 0 |
| Burglary | 2 | 2 | 1 | 2 | 2 | 2 | 2 | 2 | 2 |
| Larceny | 2 | 2 | 2 | 2 | 2 | 2 | 4 | 3 | 3 |
| Theft from Motor Vehicle | 2 | 3 | 1 | 2 | 2 | 4 | 4 | 4 | 4 |
| Auto Theft | 1 | 1 | 1 | 1 | 1 | 1 | 2 | 3 | 3 |
| Total | 11 | 12 | 10 | 11 | 11 | 14 | 17 | 16 | 17 |
| Source: Denver Police Department | |||||||||
| Table E2 – Cherry Creek, District 5 – Number of Incidents | |||||||||
| 2014 | 2015 | 2016 | 2017 | 2018 | 2019 | 2020 | 2021 | 2022 | |
| Public Disorder | 58 | 76 | 49 | 67 | 40 | 48 | 70 | 96 | 115 |
| Drug/Alcohol | 14 | 19 | 16 | 17 | 20 | 14 | 6 | 4 | 3 |
| Sexual Assault | 2 | 10 | 1 | 2 | 6 | 7 | 5 | 5 | 4 |
| Other Crimes against Persons | 19 | 25 | 20 | 25 | 11 | 17 | 11 | 11 | 29 |
| All Other Crimes | 19 | 32 | 30 | 30 | 17 | 26 | 18 | 24 | 11 |
| White-collar Crime | 33 | 38 | 38 | 34 | 39 | 40 | 14 | 15 | 21 |
| Murder | 0 | 0 | 0 | 0 | 0 | 0 | 0 | 0 | 0 |
| Robbery | 5 | 10 | 10 | 10 | 9 | 12 | 10 | 9 | 25 |
| Aggravated Assault | 5 | 10 | 7 | 2 | 5 | 4 | 5 | 12 | 11 |
| Arson | 1 | 0 | 1 | 1 | 0 | 0 | 1 | 1 | 3 |
| Burglary | 51 | 67 | 71 | 72 | 48 | 65 | 82 | 86 | 50 |
| Larceny | 252 | 301 | 334 | 285 | 254 | 314 | 212 | 172 | 225 |
| Theft from Motor Vehicle | 48 | 84 | 39 | 64 | 67 | 103 | 134 | 142 | 215 |
| Auto Theft | 23 | 32 | 21 | 31 | 32 | 44 | 67 | 92 | 124 |
| Total | 529 | 704 | 637 | 641 | 548 | 693 | 635 | 669 | 837 |
| Source: Denver Police Department | |||||||||
| Table E3 – East Colfax, District 5 – Number of Incidents | |||||||||
| 2014 | 2015 | 2016 | 2017 | 2018 | 2019 | 2020 | 2021 | 2022 | |
| Public Disorder | 180 | 190 | 251 | 258 | 174 | 140 | 128 | 204 | 232 |
| Drug/Alcohol | 406 | 293 | 349 | 318 | 380 | 146 | 82 | 82 | 63 |
| Sexual Assault | 16 | 17 | 14 | 22 | 16 | 17 | 13 | 15 | 11 |
| Other Crimes against Persons | 93 | 93 | 88 | 79 | 70 | 59 | 60 | 62 | 57 |
| All Other Crimes | 259 | 217 | 321 | 372 | 260 | 165 | 223 | 283 | 264 |
| White-collar Crime | 9 | 13 | 15 | 9 | 20 | 14 | 17 | 17 | 14 |
| Murder | 1 | 4 | 1 | 2 | 2 | 3 | 6 | 6 | 4 |
| Robbery | 42 | 30 | 35 | 49 | 42 | 30 | 37 | 38 | 37 |
| Aggravated Assault | 47 | 52 | 56 | 54 | 63 | 48 | 82 | 93 | 94 |
| Arson | 6 | 2 | 2 | 5 | 4 | 2 | 1 | 6 | 2 |
| Burglary | 70 | 94 | 79 | 88 | 66 | 50 | 80 | 98 | 87 |
| Larceny | 77 | 58 | 97 | 99 | 70 | 63 | 98 | 92 | 81 |
| Theft from Motor Vehicle | 54 | 56 | 69 | 109 | 91 | 101 | 141 | 157 | 150 |
| Auto Theft | 41 | 58 | 77 | 101 | 79 | 88 | 182 | 210 | 239 |
| Total | 1,302 | 1,177 | 1,454 | 1,566 | 1,337 | 927 | 1,151 | 1,362 | 1,336 |
| Source: Denver Police Department | |||||||||
| Table E4 – Hale, District 5 – Number of Incidents | |||||||||
| 2014 | 2015 | 2016 | 2017 | 2018 | 2019 | 2020 | 2021 | 2022 | |
| Public Disorder | 78 | 69 | 90 | 57 | 58 | 70 | 75 | 109 | 148 |
| Drug/Alcohol | 20 | 11 | 16 | 15 | 14 | 14 | 5 | 7 | 7 |
| Sexual Assault | 5 | 14 | 11 | 10 | 5 | 6 | 5 | 5 | 5 |
| Other Crimes against Persons | 23 | 23 | 26 | 29 | 21 | 26 | 15 | 17 | 21 |
| All Other Crimes | 32 | 23 | 32 | 51 | 25 | 28 | 32 | 29 | 36 |
| White-collar Crime | 12 | 6 | 10 | 4 | 11 | 16 | 8 | 10 | 15 |
| Murder | 0 | 0 | 0 | 0 | 0 | 0 | 0 | 1 | 0 |
| Robbery | 2 | 11 | 9 | 12 | 7 | 7 | 5 | 10 | 13 |
| Aggravated Assault | 5 | 7 | 7 | 20 | 10 | 12 | 14 | 22 | 21 |
| Arson | 2 | 2 | 1 | 1 | 1 | 1 | 0 | 0 | 5 |
| Burglary | 48 | 48 | 42 | 37 | 35 | 39 | 55 | 45 | 46 |
| Larceny | 44 | 46 | 55 | 58 | 60 | 59 | 96 | 100 | 75 |
| Theft from Motor Vehicle | 47 | 62 | 57 | 63 | 87 | 66 | 123 | 192 | 174 |
| Auto Theft | 19 | 32 | 29 | 46 | 43 | 46 | 69 | 120 | 149 |
| Total | 335 | 354 | 384 | 401 | 378 | 391 | 503 | 665 | 714 |
| Source: Denver Police Department | |||||||||
| Table E5 – Hilltop, District 5 – Number of Incidents | |||||||||
| 2014 | 2015 | 2016 | 2017 | 2018 | 2019 | 2020 | 2021 | 2022 | |
| Public Disorder | 53 | 43 | 46 | 32 | 34 | 32 | 39 | 63 | 77 |
| Drug/Alcohol | 8 | 7 | 5 | 5 | 5 | 9 | 2 | 4 | 1 |
| Sexual Assault | 2 | 1 | 4 | 3 | 5 | 3 | 5 | 4 | 5 |
| Other Crimes against Persons | 14 | 22 | 7 | 21 | 14 | 15 | 10 | 10 | 9 |
| All Other Crimes | 21 | 26 | 18 | 9 | 9 | 16 | 14 | 13 | 23 |
| White-collar Crime | 8 | 23 | 10 | 4 | 5 | 14 | 5 | 10 | 9 |
| Murder | 0 | 1 | 1 | 0 | 0 | 0 | 1 | 0 | 0 |
| Robbery | 0 | 2 | 2 | 1 | 0 | 5 | 3 | 1 | 4 |
| Aggravated Assault | 4 | 5 | 8 | 12 | 4 | 5 | 11 | 5 | 15 |
| Arson | 0 | 0 | 0 | 0 | 0 | 1 | 2 | 1 | 0 |
| Burglary | 34 | 65 | 50 | 34 | 50 | 33 | 38 | 47 | 36 |
| Larceny | 32 | 31 | 25 | 32 | 29 | 33 | 65 | 53 | 55 |
| Theft from Motor Vehicle | 60 | 61 | 48 | 50 | 64 | 86 | 100 | 127 | 81 |
| Auto Theft | 14 | 14 | 18 | 27 | 34 | 37 | 56 | 86 | 102 |
| Total | 250 | 300 | 241 | 228 | 254 | 289 | 349 | 422 | 416 |
| Source: Denver Police Department | |||||||||
| Table E6 – Lowry Field, District 5 – Number of Incidents | |||||||||
| 2014 | 2015 | 2016 | 2017 | 2018 | 2019 | 2020 | 2021 | 2022 | |
| Public Disorder | 136 | 104 | 64 | 72 | 49 | 84 | 118 | 148 | 219 |
| Drug/Alcohol | 10 | 12 | 20 | 11 | 11 | 13 | 3 | 5 | 3 |
| Sexual Assault | 7 | 7 | 4 | 5 | 8 | 8 | 6 | 7 | 4 |
| Other Crimes against Persons | 64 | 46 | 53 | 42 | 30 | 38 | 24 | 33 | 36 |
| All Other Crimes | 54 | 42 | 40 | 44 | 26 | 26 | 31 | 32 | 37 |
| White-collar Crime | 10 | 18 | 12 | 13 | 14 | 14 | 11 | 6 | 14 |
| Murder | 1 | 0 | 1 | 1 | 0 | 1 | 1 | 3 | 0 |
| Robbery | 3 | 7 | 4 | 6 | 6 | 5 | 8 | 6 | 3 |
| Aggravated Assault | 20 | 16 | 29 | 19 | 10 | 21 | 30 | 23 | 26 |
| Arson | 0 | 0 | 0 | 0 | 2 | 0 | 1 | 0 | 0 |
| Burglary | 64 | 65 | 63 | 65 | 53 | 54 | 73 | 75 | 62 |
| Larceny | 94 | 68 | 64 | 66 | 71 | 74 | 81 | 110 | 122 |
| Theft from Motor Vehicle | 50 | 70 | 60 | 89 | 102 | 91 | 143 | 213 | 224 |
| Auto Theft | 18 | 27 | 15 | 46 | 28 | 60 | 98 | 174 | 217 |
| Total | 531 | 482 | 429 | 479 | 410 | 489 | 628 | 835 | 967 |
| Source: Denver Police Department | |||||||||
| Table E7 – Montclair, District 5 – Number of Incidents | |||||||||
| 2014 | 2015 | 2016 | 2017 | 2018 | 2019 | 2020 | 2021 | 2022 | |
| Public Disorder | 63 | 48 | 63 | 54 | 46 | 42 | 54 | 77 | 74 |
| Drug/Alcohol | 33 | 25 | 41 | 27 | 24 | 27 | 7 | 14 | 5 |
| Sexual Assault | 2 | 3 | 4 | 6 | 4 | 5 | 1 | 5 | 2 |
| Other Crimes against Persons | 28 | 20 | 28 | 25 | 23 | 18 | 24 | 15 | 20 |
| All Other Crimes | 51 | 28 | 50 | 41 | 39 | 14 | 35 | 24 | 25 |
| White-collar Crime | 7 | 9 | 12 | 9 | 7 | 9 | 12 | 7 | 13 |
| Murder | 0 | 0 | 0 | 1 | 0 | 0 | 1 | 2 | 2 |
| Robbery | 7 | 14 | 17 | 21 | 10 | 6 | 15 | 12 | 13 |
| Aggravated Assault | 11 | 9 | 3 | 16 | 12 | 5 | 12 | 22 | 31 |
| Arson | 2 | 2 | 1 | 0 | 0 | 1 | 1 | 2 | 0 |
| Burglary | 47 | 72 | 60 | 54 | 37 | 31 | 41 | 49 | 40 |
| Larceny | 142 | 112 | 103 | 102 | 113 | 114 | 160 | 135 | 147 |
| Theft from Motor Vehicle | 49 | 54 | 38 | 67 | 53 | 42 | 65 | 101 | 73 |
| Auto Theft | 12 | 23 | 22 | 43 | 28 | 35 | 72 | 68 | 89 |
| Total | 454 | 419 | 442 | 466 | 396 | 349 | 500 | 533 | 534 |
| Source: Denver Police Department | |||||||||
| Table E8 – Washington Virginia Vale, District 5 – Number of Incidents | |||||||||
| 2014 | 2015 | 2016 | 2017 | 2018 | 2019 | 2020 | 2021 | 2022 | |
| Public Disorder | 112 | 112 | 98 | 90 | 74 | 64 | 81 | 97 | 118 |
| Drug/Alcohol | 26 | 23 | 19 | 26 | 48 | 22 | 10 | 17 | 8 |
| Sexual Assault | 5 | 4 | 8 | 14 | 9 | 11 | 9 | 7 | 8 |
| Other Crimes against Persons | 50 | 44 | 47 | 56 | 25 | 28 | 29 | 32 | 43 |
| All Other Crimes | 53 | 34 | 42 | 43 | 54 | 31 | 29 | 37 | 35 |
| White-collar Crime | 9 | 17 | 10 | 14 | 16 | 10 | 17 | 16 | 13 |
| Murder | 0 | 1 | 0 | 0 | 1 | 1 | 1 | 0 | 0 |
| Robbery | 9 | 6 | 9 | 14 | 11 | 14 | 8 | 11 | 11 |
| Aggravated Assault | 16 | 17 | 13 | 26 | 18 | 16 | 21 | 32 | 34 |
| Arson | 1 | 1 | 1 | 2 | 1 | 1 | 1 | 0 | 4 |
| Burglary | 67 | 79 | 56 | 55 | 37 | 50 | 48 | 59 | 48 |
| Larceny | 91 | 87 | 82 | 73 | 73 | 56 | 74 | 89 | 70 |
| Theft from Motor Vehicle | 46 | 73 | 43 | 55 | 93 | 86 | 97 | 145 | 125 |
| Auto Theft | 27 | 52 | 42 | 41 | 49 | 66 | 112 | 152 | 163 |
| Total | 512 | 548 | 470 | 509 | 508 | 457 | 538 | 695 | 681 |
| Source: Denver Police Department | |||||||||
| Table E9 – Windsor, District 5 – Number of Incidents | |||||||||
| 2014 | 2015 | 2016 | 2017 | 2018 | 2019 | 2020 | 2021 | 2022 | |
| Public Disorder | 101 | 75 | 89 | 98 | 59 | 62 | 113 | 108 | 130 |
| Drug/Alcohol | 10 | 5 | 6 | 11 | 12 | 6 | 6 | 3 | 5 |
| Sexual Assault | 7 | 13 | 6 | 9 | 5 | 9 | 11 | 6 | 4 |
| Other Crimes against Persons | 40 | 65 | 66 | 58 | 28 | 25 | 25 | 35 | 38 |
| All Other Crimes | 43 | 31 | 32 | 22 | 30 | 16 | 30 | 29 | 25 |
| White-collar Crime | 15 | 20 | 15 | 16 | 19 | 26 | 19 | 32 | 28 |
| Murder | 0 | 0 | 1 | 0 | 1 | 0 | 0 | 2 | 1 |
| Robbery | 5 | 6 | 5 | 7 | 3 | 7 | 16 | 11 | 10 |
| Aggravated Assault | 14 | 16 | 15 | 23 | 11 | 26 | 32 | 36 | 36 |
| Arson | 1 | 2 | 0 | 1 | 1 | 0 | 0 | 1 | 4 |
| Burglary | 51 | 58 | 44 | 40 | 41 | 36 | 53 | 92 | 47 |
| Larceny | 59 | 47 | 25 | 38 | 43 | 50 | 59 | 77 | 57 |
| Theft from Motor Vehicle | 48 | 77 | 87 | 73 | 121 | 103 | 104 | 152 | 150 |
| Auto Theft | 42 | 32 | 47 | 84 | 76 | 77 | 174 | 222 | 234 |
| Total | 437 | 446 | 440 | 478 | 448 | 443 | 641 | 805 | 767 |
| Source: Denver Police Department | |||||||||
Appendix F: Incidents by Type and Neighborhood District 6
| Table F1 – Cory Merrill, District 6 – Number of Incidents | |||||||||
| 2014 | 2015 | 2016 | 2017 | 2018 | 2019 | 2020 | 2021 | 2022 | |
| Public Disorder | 34 | 61 | 35 | 41 | 23 | 23 | 24 | 63 | 52 |
| Drug/Alcohol | 21 | 10 | 24 | 24 | 25 | 25 | 8 | 22 | 8 |
| Sexual Assault | 0 | 0 | 3 | 1 | 3 | 5 | 0 | 3 | 0 |
| Other Crimes against Persons | 16 | 15 | 13 | 15 | 5 | 8 | 7 | 6 | 13 |
| All Other Crimes | 20 | 25 | 21 | 12 | 18 | 30 | 13 | 17 | 16 |
| White-collar Crime | 9 | 16 | 14 | 15 | 13 | 10 | 7 | 8 | 12 |
| Murder | 0 | 0 | 0 | 0 | 0 | 0 | 0 | 0 | 0 |
| Robbery | 2 | 6 | 9 | 7 | 7 | 2 | 8 | 14 | 7 |
| Aggravated Assault | 3 | 3 | 5 | 1 | 3 | 3 | 3 | 4 | 6 |
| Arson | 1 | 0 | 0 | 0 | 0 | 0 | 0 | 0 | 0 |
| Burglary | 33 | 35 | 26 | 35 | 25 | 22 | 25 | 55 | 45 |
| Larceny | 94 | 95 | 96 | 92 | 65 | 69 | 140 | 207 | 106 |
| Theft from Motor Vehicle | 49 | 84 | 25 | 34 | 49 | 50 | 47 | 98 | 99 |
| Auto Theft | 10 | 28 | 13 | 11 | 21 | 23 | 29 | 53 | 65 |
| Total | 292 | 378 | 284 | 288 | 257 | 270 | 311 | 550 | 429 |
| Source: Denver Police Department | |||||||||
| Table F2 – Indian Creek, District 6 – Number of Incidents | |||||||||
| 2014 | 2015 | 2016 | 2017 | 2018 | 2019 | 2020 | 2021 | 2022 | |
| Public Disorder | 13 | 18 | 16 | 11 | 11 | 13 | 25 | 26 | 24 |
| Drug/Alcohol | 1 | 0 | 1 | 1 | 1 | 1 | 0 | 1 | 0 |
| Sexual Assault | 0 | 2 | 0 | 0 | 0 | 0 | 2 | 0 | 0 |
| Other Crimes against Persons | 2 | 8 | 6 | 4 | 2 | 5 | 7 | 2 | 6 |
| All Other Crimes | 3 | 5 | 4 | 6 | 2 | 3 | 3 | 8 | 1 |
| White-collar Crime | 1 | 6 | 3 | 5 | 2 | 3 | 6 | 7 | 5 |
| Murder | 0 | 0 | 0 | 0 | 0 | 1 | 1 | 0 | 0 |
| Robbery | 0 | 2 | 0 | 0 | 0 | 3 | 0 | 1 | 1 |
| Aggravated Assault | 1 | 1 | 0 | 1 | 2 | 1 | 3 | 6 | 2 |
| Arson | 2 | 0 | 0 | 0 | 0 | 0 | 0 | 0 | 0 |
| Burglary | 21 | 11 | 12 | 8 | 9 | 3 | 8 | 20 | 7 |
| Larceny | 9 | 6 | 6 | 15 | 9 | 11 | 13 | 15 | 20 |
| Theft from Motor Vehicle | 10 | 10 | 21 | 22 | 23 | 27 | 34 | 47 | 42 |
| Auto Theft | 4 | 5 | 12 | 11 | 15 | 9 | 28 | 40 | 27 |
| Total | 67 | 74 | 81 | 84 | 76 | 80 | 130 | 173 | 135 |
| Source: Denver Police Department | |||||||||
| Table F3 – Rosedale, District 6 – Number of Incidents | |||||||||
| 2014 | 2015 | 2016 | 2017 | 2018 | 2019 | 2020 | 2021 | 2022 | |
| Public Disorder | 22 | 17 | 29 | 17 | 8 | 14 | 14 | 16 | 16 |
| Drug/Alcohol | 11 | 5 | 3 | 8 | 16 | 13 | 4 | 2 | 0 |
| Sexual Assault | 1 | 3 | 1 | 2 | 2 | 1 | 3 | 2 | 1 |
| Other Crimes against Persons | 11 | 13 | 13 | 8 | 5 | 4 | 7 | 5 | 5 |
| All Other Crimes | 14 | 11 | 12 | 10 | 5 | 7 | 7 | 6 | 5 |
| White-collar Crime | 4 | 2 | 3 | 1 | 1 | 3 | 2 | 1 | 1 |
| Murder | 0 | 0 | 0 | 0 | 0 | 0 | 0 | 0 | 0 |
| Robbery | 2 | 3 | 4 | 1 | 1 | 1 | 0 | 1 | 2 |
| Aggravated Assault | 2 | 3 | 1 | 2 | 1 | 2 | 2 | 7 | 4 |
| Arson | 1 | 0 | 0 | 0 | 0 | 0 | 1 | 0 | 0 |
| Burglary | 11 | 17 | 17 | 25 | 25 | 10 | 17 | 14 | 14 |
| Larceny | 18 | 14 | 7 | 14 | 16 | 16 | 14 | 10 | 13 |
| Theft from Motor Vehicle | 15 | 20 | 18 | 14 | 22 | 30 | 28 | 31 | 28 |
| Auto Theft | 15 | 13 | 10 | 13 | 8 | 10 | 21 | 23 | 26 |
| Total | 126 | 122 | 117 | 116 | 109 | 110 | 118 | 118 | 116 |
| Source: Denver Police Department | |||||||||
| Table F4 – University, District 6 – Number of Incidents | |||||||||
| 2014 | 2015 | 2016 | 2017 | 2018 | 2019 | 2020 | 2021 | 2022 | |
| Public Disorder | 78 | 68 | 77 | 80 | 76 | 38 | 44 | 75 | 95 |
| Drug/Alcohol | 18 | 13 | 9 | 19 | 12 | 12 | 14 | 5 | 3 |
| Sexual Assault | 9 | 5 | 5 | 5 | 10 | 6 | 4 | 4 | 5 |
| Other Crimes against Persons | 19 | 18 | 26 | 30 | 16 | 14 | 14 | 14 | 15 |
| All Other Crimes | 52 | 48 | 39 | 47 | 26 | 13 | 19 | 18 | 21 |
| White-collar Crime | 6 | 16 | 10 | 17 | 13 | 6 | 5 | 17 | 11 |
| Murder | 0 | 0 | 0 | 1 | 0 | 0 | 0 | 0 | 1 |
| Robbery | 12 | 5 | 9 | 7 | 8 | 11 | 5 | 8 | 11 |
| Aggravated Assault | 9 | 11 | 5 | 7 | 12 | 10 | 9 | 10 | 10 |
| Arson | 3 | 1 | 0 | 0 | 0 | 0 | 0 | 0 | 1 |
| Burglary | 43 | 57 | 50 | 62 | 32 | 29 | 23 | 61 | 39 |
| Larceny | 89 | 67 | 73 | 77 | 68 | 68 | 94 | 76 | 84 |
| Theft from Motor Vehicle | 50 | 71 | 61 | 79 | 110 | 81 | 86 | 132 | 114 |
| Auto Theft | 31 | 26 | 37 | 43 | 38 | 35 | 53 | 73 | 104 |
| Total | 419 | 405 | 401 | 474 | 419 | 323 | 370 | 491 | 512 |
| Source: Denver Police Department | |||||||||
| Table F5 – University Park, District 6 – Number of Incidents | |||||||||
| 2014 | 2015 | 2016 | 2017 | 2018 | 2019 | 2020 | 2021 | 2022 | |
| Public Disorder | 79 | 93 | 76 | 54 | 55 | 32 | 72 | 86 | 107 |
| Drug/Alcohol | 14 | 12 | 21 | 27 | 47 | 48 | 36 | 24 | 40 |
| Sexual Assault | 5 | 7 | 5 | 10 | 3 | 4 | 5 | 5 | 4 |
| Other Crimes against Persons | 17 | 22 | 15 | 22 | 17 | 13 | 11 | 16 | 20 |
| All Other Crimes | 25 | 25 | 31 | 16 | 21 | 23 | 14 | 23 | 31 |
| White-collar Crime | 14 | 15 | 12 | 16 | 18 | 13 | 6 | 14 | 23 |
| Murder | 1 | 0 | 0 | 0 | 0 | 0 | 0 | 0 | 0 |
| Robbery | 4 | 4 | 8 | 4 | 11 | 7 | 6 | 5 | 10 |
| Aggravated Assault | 3 | 10 | 9 | 5 | 7 | 4 | 7 | 8 | 18 |
| Arson | 0 | 0 | 0 | 1 | 0 | 1 | 0 | 2 | 0 |
| Burglary | 56 | 61 | 39 | 66 | 55 | 42 | 47 | 72 | 53 |
| Larceny | 68 | 48 | 53 | 67 | 88 | 71 | 101 | 132 | 98 |
| Theft from Motor Vehicle | 46 | 112 | 68 | 76 | 116 | 93 | 140 | 170 | 213 |
| Auto Theft | 16 | 39 | 22 | 34 | 38 | 46 | 89 | 103 | 120 |
| Total | 348 | 448 | 359 | 398 | 476 | 397 | 534 | 660 | 737 |
| Source: Denver Police Department | |||||||||
| Table F6 – Virginia Village, District 6 – Number of Incidents | |||||||||
| 2014 | 2015 | 2016 | 2017 | 2018 | 2019 | 2020 | 2021 | 2022 | |
| Public Disorder | 106 | 100 | 94 | 105 | 78 | 86 | 113 | 141 | 142 |
| Drug/Alcohol | 26 | 33 | 37 | 65 | 44 | 38 | 20 | 20 | 13 |
| Sexual Assault | 8 | 5 | 10 | 6 | 10 | 9 | 8 | 11 | 13 |
| Other Crimes against Persons | 46 | 59 | 52 | 57 | 30 | 45 | 37 | 39 | 49 |
| All Other Crimes | 96 | 51 | 41 | 65 | 45 | 44 | 52 | 46 | 33 |
| White-collar Crime | 22 | 21 | 20 | 26 | 15 | 37 | 19 | 16 | 29 |
| Murder | 0 | 1 | 1 | 0 | 1 | 1 | 1 | 0 | 1 |
| Robbery | 8 | 12 | 13 | 7 | 13 | 3 | 8 | 14 | 10 |
| Aggravated Assault | 13 | 19 | 18 | 16 | 14 | 16 | 20 | 28 | 42 |
| Arson | 9 | 4 | 1 | 3 | 1 | 1 | 2 | 0 | 1 |
| Burglary | 108 | 90 | 59 | 67 | 40 | 53 | 89 | 93 | 92 |
| Larceny | 136 | 114 | 105 | 109 | 113 | 69 | 115 | 173 | 108 |
| Theft from Motor Vehicle | 69 | 122 | 85 | 102 | 125 | 143 | 193 | 232 | 222 |
| Auto Theft | 49 | 50 | 69 | 88 | 74 | 82 | 182 | 247 | 207 |
| Total | 696 | 681 | 605 | 716 | 603 | 627 | 859 | 1,060 | 962 |
| Source: Denver Police Department | |||||||||
| Table F7 – Washington Park District 6 – Number of Incidents | |||||||||
| 2014 | 2015 | 2016 | 2017 | 2018 | 2019 | 2020 | 2021 | 2022 | |
| Public Disorder | 78 | 75 | 59 | 46 | 51 | 39 | 31 | 45 | 64 |
| Drug/Alcohol | 30 | 42 | 37 | 15 | 4 | 5 | 6 | 9 | 6 |
| Sexual Assault | 9 | 0 | 5 | 3 | 3 | 4 | 10 | 9 | 6 |
| Other Crimes against Persons | 26 | 11 | 19 | 19 | 10 | 2 | 10 | 11 | 11 |
| All Other Crimes | 24 | 21 | 11 | 30 | 27 | 15 | 11 | 18 | 13 |
| White-collar Crime | 11 | 20 | 7 | 9 | 10 | 7 | 7 | 7 | 13 |
| Murder | 0 | 0 | 0 | 0 | 0 | 0 | 0 | 0 | 0 |
| Robbery | 2 | 4 | 1 | 2 | 1 | 0 | 2 | 2 | 4 |
| Aggravated Assault | 1 | 1 | 8 | 5 | 4 | 5 | 4 | 5 | 6 |
| Arson | 1 | 0 | 0 | 0 | 1 | 0 | 0 | 0 | 0 |
| Burglary | 49 | 64 | 63 | 57 | 38 | 39 | 42 | 57 | 38 |
| Larceny | 46 | 36 | 37 | 38 | 46 | 43 | 57 | 72 | 39 |
| Theft from Motor Vehicle | 55 | 77 | 58 | 79 | 79 | 76 | 91 | 121 | 149 |
| Auto Theft | 29 | 44 | 19 | 34 | 23 | 22 | 54 | 57 | 67 |
| Total | 361 | 395 | 324 | 337 | 297 | 257 | 325 | 413 | 416 |
| Source: Denver Police Department | |||||||||
| Table F8 – Washington Virginia Vale District 6 – Number of Incidents | |||||||||
| 2014 | 2015 | 2016 | 2017 | 2018 | 2019 | 2020 | 2021 | 2022 | |
| Public Disorder | 75 | 75 | 66 | 60 | 50 | 43 | 54 | 65 | 79 |
| Drug/Alcohol | 18 | 15 | 13 | 17 | 32 | 15 | 6 | 11 | 5 |
| Sexual Assault | 4 | 3 | 5 | 9 | 6 | 8 | 6 | 5 | 6 |
| Other Crimes against Persons | 33 | 30 | 32 | 38 | 17 | 19 | 19 | 21 | 28 |
| All Other Crimes | 35 | 22 | 28 | 29 | 36 | 20 | 20 | 25 | 24 |
| White-collar Crime | 6 | 11 | 7 | 9 | 10 | 7 | 12 | 11 | 9 |
| Murder | 0 | 0 | 0 | 0 | 0 | 1 | 0 | 0 | 0 |
| Robbery | 6 | 4 | 6 | 9 | 7 | 9 | 6 | 8 | 7 |
| Aggravated Assault | 10 | 11 | 9 | 17 | 12 | 11 | 14 | 21 | 23 |
| Arson | 0 | 1 | 0 | 1 | 0 | 0 | 0 | 0 | 3 |
| Burglary | 45 | 52 | 38 | 36 | 25 | 34 | 32 | 39 | 32 |
| Larceny | 60 | 58 | 54 | 49 | 48 | 37 | 50 | 60 | 46 |
| Theft from Motor Vehicle | 31 | 48 | 28 | 37 | 62 | 57 | 65 | 97 | 84 |
| Auto Theft | 18 | 34 | 28 | 28 | 33 | 44 | 75 | 101 | 109 |
| Total | 341 | 366 | 314 | 339 | 339 | 304 | 358 | 463 | 454 |
| Source: Denver Police Department | |||||||||
| Table F9 – Windsor District 6 – Number of Incidents | |||||||||
| 2014 | 2015 | 2016 | 2017 | 2018 | 2019 | 2020 | 2021 | 2022 | |
| Public Disorder | 11 | 8 | 10 | 11 | 7 | 7 | 13 | 12 | 14 |
| Drug/Alcohol | 1 | 1 | 1 | 1 | 1 | 1 | 1 | 0 | 1 |
| Sexual Assault | 1 | 1 | 1 | 1 | 1 | 1 | 1 | 1 | 0 |
| Other Crimes against Persons | 4 | 7 | 7 | 6 | 3 | 3 | 3 | 4 | 4 |
| All Other Crimes | 5 | 3 | 4 | 2 | 3 | 2 | 3 | 3 | 3 |
| White-collar Crime | 2 | 2 | 2 | 2 | 2 | 3 | 2 | 4 | 3 |
| Murder | 0 | 0 | 0 | 0 | 0 | 0 | 0 | 0 | 0 |
| Robbery | 1 | 1 | 1 | 1 | 0 | 1 | 2 | 1 | 1 |
| Aggravated Assault | 2 | 2 | 2 | 3 | 1 | 3 | 4 | 4 | 4 |
| Arson | 0 | 0 | 0 | 0 | 0 | 0 | 0 | 0 | 0 |
| Burglary | 6 | 6 | 5 | 4 | 5 | 4 | 6 | 10 | 5 |
| Larceny | 7 | 5 | 3 | 4 | 5 | 6 | 7 | 9 | 6 |
| Theft from Motor Vehicle | 5 | 9 | 10 | 8 | 13 | 11 | 12 | 17 | 17 |
| Auto Theft | 5 | 4 | 5 | 9 | 8 | 9 | 19 | 25 | 26 |
| Total | 49 | 50 | 49 | 53 | 50 | 49 | 71 | 89 | 85 |
| Source: Denver Police Department | |||||||||
| Table F10 – Rosedale District 6 – Number of Incidents | |||||||||
| 2014 | 2015 | 2016 | 2017 | 2018 | 2019 | 2020 | 2021 | 2022 | |
| Public Disorder | 11 | 16 | 12 | 13 | 9 | 12 | 18 | 18 | 20 |
| Drug/Alcohol | 1 | 3 | 5 | 5 | 5 | 4 | 4 | 1 | 2 |
| Sexual Assault | 1 | 2 | 1 | 2 | 1 | 1 | 0 | 1 | 1 |
| Other Crimes against Persons | 4 | 7 | 5 | 5 | 3 | 5 | 5 | 4 | 5 |
| All Other Crimes | 13 | 13 | 12 | 8 | 8 | 12 | 9 | 7 | 6 |
| White-collar Crime | 4 | 3 | 4 | 4 | 4 | 3 | 4 | 4 | 8 |
| Murder | 0 | 0 | 0 | 0 | 0 | 0 | 0 | 0 | 0 |
| Robbery | 0 | 1 | 0 | 3 | 2 | 3 | 3 | 3 | 2 |
| Aggravated Assault | 2 | 2 | 1 | 1 | 1 | 1 | 3 | 1 | 3 |
| Arson | 0 | 0 | 0 | 0 | 0 | 0 | 0 | 1 | 0 |
| Burglary | 16 | 15 | 13 | 16 | 17 | 18 | 16 | 18 | 19 |
| Larceny | 19 | 17 | 17 | 21 | 21 | 21 | 32 | 24 | 25 |
| Theft from Motor Vehicle | 18 | 27 | 12 | 18 | 22 | 34 | 37 | 39 | 40 |
| Auto Theft | 7 | 5 | 6 | 6 | 9 | 9 | 18 | 27 | 24 |
| Total | 95 | 110 | 89 | 102 | 103 | 124 | 149 | 148 | 155 |
| Source: Denver Police Department | |||||||||
Appendix G: Incidents by Type and Neighborhood District 7
| Table G1 – Athmar Park District 7 – Number of Incidents | |||||||||
| 2014 | 2015 | 2016 | 2017 | 2018 | 2019 | 2020 | 2021 | 2022 | |
| Public Disorder | 225 | 198 | 153 | 93 | 111 | 75 | 94 | 101 | 146 |
| Drug/Alcohol | 109 | 105 | 89 | 83 | 85 | 87 | 57 | 33 | 32 |
| Sexual Assault | 11 | 12 | 14 | 8 | 9 | 8 | 3 | 8 | 9 |
| Other Crimes against Persons | 56 | 71 | 50 | 62 | 33 | 42 | 31 | 38 | 42 |
| All Other Crimes | 146 | 127 | 140 | 120 | 106 | 80 | 89 | 94 | 138 |
| White-collar Crime | 20 | 21 | 19 | 9 | 11 | 22 | 11 | 7 | 11 |
| Murder | 0 | 0 | 1 | 2 | 1 | 1 | 4 | 3 | 1 |
| Robbery | 23 | 17 | 21 | 24 | 16 | 16 | 17 | 10 | 10 |
| Aggravated Assault | 41 | 40 | 43 | 28 | 34 | 34 | 43 | 44 | 47 |
| Arson | 2 | 3 | 1 | 4 | 0 | 1 | 4 | 2 | 0 |
| Burglary | 77 | 68 | 61 | 56 | 54 | 27 | 44 | 68 | 53 |
| Larceny | 62 | 61 | 71 | 72 | 62 | 56 | 73 | 57 | 80 |
| Theft from Motor Vehicle | 58 | 93 | 125 | 97 | 105 | 86 | 124 | 117 | 98 |
| Auto Theft | 93 | 77 | 112 | 95 | 87 | 61 | 110 | 124 | 118 |
| Total | 923 | 893 | 900 | 753 | 714 | 596 | 704 | 706 | 785 |
| Source: Denver Police Department | |||||||||
| Table G2 – Baker District 7 – Number of Incidents | |||||||||
| 2014 | 2015 | 2016 | 2017 | 2018 | 2019 | 2020 | 2021 | 2022 | |
| Public Disorder | 173 | 165 | 185 | 184 | 147 | 125 | 191 | 186 | 242 |
| Drug/Alcohol | 131 | 128 | 98 | 110 | 103 | 118 | 83 | 56 | 59 |
| Sexual Assault | 8 | 12 | 6 | 13 | 2 | 8 | 8 | 7 | 5 |
| Other Crimes against Persons | 66 | 79 | 55 | 62 | 43 | 45 | 35 | 43 | 59 |
| All Other Crimes | 267 | 206 | 175 | 194 | 127 | 88 | 77 | 60 | 69 |
| White-collar Crime | 16 | 13 | 12 | 22 | 31 | 24 | 10 | 10 | 15 |
| Murder | 0 | 1 | 1 | 0 | 3 | 0 | 0 | 0 | 1 |
| Robbery | 22 | 21 | 13 | 15 | 30 | 20 | 28 | 29 | 29 |
| Aggravated Assault | 39 | 28 | 26 | 34 | 26 | 25 | 35 | 44 | 45 |
| Arson | 3 | 0 | 0 | 4 | 4 | 6 | 4 | 10 | 4 |
| Burglary | 75 | 89 | 120 | 67 | 68 | 50 | 103 | 135 | 123 |
| Larceny | 401 | 230 | 299 | 236 | 268 | 261 | 245 | 280 | 260 |
| Theft from Motor Vehicle | 101 | 91 | 143 | 115 | 114 | 124 | 182 | 209 | 273 |
| Auto Theft | 87 | 90 | 95 | 78 | 71 | 65 | 158 | 194 | 204 |
| Total | 1,389 | 1,153 | 1,228 | 1,134 | 1,037 | 959 | 1,159 | 1,263 | 1,388 |
| Source: Denver Police Department | |||||||||
| Table G3 – College View South Platte District 7 – Number of Incidents | |||||||||
| 2014 | 2015 | 2016 | 2017 | 2018 | 2019 | 2020 | 2021 | 2022 | |
| Public Disorder | 141 | 80 | 123 | 96 | 87 | 90 | 111 | 126 | 127 |
| Drug/Alcohol | 66 | 63 | 37 | 73 | 62 | 89 | 42 | 26 | 33 |
| Sexual Assault | 7 | 6 | 7 | 12 | 11 | 6 | 4 | 6 | 10 |
| Other Crimes against Persons | 84 | 73 | 73 | 66 | 58 | 37 | 54 | 45 | 63 |
| All Other Crimes | 110 | 100 | 118 | 122 | 95 | 122 | 106 | 96 | 96 |
| White-collar Crime | 16 | 12 | 21 | 29 | 14 | 10 | 18 | 11 | 9 |
| Murder | 0 | 2 | 0 | 0 | 0 | 1 | 0 | 2 | 1 |
| Robbery | 22 | 23 | 18 | 18 | 25 | 24 | 18 | 22 | 24 |
| Aggravated Assault | 38 | 32 | 41 | 30 | 29 | 49 | 47 | 56 | 56 |
| Arson | 0 | 1 | 2 | 3 | 2 | 2 | 6 | 0 | 4 |
| Burglary | 58 | 50 | 66 | 39 | 57 | 60 | 64 | 68 | 72 |
| Larceny | 352 | 383 | 296 | 128 | 152 | 202 | 128 | 89 | 104 |
| Theft from Motor Vehicle | 43 | 72 | 103 | 112 | 86 | 93 | 93 | 97 | 81 |
| Auto Theft | 52 | 73 | 70 | 80 | 98 | 64 | 97 | 116 | 126 |
| Total | 989 | 970 | 975 | 808 | 776 | 849 | 788 | 760 | 806 |
| Source: Denver Police Department | |||||||||
| Table G4 – Overland District 7 – Number of Incidents | |||||||||
| 2014 | 2015 | 2016 | 2017 | 2018 | 2019 | 2020 | 2021 | 2022 | |
| Public Disorder | 80 | 79 | 91 | 66 | 81 | 52 | 76 | 85 | 100 |
| Drug/Alcohol | 45 | 32 | 52 | 58 | 48 | 85 | 78 | 37 | 19 |
| Sexual Assault | 4 | 7 | 9 | 4 | 3 | 9 | 4 | 5 | 7 |
| Other Crimes against Persons | 47 | 31 | 39 | 25 | 26 | 20 | 26 | 21 | 22 |
| All Other Crimes | 101 | 58 | 56 | 67 | 55 | 38 | 42 | 39 | 32 |
| White-collar Crime | 8 | 9 | 12 | 5 | 11 | 12 | 9 | 2 | 4 |
| Murder | 0 | 0 | 0 | 1 | 0 | 0 | 1 | 1 | 0 |
| Robbery | 8 | 5 | 4 | 5 | 12 | 7 | 11 | 8 | 4 |
| Aggravated Assault | 19 | 17 | 19 | 22 | 17 | 13 | 23 | 24 | 19 |
| Arson | 1 | 1 | 0 | 1 | 4 | 1 | 4 | 2 | 2 |
| Burglary | 54 | 49 | 60 | 50 | 58 | 52 | 89 | 78 | 98 |
| Larceny | 61 | 53 | 62 | 50 | 69 | 54 | 80 | 69 | 69 |
| Theft from Motor Vehicle | 53 | 45 | 66 | 71 | 75 | 82 | 123 | 118 | 118 |
| Auto Theft | 22 | 39 | 45 | 44 | 44 | 57 | 92 | 76 | 110 |
| Total | 503 | 425 | 515 | 469 | 503 | 482 | 658 | 565 | 604 |
| Source: Denver Police Department | |||||||||
| Table G5 – Platt Park District 7 – Number of Incidents | |||||||||
| 2014 | 2015 | 2016 | 2017 | 2018 | 2019 | 2020 | 2021 | 2022 | |
| Public Disorder | 57 | 43 | 36 | 54 | 61 | 50 | 68 | 66 | 69 |
| Drug/Alcohol | 33 | 27 | 23 | 22 | 17 | 30 | 6 | 5 | 13 |
| Sexual Assault | 4 | 5 | 6 | 2 | 2 | 4 | 1 | 5 | 4 |
| Other Crimes against Persons | 21 | 22 | 17 | 13 | 15 | 10 | 10 | 9 | 9 |
| All Other Crimes | 43 | 23 | 30 | 30 | 31 | 16 | 13 | 25 | 17 |
| White-collar Crime | 12 | 18 | 8 | 6 | 8 | 11 | 4 | 5 | 6 |
| Murder | 0 | 1 | 0 | 0 | 0 | 0 | 0 | 1 | 0 |
| Robbery | 4 | 6 | 13 | 6 | 4 | 6 | 4 | 5 | 6 |
| Aggravated Assault | 4 | 6 | 3 | 6 | 5 | 3 | 8 | 4 | 8 |
| Arson | 0 | 0 | 0 | 2 | 2 | 0 | 2 | 1 | 0 |
| Burglary | 82 | 80 | 84 | 51 | 59 | 43 | 77 | 66 | 79 |
| Larceny | 41 | 54 | 56 | 53 | 59 | 58 | 74 | 77 | 86 |
| Theft from Motor Vehicle | 73 | 76 | 68 | 55 | 113 | 72 | 162 | 150 | 143 |
| Auto Theft | 23 | 39 | 39 | 30 | 33 | 41 | 71 | 69 | 83 |
| Total | 397 | 400 | 383 | 330 | 409 | 344 | 500 | 488 | 523 |
| Source: Denver Police Department | |||||||||
| Table G6 – Speer District 7 – Number of Incidents | |||||||||
| 2014 | 2015 | 2016 | 2017 | 2018 | 2019 | 2020 | 2021 | 2022 | |
| Public Disorder | 92 | 84 | 92 | 106 | 74 | 81 | 92 | 157 | 148 |
| Drug/Alcohol | 36 | 25 | 34 | 45 | 29 | 25 | 8 | 9 | 11 |
| Sexual Assault | 4 | 6 | 8 | 4 | 8 | 7 | 6 | 9 | 11 |
| Other Crimes against Persons | 31 | 38 | 33 | 32 | 21 | 27 | 18 | 25 | 29 |
| All Other Crimes | 93 | 62 | 81 | 101 | 86 | 60 | 41 | 30 | 43 |
| White-collar Crime | 6 | 11 | 11 | 16 | 19 | 13 | 18 | 6 | 13 |
| Murder | 0 | 0 | 0 | 1 | 0 | 1 | 0 | 1 | 0 |
| Robbery | 11 | 8 | 13 | 10 | 11 | 6 | 11 | 8 | 20 |
| Aggravated Assault | 12 | 6 | 10 | 11 | 11 | 10 | 13 | 22 | 18 |
| Arson | 1 | 0 | 1 | 1 | 0 | 0 | 1 | 1 | 4 |
| Burglary | 73 | 76 | 81 | 57 | 69 | 48 | 66 | 83 | 68 |
| Larceny | 104 | 106 | 123 | 119 | 131 | 145 | 181 | 146 | 157 |
| Theft from Motor Vehicle | 71 | 68 | 87 | 92 | 135 | 113 | 202 | 232 | 230 |
| Auto Theft | 53 | 62 | 55 | 55 | 62 | 61 | 116 | 176 | 184 |
| Total | 586 | 550 | 628 | 650 | 655 | 596 | 772 | 906 | 933 |
| Source: Denver Police Department | |||||||||
| Table G7 – Washington Park West District 7 – Number of Incidents | |||||||||
| 2014 | 2015 | 2016 | 2017 | 2018 | 2019 | 2020 | 2021 | 2022 | |
| Public Disorder | 76 | 75 | 68 | 42 | 50 | 43 | 56 | 88 | 103 |
| Drug/Alcohol | 17 | 20 | 20 | 15 | 13 | 13 | 7 | 11 | 12 |
| Sexual Assault | 1 | 1 | 5 | 2 | 0 | 3 | 1 | 4 | 5 |
| Other Crimes against Persons | 16 | 10 | 17 | 13 | 6 | 10 | 8 | 8 | 15 |
| All Other Crimes | 68 | 27 | 26 | 29 | 21 | 15 | 21 | 17 | 15 |
| White-collar Crime | 7 | 8 | 6 | 11 | 8 | 15 | 8 | 8 | 6 |
| Murder | 0 | 0 | 0 | 0 | 0 | 0 | 0 | 1 | 0 |
| Robbery | 2 | 3 | 3 | 4 | 4 | 0 | 2 | 2 | 2 |
| Aggravated Assault | 3 | 8 | 2 | 4 | 3 | 5 | 11 | 11 | 8 |
| Arson | 1 | 0 | 0 | 0 | 0 | 1 | 0 | 0 | 0 |
| Burglary | 72 | 75 | 72 | 76 | 39 | 40 | 64 | 83 | 64 |
| Larceny | 60 | 51 | 55 | 66 | 52 | 63 | 106 | 78 | 106 |
| Theft from Motor Vehicle | 79 | 77 | 92 | 76 | 102 | 99 | 156 | 195 | 186 |
| Auto Theft | 27 | 53 | 48 | 31 | 33 | 39 | 86 | 104 | 106 |
| Total | 429 | 408 | 414 | 369 | 331 | 346 | 526 | 610 | 628 |
| Source: Denver Police Department | |||||||||
| Table G8 – Sun Valley District 7 – Number of Incidents | |||||||||
| 2014 | 2015 | 2016 | 2017 | 2018 | 2019 | 2020 | 2021 | 2022 | |
| Public Disorder | 12 | 13 | 10 | 9 | 6 | 7 | 6 | 6 | 8 |
| Drug/Alcohol | 3 | 3 | 8 | 9 | 8 | 5 | 2 | 2 | 2 |
| Sexual Assault | 1 | 1 | 1 | 1 | 1 | 0 | 1 | 0 | 0 |
| Other Crimes against Persons | 7 | 9 | 6 | 7 | 3 | 2 | 3 | 3 | 4 |
| All Other Crimes | 9 | 11 | 15 | 11 | 11 | 8 | 7 | 9 | 7 |
| White-collar Crime | 0 | 1 | 1 | 0 | 1 | 0 | 0 | 0 | 0 |
| Murder | 0 | 0 | 0 | 0 | 0 | 0 | 0 | 0 | 0 |
| Robbery | 1 | 1 | 1 | 2 | 1 | 2 | 2 | 1 | 1 |
| Aggravated Assault | 3 | 3 | 2 | 4 | 4 | 2 | 2 | 2 | 4 |
| Arson | 0 | 0 | 0 | 0 | 0 | 0 | 0 | 0 | 0 |
| Burglary | 1 | 2 | 3 | 2 | 1 | 1 | 3 | 3 | 3 |
| Larceny | 6 | 5 | 7 | 5 | 5 | 7 | 3 | 4 | 5 |
| Theft from Motor Vehicle | 3 | 3 | 4 | 2 | 2 | 2 | 3 | 4 | 5 |
| Auto Theft | 3 | 2 | 4 | 3 | 3 | 3 | 2 | 4 | 7 |
| Total | 49 | 55 | 61 | 54 | 46 | 39 | 35 | 38 | 46 |
| Source: Denver Police Department | |||||||||
| Table G9 – Harvey Park District 7 – Number of Incidents | |||||||||
| 2014 | 2015 | 2016 | 2017 | 2018 | 2019 | 2020 | 2021 | 2022 | |
| Public Disorder | 117 | 121 | 137 | 137 | 95 | 66 | 102 | 78 | 92 |
| Drug/Alcohol | 33 | 26 | 37 | 34 | 50 | 54 | 23 | 10 | 14 |
| Sexual Assault | 9 | 8 | 9 | 8 | 11 | 10 | 6 | 6 | 7 |
| Other Crimes against Persons | 45 | 73 | 54 | 45 | 27 | 31 | 32 | 24 | 46 |
| All Other Crimes | 52 | 63 | 67 | 85 | 67 | 68 | 87 | 60 | 54 |
| White-collar Crime | 13 | 11 | 10 | 14 | 6 | 12 | 15 | 9 | 3 |
| Murder | 1 | 0 | 0 | 1 | 1 | 1 | 2 | 0 | 0 |
| Robbery | 14 | 17 | 7 | 13 | 13 | 16 | 12 | 13 | 4 |
| Aggravated Assault | 22 | 22 | 24 | 28 | 35 | 25 | 50 | 34 | 49 |
| Arson | 0 | 2 | 2 | 3 | 1 | 1 | 0 | 5 | 3 |
| Burglary | 43 | 46 | 45 | 42 | 29 | 26 | 41 | 42 | 36 |
| Larceny | 62 | 57 | 49 | 53 | 46 | 63 | 75 | 52 | 53 |
| Theft from Motor Vehicle | 52 | 64 | 99 | 86 | 105 | 71 | 74 | 100 | 84 |
| Auto Theft | 54 | 51 | 56 | 72 | 68 | 43 | 67 | 92 | 86 |
| Total | 516 | 560 | 597 | 621 | 554 | 486 | 586 | 526 | 531 |
| Source: Denver Police Department | |||||||||
| Table G10 – Mar Lee District 7 – Number of Incidents | |||||||||
| 2014 | 2015 | 2016 | 2017 | 2018 | 2019 | 2020 | 2021 | 2022 | |
| Public Disorder | 30 | 29 | 29 | 28 | 24 | 24 | 27 | 19 | 30 |
| Drug/Alcohol | 14 | 10 | 12 | 11 | 18 | 16 | 8 | 4 | 4 |
| Sexual Assault | 1 | 2 | 3 | 3 | 4 | 3 | 3 | 2 | 1 |
| Other Crimes against Persons | 13 | 14 | 14 | 16 | 9 | 12 | 12 | 9 | 11 |
| All Other Crimes | 22 | 18 | 18 | 27 | 31 | 30 | 23 | 23 | 23 |
| White-collar Crime | 6 | 3 | 3 | 4 | 3 | 2 | 4 | 2 | 2 |
| Murder | 0 | 0 | 0 | 0 | 0 | 0 | 1 | 0 | 1 |
| Robbery | 3 | 5 | 3 | 5 | 5 | 3 | 3 | 3 | 4 |
| Aggravated Assault | 7 | 7 | 10 | 8 | 10 | 10 | 10 | 9 | 11 |
| Arson | 0 | 0 | 1 | 1 | 1 | 0 | 1 | 0 | 0 |
| Burglary | 13 | 14 | 13 | 11 | 10 | 10 | 11 | 7 | 9 |
| Larceny | 17 | 18 | 15 | 16 | 14 | 14 | 13 | 13 | 12 |
| Theft from Motor Vehicle | 13 | 16 | 23 | 16 | 20 | 17 | 22 | 27 | 22 |
| Auto Theft | 12 | 19 | 22 | 30 | 21 | 13 | 23 | 26 | 26 |
| Total | 152 | 153 | 167 | 177 | 170 | 155 | 159 | 143 | 157 |
| Source: Denver Police Department | |||||||||
| Table G11 – Ruby Hill District 7 – Number of Incidents | |||||||||
| 2014 | 2015 | 2016 | 2017 | 2018 | 2019 | 2020 | 2021 | 2022 | |
| Public Disorder | 153 | 121 | 119 | 113 | 86 | 74 | 104 | 101 | 100 |
| Drug/Alcohol | 53 | 36 | 51 | 52 | 53 | 70 | 36 | 25 | 30 |
| Sexual Assault | 6 | 8 | 9 | 7 | 14 | 13 | 9 | 5 | 10 |
| Other Crimes against Persons | 54 | 61 | 59 | 59 | 34 | 27 | 39 | 48 | 54 |
| All Other Crimes | 109 | 92 | 95 | 86 | 76 | 81 | 104 | 61 | 100 |
| White-collar Crime | 17 | 13 | 14 | 14 | 13 | 10 | 14 | 11 | 12 |
| Murder | 0 | 2 | 1 | 1 | 1 | 0 | 1 | 2 | 1 |
| Robbery | 12 | 16 | 14 | 11 | 15 | 10 | 10 | 15 | 13 |
| Aggravated Assault | 29 | 30 | 41 | 21 | 40 | 29 | 47 | 50 | 59 |
| Arson | 3 | 3 | 2 | 3 | 4 | 1 | 0 | 1 | 4 |
| Burglary | 61 | 62 | 71 | 53 | 50 | 43 | 49 | 51 | 68 |
| Larceny | 50 | 43 | 32 | 48 | 41 | 57 | 50 | 60 | 47 |
| Theft from Motor Vehicle | 43 | 65 | 104 | 100 | 85 | 83 | 87 | 109 | 85 |
| Auto Theft | 92 | 90 | 86 | 92 | 87 | 71 | 102 | 128 | 127 |
| Total | 682 | 641 | 698 | 660 | 599 | 568 | 651 | 667 | 707 |
| Source: Denver Police Department | |||||||||
| Table G12 – Barnum District 7 – Number of Incidents | |||||||||
| 2014 | 2015 | 2016 | 2017 | 2018 | 2019 | 2020 | 2021 | 2022 | |
| Public Disorder | 14 | 12 | 13 | 11 | 9 | 8 | 6 | 8 | 7 |
| Drug/Alcohol | 4 | 5 | 6 | 6 | 6 | 4 | 4 | 2 | 4 |
| Sexual Assault | 0 | 1 | 1 | 1 | 1 | 1 | 1 | 1 | 0 |
| Other Crimes against Persons | 5 | 5 | 6 | 5 | 3 | 4 | 2 | 2 | 2 |
| All Other Crimes | 11 | 12 | 11 | 17 | 11 | 9 | 12 | 12 | 15 |
| White-collar Crime | 1 | 1 | 1 | 1 | 1 | 1 | 1 | 1 | 1 |
| Murder | 0 | 0 | 0 | 0 | 0 | 0 | 0 | 0 | 0 |
| Robbery | 2 | 2 | 1 | 1 | 2 | 2 | 1 | 1 | 1 |
| Aggravated Assault | 2 | 4 | 3 | 3 | 2 | 3 | 4 | 4 | 5 |
| Arson | 0 | 0 | 0 | 0 | 0 | 0 | 1 | 0 | 0 |
| Burglary | 4 | 7 | 5 | 5 | 2 | 3 | 5 | 3 | 3 |
| Larceny | 4 | 4 | 3 | 4 | 3 | 3 | 4 | 2 | 4 |
| Theft from Motor Vehicle | 6 | 6 | 5 | 7 | 7 | 5 | 6 | 7 | 6 |
| Auto Theft | 7 | 8 | 6 | 6 | 6 | 4 | 6 | 8 | 7 |
| Total | 61 | 67 | 61 | 67 | 53 | 47 | 52 | 51 | 55 |
| Source: Denver Police Department | |||||||||
| Table G13 – Valverde District 7 – Number of Incidents | |||||||||
| 2014 | 2015 | 2016 | 2017 | 2018 | 2019 | 2020 | 2021 | 2022 | |
| Public Disorder | 97 | 65 | 63 | 59 | 53 | 43 | 56 | 59 | 77 |
| Drug/Alcohol | 35 | 46 | 35 | 26 | 40 | 39 | 26 | 23 | 32 |
| Sexual Assault | 5 | 5 | 3 | 4 | 1 | 5 | 6 | 3 | 1 |
| Other Crimes against Persons | 34 | 39 | 25 | 28 | 22 | 16 | 21 | 19 | 17 |
| All Other Crimes | 65 | 54 | 59 | 70 | 50 | 44 | 50 | 73 | 61 |
| White-collar Crime | 4 | 14 | 9 | 7 | 5 | 8 | 5 | 5 | 4 |
| Murder | 0 | 0 | 0 | 1 | 0 | 2 | 0 | 1 | 0 |
| Robbery | 10 | 8 | 6 | 19 | 7 | 11 | 16 | 11 | 10 |
| Aggravated Assault | 24 | 21 | 25 | 23 | 27 | 20 | 29 | 24 | 28 |
| Arson | 2 | 1 | 1 | 4 | 3 | 2 | 4 | 4 | 2 |
| Burglary | 37 | 46 | 41 | 32 | 25 | 34 | 39 | 56 | 62 |
| Larceny | 53 | 33 | 26 | 41 | 36 | 25 | 46 | 31 | 51 |
| Theft from Motor Vehicle | 37 | 41 | 63 | 52 | 57 | 41 | 48 | 85 | 70 |
| Auto Theft | 52 | 59 | 49 | 54 | 72 | 48 | 60 | 72 | 79 |
| Total | 455 | 431 | 404 | 419 | 396 | 338 | 405 | 463 | 495 |
| Source: Denver Police Department | |||||||||
Appendix H: Incidents by Type and Neighborhood District 8
| Table H1 – Central Park District 8 – Number of Incidents | |||||||||
| 2014 | 2015 | 2016 | 2017 | 2018 | 2019 | 2020 | 2021 | 2022 | |
| Public Disorder | 189 | 180 | 220 | 213 | 205 | 225 | 263 | 456 | 553 |
| Drug/Alcohol | 84 | 109 | 183 | 134 | 137 | 177 | 85 | 89 | 65 |
| Sexual Assault | 19 | 22 | 15 | 29 | 15 | 29 | 21 | 24 | 20 |
| Other Crimes against Persons | 85 | 99 | 120 | 130 | 86 | 139 | 118 | 101 | 121 |
| All Other Crimes | 193 | 229 | 263 | 272 | 256 | 214 | 189 | 208 | 182 |
| White-collar Crime | 46 | 53 | 58 | 45 | 52 | 62 | 47 | 34 | 34 |
| Murder | 2 | 0 | 0 | 1 | 1 | 1 | 2 | 5 | 2 |
| Robbery | 25 | 36 | 29 | 47 | 33 | 53 | 71 | 52 | 67 |
| Aggravated Assault | 43 | 51 | 40 | 36 | 40 | 51 | 71 | 99 | 119 |
| Arson | 3 | 0 | 0 | 3 | 3 | 0 | 4 | 4 | 4 |
| Burglary | 137 | 139 | 148 | 142 | 212 | 176 | 206 | 293 | 229 |
| Larceny | 902 | 823 | 810 | 831 | 895 | 924 | 807 | 874 | 932 |
| Theft from Motor Vehicle | 190 | 240 | 186 | 209 | 266 | 317 | 374 | 607 | 727 |
| Auto Theft | 108 | 131 | 115 | 169 | 176 | 238 | 364 | 653 | 974 |
| Total | 2,026 | 2,112 | 2,187 | 2,261 | 2,377 | 2,606 | 2,622 | 3,499 | 4,029 |
| Source: Denver Police Department | |||||||||
| Table H2 – Montbello District 8 – Number of Incidents | |||||||||
| 2014 | 2015 | 2016 | 2017 | 2018 | 2019 | 2020 | 2021 | 2022 | |
| Public Disorder | 240 | 228 | 250 | 180 | 146 | 153 | 167 | 160 | 169 |
| Drug/Alcohol | 30 | 58 | 65 | 69 | 79 | 60 | 30 | 34 | 26 |
| Sexual Assault | 17 | 15 | 14 | 15 | 18 | 19 | 14 | 11 | 12 |
| Other Crimes against Persons | 116 | 132 | 120 | 107 | 67 | 72 | 61 | 39 | 54 |
| All Other Crimes | 138 | 132 | 178 | 184 | 171 | 186 | 187 | 162 | 167 |
| White-collar Crime | 20 | 26 | 20 | 23 | 18 | 27 | 22 | 11 | 17 |
| Murder | 0 | 2 | 3 | 1 | 2 | 1 | 2 | 3 | 1 |
| Robbery | 27 | 38 | 27 | 21 | 23 | 26 | 17 | 22 | 26 |
| Aggravated Assault | 59 | 50 | 62 | 48 | 60 | 69 | 86 | 84 | 90 |
| Arson | 5 | 5 | 4 | 4 | 4 | 4 | 3 | 4 | 3 |
| Burglary | 77 | 64 | 54 | 52 | 37 | 40 | 43 | 55 | 69 |
| Larceny | 87 | 80 | 92 | 64 | 70 | 74 | 74 | 69 | 89 |
| Theft from Motor Vehicle | 137 | 118 | 112 | 95 | 121 | 98 | 107 | 159 | 161 |
| Auto Theft | 75 | 68 | 76 | 114 | 100 | 106 | 154 | 245 | 272 |
| Total | 1,025 | 1,010 | 1,074 | 974 | 912 | 933 | 965 | 1,056 | 1,154 |
| Source: Denver Police Department | |||||||||
| Table H3 – Northeast Park Hill District 8 – Number of Incidents | |||||||||
| 2014 | 2015 | 2016 | 2017 | 2018 | 2019 | 2020 | 2021 | 2022 | |
| Public Disorder | 143 | 147 | 136 | 149 | 119 | 118 | 155 | 194 | 224 |
| Drug/Alcohol | 49 | 52 | 54 | 46 | 37 | 50 | 35 | 29 | 35 |
| Sexual Assault | 13 | 9 | 11 | 14 | 11 | 14 | 16 | 13 | 15 |
| Other Crimes against Persons | 71 | 80 | 88 | 72 | 58 | 63 | 77 | 66 | 88 |
| All Other Crimes | 96 | 130 | 114 | 120 | 131 | 116 | 149 | 165 | 135 |
| White-collar Crime | 18 | 24 | 20 | 21 | 23 | 12 | 30 | 31 | 36 |
| Murder | 2 | 4 | 2 | 2 | 2 | 5 | 2 | 2 | 0 |
| Robbery | 13 | 15 | 18 | 14 | 14 | 14 | 14 | 13 | 16 |
| Aggravated Assault | 44 | 65 | 52 | 44 | 60 | 33 | 71 | 51 | 81 |
| Arson | 0 | 4 | 2 | 2 | 2 | 1 | 2 | 5 | 5 |
| Burglary | 68 | 51 | 60 | 43 | 65 | 51 | 86 | 119 | 95 |
| Larceny | 72 | 75 | 84 | 86 | 100 | 100 | 119 | 115 | 140 |
| Theft from Motor Vehicle | 72 | 87 | 113 | 113 | 127 | 132 | 170 | 256 | 224 |
| Auto Theft | 74 | 76 | 102 | 104 | 109 | 128 | 185 | 317 | 356 |
| Total | 734 | 818 | 856 | 829 | 856 | 835 | 1,111 | 1,373 | 1,450 |
| Source: Denver Police Department | |||||||||
| Table H4 – North Park Hill District 8 – Number of Incidents | |||||||||
| 2014 | 2015 | 2016 | 2017 | 2018 | 2019 | 2020 | 2021 | 2022 | |
| Public Disorder | 69 | 101 | 95 | 58 | 49 | 46 | 42 | 77 | 68 |
| Drug/Alcohol | 23 | 22 | 19 | 18 | 9 | 10 | 6 | 3 | 12 |
| Sexual Assault | 4 | 3 | 4 | 6 | 3 | 5 | 7 | 5 | 4 |
| Other Crimes against Persons | 37 | 24 | 24 | 28 | 19 | 18 | 17 | 17 | 22 |
| All Other Crimes | 52 | 44 | 63 | 49 | 46 | 47 | 41 | 37 | 36 |
| White-collar Crime | 7 | 16 | 12 | 8 | 6 | 5 | 11 | 10 | 10 |
| Murder | 1 | 1 | 0 | 1 | 1 | 0 | 2 | 0 | 0 |
| Robbery | 6 | 11 | 8 | 5 | 7 | 4 | 10 | 6 | 1 |
| Aggravated Assault | 14 | 17 | 17 | 20 | 16 | 12 | 29 | 18 | 15 |
| Arson | 3 | 2 | 2 | 1 | 1 | 0 | 1 | 0 | 0 |
| Burglary | 70 | 59 | 80 | 41 | 63 | 88 | 45 | 58 | 33 |
| Larceny | 68 | 54 | 45 | 34 | 31 | 51 | 58 | 67 | 45 |
| Theft from Motor Vehicle | 32 | 56 | 51 | 72 | 80 | 64 | 64 | 115 | 86 |
| Auto Theft | 33 | 28 | 28 | 34 | 55 | 49 | 56 | 74 | 96 |
| Total | 419 | 438 | 448 | 375 | 386 | 399 | 389 | 487 | 428 |
| Source: Denver Police Department | |||||||||
| Table H5 – Skyland District 8 – Number of Incidents | |||||||||
| 2014 | 2015 | 2016 | 2017 | 2018 | 2019 | 2020 | 2021 | 2022 | |
| Public Disorder | 22 | 22 | 17 | 22 | 12 | 11 | 20 | 16 | 16 |
| Drug/Alcohol | 14 | 13 | 7 | 4 | 5 | 4 | 2 | 1 | 1 |
| Sexual Assault | 2 | 0 | 2 | 1 | 1 | 2 | 0 | 1 | 1 |
| Other Crimes against Persons | 9 | 14 | 8 | 10 | 3 | 4 | 10 | 7 | 10 |
| All Other Crimes | 15 | 24 | 20 | 15 | 12 | 11 | 15 | 20 | 16 |
| White-collar Crime | 5 | 2 | 2 | 2 | 1 | 3 | 2 | 1 | 1 |
| Murder | 0 | 1 | 0 | 1 | 0 | 1 | 1 | 0 | 0 |
| Robbery | 1 | 3 | 6 | 3 | 3 | 1 | 0 | 4 | 2 |
| Aggravated Assault | 5 | 8 | 6 | 4 | 3 | 3 | 4 | 6 | 5 |
| Arson | 1 | 0 | 1 | 0 | 1 | 1 | 0 | 0 | 0 |
| Burglary | 11 | 20 | 17 | 14 | 9 | 6 | 16 | 13 | 8 |
| Larceny | 13 | 12 | 7 | 7 | 10 | 8 | 11 | 16 | 16 |
| Theft from Motor Vehicle | 6 | 10 | 14 | 18 | 12 | 14 | 23 | 25 | 18 |
| Auto Theft | 8 | 7 | 4 | 12 | 5 | 7 | 12 | 14 | 29 |
| Total | 108 | 133 | 108 | 110 | 75 | 72 | 114 | 121 | 120 |
| Source: Denver Police Department | |||||||||
| Table H6 – South Park Hill District 8 – Number of Incidents | |||||||||
| 2014 | 2015 | 2016 | 2017 | 2018 | 2019 | 2020 | 2021 | 2022 | |
| Public Disorder | 81 | 109 | 99 | 76 | 76 | 58 | 82 | 90 | 90 |
| Drug/Alcohol | 35 | 21 | 28 | 28 | 21 | 9 | 7 | 14 | 9 |
| Sexual Assault | 9 | 7 | 3 | 5 | 11 | 7 | 3 | 5 | 5 |
| Other Crimes against Persons | 28 | 28 | 32 | 32 | 24 | 23 | 21 | 22 | 24 |
| All Other Crimes | 36 | 39 | 43 | 54 | 33 | 28 | 23 | 46 | 32 |
| White-collar Crime | 13 | 11 | 9 | 8 | 8 | 9 | 7 | 6 | 6 |
| Murder | 0 | 0 | 0 | 1 | 1 | 1 | 1 | 1 | 2 |
| Robbery | 14 | 16 | 23 | 13 | 8 | 13 | 12 | 12 | 8 |
| Aggravated Assault | 6 | 12 | 13 | 10 | 10 | 8 | 14 | 20 | 15 |
| Arson | 1 | 2 | 0 | 0 | 0 | 1 | 2 | 1 | 0 |
| Burglary | 49 | 90 | 47 | 52 | 59 | 45 | 43 | 41 | 54 |
| Larceny | 68 | 54 | 43 | 64 | 53 | 47 | 91 | 65 | 69 |
| Theft from Motor Vehicle | 43 | 72 | 48 | 67 | 79 | 69 | 80 | 137 | 129 |
| Auto Theft | 22 | 39 | 28 | 41 | 41 | 42 | 77 | 99 | 90 |
| Total | 405 | 500 | 416 | 451 | 424 | 360 | 463 | 559 | 533 |
| Source: Denver Police Department | |||||||||
| Table H7 – East Colfax District 8 – Number of Incidents | |||||||||
| 2014 | 2015 | 2016 | 2017 | 2018 | 2019 | 2020 | 2021 | 2022 | |
| Public Disorder | 45 | 47 | 63 | 65 | 43 | 35 | 32 | 51 | 58 |
| Drug/Alcohol | 102 | 73 | 87 | 80 | 95 | 36 | 21 | 20 | 16 |
| Sexual Assault | 4 | 4 | 3 | 6 | 4 | 4 | 3 | 4 | 3 |
| Other Crimes against Persons | 23 | 23 | 22 | 20 | 17 | 15 | 15 | 15 | 14 |
| All Other Crimes | 65 | 54 | 80 | 93 | 65 | 41 | 56 | 71 | 66 |
| White-collar Crime | 2 | 3 | 4 | 2 | 5 | 4 | 4 | 4 | 4 |
| Murder | 0 | 1 | 0 | 1 | 0 | 1 | 2 | 1 | 1 |
| Robbery | 11 | 8 | 9 | 12 | 11 | 8 | 9 | 9 | 9 |
| Aggravated Assault | 12 | 13 | 14 | 13 | 16 | 12 | 21 | 23 | 24 |
| Arson | 2 | 1 | 1 | 1 | 1 | 1 | 0 | 1 | 1 |
| Burglary | 17 | 23 | 20 | 22 | 17 | 13 | 20 | 25 | 22 |
| Larceny | 19 | 15 | 24 | 25 | 17 | 16 | 25 | 23 | 20 |
| Theft from Motor Vehicle | 14 | 14 | 17 | 27 | 23 | 25 | 35 | 39 | 37 |
| Auto Theft | 10 | 15 | 19 | 25 | 20 | 22 | 46 | 53 | 60 |
| Total | 325 | 294 | 363 | 391 | 334 | 232 | 288 | 340 | 334 |
| Source: Denver Police Department | |||||||||
Appendix I: Incidents by Type and Neighborhood District 9
| Table I1 – CBD District 9 – Number of Incidents | |||||||||
| 2014 | 2015 | 2016 | 2017 | 2018 | 2019 | 2020 | 2021 | 2022 | |
| Public Disorder | 322 | 327 | 366 | 327 | 312 | 367 | 434 | 500 | 406 |
| Drug/Alcohol | 584 | 571 | 369 | 267 | 207 | 214 | 94 | 137 | 290 |
| Sexual Assault | 30 | 38 | 36 | 43 | 21 | 24 | 24 | 33 | 28 |
| Other Crimes against Persons | 193 | 201 | 206 | 175 | 140 | 203 | 162 | 161 | 185 |
| All Other Crimes | 1,127 | 844 | 837 | 818 | 497 | 645 | 410 | 384 | 466 |
| White-collar Crime | 33 | 60 | 51 | 55 | 41 | 53 | 34 | 28 | 25 |
| Murder | 0 | 0 | 1 | 0 | 4 | 0 | 2 | 1 | 0 |
| Robbery | 67 | 80 | 72 | 53 | 48 | 64 | 55 | 65 | 57 |
| Aggravated Assault | 65 | 72 | 90 | 57 | 71 | 88 | 126 | 149 | 99 |
| Arson | 0 | 0 | 2 | 2 | 2 | 5 | 5 | 11 | 1 |
| Burglary | 50 | 60 | 55 | 52 | 41 | 50 | 106 | 98 | 73 |
| Larceny | 815 | 701 | 697 | 655 | 607 | 749 | 503 | 606 | 487 |
| Theft from Motor Vehicle | 94 | 118 | 122 | 126 | 122 | 137 | 216 | 329 | 377 |
| Auto Theft | 48 | 42 | 56 | 62 | 63 | 71 | 116 | 225 | 279 |
| Total | 3,428 | 3,114 | 2,960 | 2,692 | 2,176 | 2,670 | 2,287 | 2,727 | 2,773 |
| Source: Denver Police Department | |||||||||
| Table I2 – City Park District 9 – Number of Incidents | |||||||||
| 2014 | 2015 | 2016 | 2017 | 2018 | 2019 | 2020 | 2021 | 2022 | |
| Public Disorder | 62 | 55 | 55 | 65 | 56 | 72 | 62 | 58 | 74 |
| Drug/Alcohol | 52 | 32 | 28 | 19 | 20 | 13 | 11 | 6 | 7 |
| Sexual Assault | 5 | 5 | 8 | 12 | 9 | 9 | 3 | 4 | 4 |
| Other Crimes against Persons | 26 | 23 | 21 | 23 | 13 | 12 | 15 | 12 | 19 |
| All Other Crimes | 47 | 41 | 42 | 39 | 26 | 27 | 15 | 18 | 15 |
| White-collar Crime | 3 | 8 | 4 | 7 | 8 | 8 | 2 | 3 | 5 |
| Murder | 0 | 0 | 0 | 0 | 0 | 1 | 0 | 0 | 1 |
| Robbery | 5 | 6 | 7 | 6 | 8 | 8 | 6 | 4 | 5 |
| Aggravated Assault | 5 | 8 | 13 | 5 | 15 | 11 | 8 | 10 | 12 |
| Arson | 0 | 0 | 0 | 0 | 1 | 1 | 3 | 1 | 1 |
| Burglary | 10 | 10 | 29 | 25 | 14 | 29 | 26 | 22 | 27 |
| Larceny | 48 | 54 | 51 | 59 | 87 | 85 | 93 | 89 | 62 |
| Theft from Motor Vehicle | 32 | 30 | 24 | 43 | 51 | 46 | 49 | 72 | 97 |
| Auto Theft | 12 | 18 | 10 | 27 | 20 | 16 | 38 | 56 | 72 |
| Total | 307 | 290 | 292 | 330 | 328 | 338 | 331 | 355 | 401 |
| Source: Denver Police Department | |||||||||
| Table I3 – City Park West District 9 – Number of Incidents | |||||||||
| 2014 | 2015 | 2016 | 2017 | 2018 | 2019 | 2020 | 2021 | 2022 | |
| Public Disorder | 186 | 130 | 140 | 146 | 132 | 140 | 147 | 145 | 221 |
| Drug/Alcohol | 119 | 160 | 188 | 154 | 184 | 72 | 41 | 38 | 42 |
| Sexual Assault | 9 | 16 | 13 | 13 | 12 | 16 | 9 | 8 | 10 |
| Other Crimes against Persons | 75 | 68 | 84 | 87 | 62 | 59 | 60 | 56 | 56 |
| All Other Crimes | 130 | 122 | 155 | 172 | 167 | 137 | 120 | 89 | 110 |
| White-collar Crime | 12 | 11 | 11 | 16 | 7 | 15 | 8 | 7 | 13 |
| Murder | 0 | 1 | 0 | 0 | 1 | 2 | 1 | 0 | 2 |
| Robbery | 23 | 9 | 14 | 20 | 20 | 22 | 9 | 18 | 25 |
| Aggravated Assault | 26 | 36 | 38 | 27 | 42 | 40 | 52 | 60 | 57 |
| Arson | 4 | 0 | 2 | 1 | 0 | 2 | 1 | 0 | 3 |
| Burglary | 51 | 51 | 56 | 55 | 49 | 65 | 77 | 82 | 76 |
| Larceny | 106 | 82 | 109 | 107 | 109 | 170 | 147 | 138 | 144 |
| Theft from Motor Vehicle | 54 | 52 | 60 | 81 | 50 | 85 | 121 | 126 | 148 |
| Auto Theft | 33 | 50 | 40 | 45 | 38 | 42 | 76 | 109 | 163 |
| Total | 828 | 788 | 910 | 924 | 873 | 867 | 869 | 876 | 1,070 |
| Source: Denver Police Department | |||||||||
| Table I4 – Clayton District 9 – Number of Incidents | |||||||||
| 2014 | 2015 | 2016 | 2017 | 2018 | 2019 | 2020 | 2021 | 2022 | |
| Public Disorder | 122 | 98 | 77 | 88 | 58 | 70 | 80 | 50 | 80 |
| Drug/Alcohol | 33 | 48 | 39 | 32 | 24 | 37 | 22 | 19 | 14 |
| Sexual Assault | 3 | 5 | 5 | 8 | 3 | 7 | 2 | 6 | 1 |
| Other Crimes against Persons | 40 | 37 | 37 | 49 | 17 | 36 | 21 | 23 | 26 |
| All Other Crimes | 69 | 95 | 69 | 83 | 89 | 63 | 79 | 107 | 123 |
| White-collar Crime | 14 | 4 | 11 | 10 | 8 | 7 | 7 | 4 | 2 |
| Murder | 0 | 1 | 0 | 0 | 2 | 1 | 0 | 3 | 1 |
| Robbery | 5 | 3 | 6 | 8 | 14 | 8 | 19 | 11 | 10 |
| Aggravated Assault | 13 | 30 | 27 | 24 | 19 | 17 | 34 | 26 | 26 |
| Arson | 1 | 5 | 1 | 1 | 1 | 1 | 1 | 1 | 0 |
| Burglary | 33 | 31 | 49 | 45 | 38 | 35 | 26 | 39 | 30 |
| Larceny | 51 | 43 | 56 | 58 | 45 | 49 | 77 | 46 | 70 |
| Theft from Motor Vehicle | 34 | 39 | 55 | 45 | 37 | 55 | 49 | 51 | 68 |
| Auto Theft | 21 | 36 | 42 | 54 | 35 | 36 | 45 | 66 | 93 |
| Total | 439 | 475 | 474 | 505 | 390 | 422 | 462 | 452 | 544 |
| Source: Denver Police Department | |||||||||
| Table I5 – Cole District 9 – Number of Incidents | |||||||||
| 2014 | 2015 | 2016 | 2017 | 2018 | 2019 | 2020 | 2021 | 2022 | |
| Public Disorder | 131 | 124 | 102 | 77 | 59 | 60 | 78 | 88 | 75 |
| Drug/Alcohol | 132 | 88 | 53 | 55 | 48 | 29 | 10 | 5 | 11 |
| Sexual Assault | 3 | 5 | 3 | 7 | 10 | 6 | 3 | 3 | 3 |
| Other Crimes against Persons | 46 | 38 | 47 | 39 | 25 | 26 | 21 | 20 | 19 |
| All Other Crimes | 149 | 167 | 90 | 94 | 85 | 69 | 59 | 66 | 68 |
| White-collar Crime | 3 | 10 | 2 | 9 | 3 | 11 | 9 | 9 | 1 |
| Murder | 2 | 6 | 0 | 1 | 1 | 0 | 0 | 0 | 1 |
| Robbery | 16 | 12 | 12 | 15 | 7 | 14 | 13 | 13 | 5 |
| Aggravated Assault | 31 | 34 | 34 | 30 | 28 | 24 | 26 | 31 | 39 |
| Arson | 1 | 2 | 3 | 0 | 3 | 0 | 5 | 3 | 0 |
| Burglary | 42 | 43 | 43 | 43 | 30 | 27 | 43 | 52 | 27 |
| Larceny | 46 | 40 | 40 | 50 | 45 | 49 | 56 | 62 | 45 |
| Theft from Motor Vehicle | 30 | 17 | 33 | 45 | 50 | 61 | 54 | 49 | 67 |
| Auto Theft | 18 | 25 | 42 | 32 | 45 | 33 | 50 | 73 | 102 |
| Total | 650 | 611 | 504 | 497 | 439 | 409 | 427 | 474 | 463 |
| Source: Denver Police Department | |||||||||
| Table I6 – Elyria Swansea District 9 – Number of Incidents | |||||||||
| 2014 | 2015 | 2016 | 2017 | 2018 | 2019 | 2020 | 2021 | 2022 | |
| Public Disorder | 144 | 141 | 136 | 108 | 92 | 97 | 129 | 125 | 155 |
| Drug/Alcohol | 30 | 39 | 73 | 43 | 52 | 49 | 25 | 23 | 27 |
| Sexual Assault | 6 | 9 | 13 | 7 | 3 | 3 | 16 | 9 | 10 |
| Other Crimes against Persons | 49 | 69 | 62 | 58 | 36 | 37 | 42 | 49 | 56 |
| All Other Crimes | 109 | 127 | 114 | 120 | 61 | 97 | 105 | 106 | 93 |
| White-collar Crime | 15 | 20 | 13 | 16 | 14 | 9 | 20 | 10 | 8 |
| Murder | 0 | 0 | 4 | 2 | 0 | 2 | 4 | 2 | 1 |
| Robbery | 7 | 12 | 14 | 14 | 13 | 8 | 19 | 15 | 16 |
| Aggravated Assault | 36 | 37 | 40 | 40 | 30 | 24 | 67 | 80 | 66 |
| Arson | 1 | 3 | 4 | 8 | 3 | 2 | 7 | 6 | 2 |
| Burglary | 67 | 88 | 77 | 66 | 62 | 68 | 102 | 111 | 66 |
| Larceny | 83 | 84 | 75 | 99 | 86 | 64 | 81 | 71 | 101 |
| Theft from Motor Vehicle | 42 | 81 | 84 | 87 | 85 | 82 | 102 | 130 | 165 |
| Auto Theft | 49 | 120 | 147 | 97 | 97 | 108 | 146 | 242 | 248 |
| Total | 638 | 830 | 856 | 765 | 634 | 650 | 865 | 979 | 1,014 |
| Source: Denver Police Department | |||||||||
| Table I7 – Five Points District 9 – Number of Incidents | |||||||||
| 2014 | 2015 | 2016 | 2017 | 2018 | 2019 | 2020 | 2021 | 2022 | |
| Public Disorder | 460 | 459 | 525 | 580 | 479 | 580 | 627 | 735 | 810 |
| Drug/Alcohol | 700 | 887 | 894 | 742 | 544 | 461 | 191 | 172 | 106 |
| Sexual Assault | 45 | 52 | 61 | 64 | 46 | 64 | 44 | 35 | 44 |
| Other Crimes against Persons | 238 | 306 | 340 | 364 | 272 | 356 | 226 | 242 | 309 |
| All Other Crimes | 518 | 677 | 716 | 668 | 550 | 675 | 523 | 462 | 443 |
| White-collar Crime | 24 | 42 | 53 | 39 | 35 | 43 | 37 | 32 | 25 |
| Murder | 0 | 2 | 4 | 5 | 6 | 3 | 4 | 3 | 6 |
| Robbery | 90 | 74 | 76 | 90 | 79 | 86 | 49 | 74 | 67 |
| Aggravated Assault | 127 | 141 | 187 | 188 | 180 | 229 | 244 | 218 | 292 |
| Arson | 0 | 4 | 5 | 5 | 3 | 4 | 12 | 16 | 13 |
| Burglary | 158 | 162 | 214 | 172 | 158 | 197 | 271 | 359 | 261 |
| Larceny | 398 | 450 | 518 | 580 | 556 | 582 | 558 | 628 | 569 |
| Theft from Motor Vehicle | 262 | 305 | 379 | 500 | 381 | 488 | 674 | 755 | 869 |
| Auto Theft | 134 | 172 | 213 | 202 | 168 | 201 | 316 | 492 | 735 |
| Total | 3,154 | 3,733 | 4,185 | 4,199 | 3,457 | 3,969 | 3,776 | 4,223 | 4,549 |
| Source: Denver Police Department | |||||||||
| Table I8 – Union Station District 9 – Number of Incidents | |||||||||
| 2014 | 2015 | 2016 | 2017 | 2018 | 2019 | 2020 | 2021 | 2022 | |
| Public Disorder | 216 | 261 | 238 | 265 | 190 | 225 | 243 | 355 | 320 |
| Drug/Alcohol | 109 | 113 | 107 | 80 | 75 | 103 | 78 | 206 | 670 |
| Sexual Assault | 17 | 18 | 27 | 33 | 31 | 25 | 13 | 28 | 43 |
| Other Crimes against Persons | 162 | 169 | 184 | 173 | 136 | 192 | 130 | 183 | 196 |
| All Other Crimes | 380 | 323 | 394 | 390 | 314 | 419 | 347 | 410 | 437 |
| White-collar Crime | 14 | 24 | 21 | 25 | 36 | 33 | 22 | 30 | 32 |
| Murder | 0 | 0 | 2 | 3 | 1 | 3 | 0 | 2 | 2 |
| Robbery | 29 | 44 | 55 | 35 | 39 | 32 | 60 | 67 | 52 |
| Aggravated Assault | 76 | 107 | 79 | 99 | 82 | 83 | 99 | 127 | 127 |
| Arson | 0 | 0 | 4 | 1 | 0 | 0 | 2 | 9 | 7 |
| Burglary | 47 | 64 | 89 | 79 | 69 | 105 | 175 | 160 | 104 |
| Larceny | 291 | 332 | 418 | 356 | 384 | 698 | 475 | 549 | 469 |
| Theft from Motor Vehicle | 109 | 97 | 111 | 200 | 140 | 163 | 153 | 315 | 328 |
| Auto Theft | 35 | 50 | 65 | 58 | 52 | 63 | 82 | 184 | 159 |
| Total | 1,485 | 1,602 | 1,794 | 1,797 | 1,549 | 2,144 | 1,879 | 2,625 | 2,946 |
| Source: Denver Police Department | |||||||||
| Table I9 – Whittier District 9 – Number of Incidents | |||||||||
| 2014 | 2015 | 2016 | 2017 | 2018 | 2019 | 2020 | 2021 | 2022 | |
| Public Disorder | 108 | 85 | 65 | 70 | 71 | 75 | 85 | 70 | 81 |
| Drug/Alcohol | 40 | 24 | 23 | 19 | 11 | 13 | 1 | 6 | 5 |
| Sexual Assault | 5 | 8 | 10 | 2 | 5 | 5 | 11 | 4 | 9 |
| Other Crimes against Persons | 44 | 32 | 47 | 41 | 27 | 32 | 28 | 21 | 30 |
| All Other Crimes | 79 | 64 | 54 | 73 | 42 | 57 | 69 | 63 | 76 |
| White-collar Crime | 4 | 4 | 5 | 9 | 3 | 4 | 5 | 7 | 2 |
| Murder | 1 | 0 | 1 | 1 | 0 | 1 | 1 | 0 | 2 |
| Robbery | 9 | 10 | 7 | 9 | 4 | 3 | 7 | 7 | 6 |
| Aggravated Assault | 19 | 34 | 25 | 38 | 21 | 28 | 21 | 23 | 32 |
| Arson | 4 | 1 | 0 | 1 | 0 | 0 | 1 | 1 | 0 |
| Burglary | 42 | 40 | 52 | 34 | 16 | 25 | 32 | 37 | 34 |
| Larceny | 40 | 39 | 52 | 47 | 35 | 37 | 48 | 50 | 32 |
| Theft from Motor Vehicle | 29 | 31 | 27 | 47 | 34 | 55 | 65 | 69 | 75 |
| Auto Theft | 26 | 30 | 37 | 38 | 27 | 37 | 57 | 76 | 98 |
| Total | 450 | 402 | 405 | 429 | 296 | 372 | 431 | 434 | 482 |
| Source: Denver Police Department | |||||||||
| Table I10 – Auraria District 9 – Number of Incidents | |||||||||
| 2014 | 2015 | 2016 | 2017 | 2018 | 2019 | 2020 | 2021 | 2022 | |
| Public Disorder | 43 | 67 | 71 | 86 | 78 | 80 | 59 | 58 | 79 |
| Drug/Alcohol | 30 | 74 | 67 | 40 | 33 | 25 | 15 | 25 | 21 |
| Sexual Assault | 5 | 5 | 5 | 6 | 9 | 6 | 1 | 4 | 5 |
| Other Crimes against Persons | 20 | 30 | 27 | 42 | 39 | 35 | 11 | 33 | 44 |
| All Other Crimes | 67 | 245 | 186 | 175 | 202 | 191 | 169 | 219 | 213 |
| White-collar Crime | 5 | 8 | 4 | 8 | 9 | 10 | 2 | 7 | 5 |
| Murder | 0 | 0 | 0 | 0 | 0 | 0 | 1 | 0 | 0 |
| Robbery | 6 | 5 | 1 | 7 | 5 | 8 | 4 | 3 | 2 |
| Aggravated Assault | 4 | 4 | 10 | 5 | 6 | 12 | 6 | 13 | 17 |
| Arson | 0 | 0 | 1 | 1 | 1 | 1 | 0 | 1 | 2 |
| Burglary | 14 | 6 | 16 | 17 | 14 | 23 | 15 | 13 | 14 |
| Larceny | 141 | 158 | 130 | 102 | 118 | 85 | 34 | 68 | 64 |
| Theft from Motor Vehicle | 38 | 45 | 24 | 23 | 21 | 32 | 14 | 37 | 42 |
| Auto Theft | 17 | 19 | 15 | 16 | 12 | 15 | 10 | 24 | 50 |
| Total | 390 | 666 | 557 | 527 | 546 | 523 | 342 | 504 | 558 |
| Source: Denver Police Department | |||||||||
| Table I11 – Globeville District 9 – Number of Incidents | |||||||||
| 2014 | 2015 | 2016 | 2017 | 2018 | 2019 | 2020 | 2021 | 2022 | |
| Public Disorder | 111 | 84 | 82 | 83 | 92 | 72 | 88 | 104 | 145 |
| Drug/Alcohol | 73 | 53 | 64 | 66 | 63 | 107 | 55 | 20 | 33 |
| Sexual Assault | 14 | 14 | 10 | 11 | 10 | 7 | 5 | 8 | 8 |
| Other Crimes against Persons | 26 | 34 | 49 | 38 | 24 | 22 | 40 | 29 | 51 |
| All Other Crimes | 86 | 113 | 108 | 169 | 106 | 77 | 108 | 63 | 106 |
| White-collar Crime | 9 | 8 | 8 | 5 | 14 | 17 | 16 | 7 | 7 |
| Murder | 1 | 1 | 1 | 0 | 0 | 2 | 2 | 3 | 4 |
| Robbery | 7 | 8 | 13 | 8 | 13 | 8 | 10 | 18 | 15 |
| Aggravated Assault | 20 | 18 | 11 | 23 | 24 | 33 | 41 | 56 | 67 |
| Arson | 4 | 1 | 0 | 2 | 3 | 2 | 3 | 5 | 5 |
| Burglary | 55 | 41 | 31 | 23 | 41 | 41 | 42 | 49 | 57 |
| Larceny | 55 | 40 | 63 | 42 | 67 | 57 | 70 | 65 | 80 |
| Theft from Motor Vehicle | 42 | 50 | 44 | 67 | 87 | 60 | 77 | 131 | 146 |
| Auto Theft | 42 | 58 | 51 | 66 | 67 | 66 | 113 | 166 | 183 |
| Total | 545 | 522 | 534 | 603 | 610 | 570 | 671 | 721 | 906 |
| Source: Denver Police Department | |||||||||
| Table I12 – Northeast Park Hill District 9 – Number of Incidents | |||||||||
| 2014 | 2015 | 2016 | 2017 | 2018 | 2019 | 2020 | 2021 | 2022 | |
| Public Disorder | 16 | 16 | 15 | 17 | 13 | 13 | 17 | 22 | 25 |
| Drug/Alcohol | 5 | 6 | 6 | 5 | 4 | 6 | 4 | 3 | 4 |
| Sexual Assault | 1 | 1 | 1 | 2 | 1 | 2 | 2 | 1 | 2 |
| Other Crimes against Persons | 8 | 9 | 10 | 8 | 6 | 7 | 9 | 7 | 10 |
| All Other Crimes | 11 | 14 | 13 | 13 | 15 | 13 | 17 | 18 | 15 |
| White-collar Crime | 2 | 3 | 2 | 2 | 3 | 1 | 3 | 3 | 4 |
| Murder | 0 | 0 | 0 | 0 | 0 | 1 | 0 | 0 | 0 |
| Robbery | 1 | 2 | 2 | 2 | 2 | 2 | 2 | 1 | 2 |
| Aggravated Assault | 5 | 7 | 6 | 5 | 7 | 4 | 8 | 6 | 9 |
| Arson | 0 | 0 | 0 | 0 | 0 | 0 | 0 | 1 | 1 |
| Burglary | 8 | 6 | 7 | 5 | 7 | 6 | 10 | 13 | 11 |
| Larceny | 8 | 8 | 9 | 10 | 11 | 11 | 13 | 13 | 16 |
| Theft from Motor Vehicle | 8 | 10 | 13 | 13 | 14 | 15 | 19 | 28 | 25 |
| Auto Theft | 8 | 8 | 11 | 12 | 12 | 14 | 21 | 35 | 40 |
| Total | 82 | 91 | 95 | 92 | 95 | 93 | 123 | 153 | 161 |
| Source: Denver Police Department | |||||||||
| Table I13 – Skyland District 9 – Number of Incidents | |||||||||
| 2014 | 2015 | 2016 | 2017 | 2018 | 2019 | 2020 | 2021 | 2022 | |
| Public Disorder | 22 | 22 | 17 | 22 | 12 | 11 | 20 | 16 | 16 |
| Drug/Alcohol | 14 | 13 | 7 | 4 | 5 | 4 | 2 | 1 | 1 |
| Sexual Assault | 2 | 0 | 2 | 1 | 1 | 2 | 0 | 1 | 1 |
| Other Crimes against Persons | 9 | 14 | 8 | 10 | 3 | 4 | 10 | 7 | 10 |
| All Other Crimes | 15 | 24 | 20 | 15 | 12 | 11 | 15 | 20 | 16 |
| White-collar Crime | 5 | 2 | 2 | 2 | 1 | 3 | 2 | 1 | 1 |
| Murder | 0 | 1 | 0 | 1 | 0 | 1 | 1 | 0 | 0 |
| Robbery | 1 | 3 | 6 | 3 | 3 | 1 | 0 | 4 | 2 |
| Aggravated Assault | 5 | 8 | 6 | 4 | 3 | 3 | 4 | 6 | 5 |
| Arson | 1 | 0 | 1 | 0 | 1 | 1 | 0 | 0 | 0 |
| Burglary | 11 | 20 | 17 | 14 | 9 | 6 | 16 | 13 | 8 |
| Larceny | 13 | 12 | 7 | 7 | 10 | 8 | 11 | 16 | 16 |
| Theft from Motor Vehicle | 6 | 10 | 14 | 18 | 12 | 14 | 23 | 25 | 18 |
| Auto Theft | 8 | 7 | 4 | 12 | 5 | 7 | 12 | 14 | 29 |
| Total | 108 | 133 | 108 | 110 | 75 | 72 | 114 | 121 | 120 |
| Source: Denver Police Department | |||||||||
Appendix J: Incidents by Type and Neighborhood District 10
| Table J1 – Capitol Hill District 10 – Number of Incidents | |||||||||
| 2014 | 2015 | 2016 | 2017 | 2018 | 2019 | 2020 | 2021 | 2022 | |
| Public Disorder | 316 | 314 | 331 | 336 | 243 | 267 | 595 | 442 | 493 |
| Drug/Alcohol | 445 | 483 | 510 | 580 | 639 | 411 | 209 | 230 | 217 |
| Sexual Assault | 25 | 29 | 28 | 40 | 31 | 39 | 19 | 25 | 23 |
| Other Crimes against Persons | 172 | 174 | 184 | 217 | 132 | 152 | 161 | 151 | 157 |
| All Other Crimes | 292 | 329 | 298 | 328 | 444 | 332 | 460 | 241 | 250 |
| White-collar Crime | 16 | 23 | 20 | 28 | 29 | 26 | 18 | 26 | 27 |
| Murder | 0 | 0 | 2 | 2 | 1 | 1 | 2 | 1 | 3 |
| Robbery | 50 | 71 | 46 | 42 | 56 | 46 | 44 | 57 | 62 |
| Aggravated Assault | 62 | 77 | 81 | 85 | 91 | 104 | 135 | 130 | 109 |
| Arson | 6 | 0 | 0 | 1 | 2 | 4 | 9 | 7 | 8 |
| Burglary | 97 | 73 | 92 | 118 | 104 | 130 | 185 | 178 | 165 |
| Larceny | 392 | 354 | 344 | 349 | 295 | 343 | 405 | 338 | 363 |
| Theft from Motor Vehicle | 142 | 191 | 180 | 275 | 221 | 265 | 377 | 471 | 462 |
| Auto Theft | 86 | 148 | 118 | 144 | 133 | 130 | 229 | 299 | 414 |
| Total | 2,101 | 2,266 | 2,234 | 2,545 | 2,421 | 2,250 | 2,848 | 2,596 | 2,753 |
| Source: Denver Police Department | |||||||||
| Table J2 – Cheeseman Park District 10 – Number of Incidents | |||||||||
| 2014 | 2015 | 2016 | 2017 | 2018 | 2019 | 2020 | 2021 | 2022 | |
| Public Disorder | 136 | 134 | 174 | 140 | 110 | 107 | 149 | 143 | 168 |
| Drug/Alcohol | 329 | 314 | 193 | 128 | 229 | 243 | 83 | 79 | 57 |
| Sexual Assault | 6 | 15 | 9 | 15 | 7 | 8 | 9 | 13 | 8 |
| Other Crimes against Persons | 55 | 45 | 79 | 67 | 39 | 51 | 57 | 42 | 47 |
| All Other Crimes | 205 | 151 | 147 | 135 | 177 | 185 | 74 | 48 | 56 |
| White-collar Crime | 7 | 12 | 11 | 7 | 10 | 15 | 11 | 12 | 7 |
| Murder | 0 | 0 | 1 | 0 | 0 | 0 | 0 | 2 | 0 |
| Robbery | 24 | 19 | 19 | 17 | 20 | 8 | 12 | 18 | 15 |
| Aggravated Assault | 19 | 27 | 20 | 25 | 26 | 26 | 31 | 33 | 27 |
| Arson | 2 | 0 | 3 | 1 | 1 | 2 | 2 | 2 | 2 |
| Burglary | 45 | 56 | 45 | 59 | 56 | 59 | 103 | 66 | 56 |
| Larceny | 113 | 137 | 158 | 107 | 131 | 135 | 151 | 98 | 127 |
| Theft from Motor Vehicle | 68 | 66 | 67 | 91 | 87 | 105 | 161 | 162 | 185 |
| Auto Theft | 50 | 62 | 51 | 78 | 46 | 52 | 88 | 127 | 139 |
| Total | 1,059 | 1,038 | 977 | 870 | 939 | 996 | 931 | 845 | 894 |
| Source: Denver Police Department | |||||||||
| Table J3 – Civic Center District 10 – Number of Incidents | |||||||||
| 2014 | 2015 | 2016 | 2017 | 2018 | 2019 | 2020 | 2021 | 2022 | |
| Public Disorder | 184 | 213 | 265 | 292 | 204 | 186 | 244 | 193 | 176 |
| Drug/Alcohol | 198 | 275 | 242 | 268 | 314 | 201 | 93 | 162 | 235 |
| Sexual Assault | 21 | 19 | 22 | 28 | 32 | 29 | 38 | 39 | 24 |
| Other Crimes against Persons | 157 | 139 | 225 | 219 | 132 | 220 | 159 | 126 | 194 |
| All Other Crimes | 550 | 582 | 819 | 890 | 1,021 | 895 | 698 | 469 | 418 |
| White-collar Crime | 9 | 13 | 12 | 21 | 18 | 20 | 19 | 9 | 20 |
| Murder | 0 | 2 | 1 | 2 | 0 | 0 | 1 | 2 | 0 |
| Robbery | 25 | 18 | 17 | 10 | 14 | 26 | 26 | 23 | 13 |
| Aggravated Assault | 31 | 39 | 40 | 40 | 74 | 70 | 78 | 78 | 100 |
| Arson | 1 | 2 | 0 | 1 | 5 | 2 | 5 | 2 | 6 |
| Burglary | 14 | 16 | 25 | 43 | 31 | 38 | 76 | 58 | 54 |
| Larceny | 96 | 76 | 104 | 134 | 165 | 148 | 139 | 104 | 69 |
| Theft from Motor Vehicle | 44 | 49 | 46 | 51 | 45 | 66 | 118 | 113 | 112 |
| Auto Theft | 13 | 24 | 24 | 32 | 29 | 30 | 41 | 60 | 83 |
| Total | 1,343 | 1,467 | 1,842 | 2,031 | 2,084 | 1,931 | 1,735 | 1,438 | 1,504 |
| Source: Denver Police Department | |||||||||
| Table J4 – Congress Park District 10 – Number of Incidents | |||||||||
| 2014 | 2015 | 2016 | 2017 | 2018 | 2019 | 2020 | 2021 | 2022 | |
| Public Disorder | 109 | 83 | 80 | 83 | 66 | 65 | 79 | 127 | 126 |
| Drug/Alcohol | 21 | 23 | 20 | 23 | 26 | 22 | 12 | 23 | 13 |
| Sexual Assault | 7 | 7 | 3 | 11 | 9 | 13 | 6 | 10 | 7 |
| Other Crimes against Persons | 30 | 37 | 25 | 40 | 34 | 22 | 17 | 21 | 30 |
| All Other Crimes | 52 | 33 | 38 | 62 | 36 | 31 | 34 | 21 | 27 |
| White-collar Crime | 11 | 20 | 14 | 16 | 16 | 7 | 13 | 10 | 3 |
| Murder | 0 | 0 | 0 | 0 | 0 | 0 | 0 | 2 | 0 |
| Robbery | 8 | 6 | 10 | 12 | 8 | 7 | 13 | 10 | 12 |
| Aggravated Assault | 9 | 9 | 13 | 11 | 20 | 18 | 27 | 22 | 28 |
| Arson | 0 | 2 | 0 | 0 | 0 | 1 | 5 | 2 | 4 |
| Burglary | 46 | 59 | 56 | 76 | 49 | 83 | 87 | 76 | 61 |
| Larceny | 76 | 96 | 81 | 102 | 110 | 121 | 113 | 105 | 126 |
| Theft from Motor Vehicle | 48 | 65 | 86 | 99 | 139 | 115 | 147 | 224 | 169 |
| Auto Theft | 46 | 59 | 43 | 57 | 42 | 64 | 99 | 163 | 171 |
| Total | 463 | 499 | 469 | 592 | 555 | 569 | 652 | 816 | 777 |
| Source: Denver Police Department | |||||||||
| Table J5 – Country Club District 10 – Number of Incidents | |||||||||
| 2014 | 2015 | 2016 | 2017 | 2018 | 2019 | 2020 | 2021 | 2022 | |
| Public Disorder | 35 | 17 | 25 | 19 | 19 | 10 | 15 | 45 | 19 |
| Drug/Alcohol | 3 | 2 | 5 | 1 | 3 | 2 | 0 | 1 | 1 |
| Sexual Assault | 1 | 3 | 1 | 1 | 0 | 0 | 1 | 2 | 1 |
| Other Crimes against Persons | 1 | 3 | 2 | 3 | 0 | 3 | 0 | 3 | 3 |
| All Other Crimes | 9 | 10 | 10 | 4 | 11 | 17 | 3 | 8 | 4 |
| White-collar Crime | 9 | 11 | 5 | 2 | 2 | 1 | 3 | 0 | 2 |
| Murder | 0 | 0 | 0 | 0 | 0 | 0 | 0 | 0 | 0 |
| Robbery | 1 | 1 | 3 | 1 | 0 | 3 | 0 | 0 | 3 |
| Aggravated Assault | 0 | 1 | 0 | 2 | 1 | 3 | 2 | 1 | 3 |
| Arson | 2 | 0 | 0 | 0 | 0 | 0 | 0 | 0 | 0 |
| Burglary | 29 | 30 | 35 | 27 | 23 | 33 | 31 | 44 | 17 |
| Larceny | 15 | 13 | 15 | 12 | 17 | 14 | 33 | 19 | 15 |
| Theft from Motor Vehicle | 26 | 21 | 30 | 32 | 30 | 34 | 46 | 52 | 45 |
| Auto Theft | 10 | 15 | 11 | 15 | 7 | 12 | 19 | 40 | 34 |
| Total | 141 | 127 | 142 | 119 | 113 | 132 | 153 | 215 | 147 |
| Source: Denver Police Department | |||||||||
| Table J6 – North Capitol Hill District 10 – Number of Incidents | |||||||||
| 2014 | 2015 | 2016 | 2017 | 2018 | 2019 | 2020 | 2021 | 2022 | |
| Public Disorder | 195 | 168 | 209 | 199 | 144 | 165 | 253 | 232 | 274 |
| Drug/Alcohol | 250 | 259 | 283 | 239 | 187 | 164 | 68 | 66 | 135 |
| Sexual Assault | 17 | 19 | 26 | 22 | 20 | 18 | 15 | 23 | 31 |
| Other Crimes against Persons | 94 | 114 | 104 | 110 | 71 | 84 | 100 | 90 | 114 |
| All Other Crimes | 277 | 297 | 262 | 190 | 189 | 204 | 188 | 157 | 155 |
| White-collar Crime | 21 | 31 | 36 | 32 | 36 | 30 | 27 | 25 | 20 |
| Murder | 0 | 1 | 2 | 1 | 1 | 1 | 0 | 1 | 1 |
| Robbery | 32 | 35 | 25 | 32 | 21 | 32 | 24 | 32 | 16 |
| Aggravated Assault | 31 | 33 | 45 | 44 | 50 | 51 | 77 | 77 | 80 |
| Arson | 0 | 0 | 0 | 1 | 1 | 3 | 6 | 3 | 6 |
| Burglary | 47 | 51 | 57 | 57 | 53 | 93 | 120 | 100 | 104 |
| Larceny | 163 | 198 | 176 | 187 | 212 | 211 | 217 | 177 | 197 |
| Theft from Motor Vehicle | 68 | 85 | 108 | 150 | 91 | 134 | 218 | 196 | 254 |
| Auto Theft | 33 | 52 | 60 | 57 | 57 | 74 | 97 | 136 | 171 |
| Total | 1,228 | 1,343 | 1,393 | 1,321 | 1,133 | 1,264 | 1,410 | 1,315 | 1,558 |
| Source: Denver Police Department | |||||||||
| Table J7 – Belcaro District 10 – Number of Incidents | |||||||||
| 2014 | 2015 | 2016 | 2017 | 2018 | 2019 | 2020 | 2021 | 2022 | |
| Public Disorder | 12 | 18 | 13 | 15 | 11 | 14 | 20 | 21 | 23 |
| Drug/Alcohol | 1 | 4 | 6 | 5 | 6 | 4 | 4 | 1 | 2 |
| Sexual Assault | 1 | 2 | 2 | 3 | 2 | 2 | 0 | 2 | 2 |
| Other Crimes against Persons | 4 | 8 | 6 | 6 | 3 | 6 | 6 | 4 | 5 |
| All Other Crimes | 14 | 14 | 14 | 9 | 9 | 14 | 10 | 8 | 7 |
| White-collar Crime | 4 | 4 | 5 | 4 | 4 | 4 | 5 | 5 | 9 |
| Murder | 0 | 0 | 0 | 1 | 0 | 0 | 0 | 0 | 0 |
| Robbery | 0 | 2 | 1 | 3 | 2 | 3 | 3 | 3 | 3 |
| Aggravated Assault | 2 | 2 | 2 | 2 | 1 | 2 | 3 | 2 | 4 |
| Arson | 1 | 0 | 0 | 0 | 1 | 0 | 0 | 1 | 1 |
| Burglary | 18 | 17 | 15 | 18 | 19 | 20 | 18 | 21 | 21 |
| Larceny | 21 | 19 | 19 | 24 | 24 | 24 | 36 | 27 | 28 |
| Theft from Motor Vehicle | 20 | 31 | 13 | 20 | 24 | 38 | 42 | 43 | 44 |
| Auto Theft | 8 | 5 | 7 | 7 | 11 | 10 | 21 | 30 | 27 |
| Total | 105 | 123 | 99 | 114 | 115 | 138 | 165 | 164 | 173 |
| Source: Denver Police Department | |||||||||
| Table J8 – Cherry Creek District 10 – Number of Incidents | |||||||||
| 2014 | 2015 | 2016 | 2017 | 2018 | 2019 | 2020 | 2021 | 2022 | |
| Public Disorder | 3 | 4 | 3 | 4 | 2 | 3 | 4 | 5 | 6 |
| Drug/Alcohol | 1 | 1 | 1 | 1 | 1 | 1 | 0 | 0 | 0 |
| Sexual Assault | 0 | 1 | 0 | 0 | 0 | 0 | 0 | 0 | 0 |
| Other Crimes against Persons | 1 | 1 | 1 | 1 | 1 | 1 | 1 | 1 | 2 |
| All Other Crimes | 1 | 2 | 2 | 2 | 1 | 1 | 1 | 1 | 1 |
| White-collar Crime | 2 | 2 | 2 | 2 | 2 | 2 | 1 | 1 | 1 |
| Murder | 0 | 0 | 0 | 0 | 0 | 0 | 0 | 0 | 0 |
| Robbery | 0 | 1 | 1 | 1 | 0 | 1 | 1 | 0 | 1 |
| Aggravated Assault | 0 | 1 | 0 | 0 | 0 | 0 | 0 | 1 | 1 |
| Arson | 0 | 0 | 0 | 0 | 0 | 0 | 0 | 0 | 0 |
| Burglary | 3 | 4 | 4 | 4 | 3 | 3 | 4 | 5 | 3 |
| Larceny | 13 | 16 | 18 | 15 | 13 | 17 | 11 | 9 | 12 |
| Theft from Motor Vehicle | 3 | 4 | 2 | 3 | 4 | 5 | 7 | 7 | 11 |
| Auto Theft | 1 | 2 | 1 | 2 | 2 | 2 | 4 | 5 | 7 |
| Total | 28 | 37 | 34 | 34 | 29 | 36 | 33 | 35 | 44 |
| Source: Denver Police Department | |||||||||
| Table J9 – Hale District 10 – Number of Incidents | |||||||||
| 2014 | 2015 | 2016 | 2017 | 2018 | 2019 | 2020 | 2021 | 2022 | |
| Public Disorder | 9 | 8 | 10 | 6 | 6 | 8 | 8 | 12 | 16 |
| Drug/Alcohol | 2 | 1 | 2 | 2 | 2 | 2 | 1 | 1 | 1 |
| Sexual Assault | 1 | 2 | 1 | 1 | 1 | 1 | 1 | 1 | 1 |
| Other Crimes against Persons | 3 | 3 | 3 | 3 | 2 | 3 | 2 | 2 | 2 |
| All Other Crimes | 4 | 3 | 4 | 6 | 3 | 3 | 4 | 3 | 4 |
| White-collar Crime | 1 | 1 | 1 | 0 | 1 | 2 | 1 | 1 | 2 |
| Murder | 0 | 0 | 0 | 0 | 0 | 0 | 0 | 0 | 0 |
| Robbery | 0 | 1 | 1 | 1 | 1 | 1 | 1 | 1 | 1 |
| Aggravated Assault | 1 | 1 | 1 | 2 | 1 | 1 | 2 | 2 | 2 |
| Arson | 0 | 0 | 0 | 0 | 0 | 0 | 0 | 0 | 1 |
| Burglary | 5 | 5 | 5 | 4 | 4 | 4 | 6 | 5 | 5 |
| Larceny | 5 | 5 | 6 | 6 | 7 | 7 | 11 | 11 | 8 |
| Theft from Motor Vehicle | 5 | 7 | 6 | 7 | 10 | 7 | 14 | 21 | 19 |
| Auto Theft | 2 | 4 | 3 | 5 | 5 | 5 | 8 | 13 | 17 |
| Total | 37 | 39 | 43 | 45 | 42 | 43 | 56 | 74 | 79 |
| Source: Denver Police Department | |||||||||
| Table J11 – Hilltop District 10 – Number of Incidents | |||||||||
| 2014 | 2015 | 2016 | 2017 | 2018 | 2019 | 2020 | 2021 | 2022 | |
| Public Disorder | 6 | 5 | 5 | 4 | 4 | 4 | 4 | 7 | 9 |
| Drug/Alcohol | 1 | 1 | 1 | 1 | 1 | 1 | 0 | 0 | 0 |
| Sexual Assault | 0 | 0 | 0 | 0 | 1 | 0 | 1 | 0 | 1 |
| Other Crimes against Persons | 2 | 2 | 1 | 2 | 2 | 2 | 1 | 1 | 1 |
| All Other Crimes | 2 | 3 | 2 | 1 | 1 | 2 | 2 | 1 | 3 |
| White-collar Crime | 1 | 3 | 1 | 0 | 1 | 2 | 1 | 1 | 1 |
| Murder | 0 | 0 | 0 | 0 | 0 | 0 | 0 | 0 | 0 |
| Robbery | 0 | 0 | 0 | 0 | 0 | 1 | 0 | 0 | 0 |
| Aggravated Assault | 0 | 1 | 1 | 1 | 0 | 1 | 1 | 1 | 2 |
| Arson | 0 | 0 | 0 | 0 | 0 | 0 | 0 | 0 | 0 |
| Burglary | 4 | 7 | 6 | 4 | 6 | 4 | 4 | 5 | 4 |
| Larceny | 4 | 3 | 3 | 4 | 3 | 4 | 7 | 6 | 6 |
| Theft from Motor Vehicle | 7 | 7 | 5 | 6 | 7 | 10 | 11 | 14 | 9 |
| Auto Theft | 2 | 2 | 2 | 3 | 4 | 4 | 6 | 10 | 11 |
| Total | 28 | 33 | 27 | 25 | 28 | 32 | 39 | 47 | 46 |
| Source: Denver Police Department | |||||||||
| Table J12 – Speer District 10 – Number of Incidents | |||||||||
| 2014 | 2015 | 2016 | 2017 | 2018 | 2019 | 2020 | 2021 | 2022 | |
| Public Disorder | 39 | 36 | 40 | 46 | 32 | 35 | 40 | 67 | 64 |
| Drug/Alcohol | 15 | 11 | 15 | 19 | 12 | 11 | 3 | 4 | 5 |
| Sexual Assault | 2 | 2 | 3 | 2 | 4 | 3 | 2 | 4 | 5 |
| Other Crimes against Persons | 13 | 16 | 14 | 14 | 9 | 11 | 8 | 11 | 13 |
| All Other Crimes | 40 | 26 | 35 | 43 | 37 | 26 | 18 | 13 | 18 |
| White-collar Crime | 3 | 5 | 5 | 7 | 8 | 5 | 8 | 3 | 5 |
| Murder | 0 | 0 | 0 | 0 | 0 | 0 | 0 | 0 | 0 |
| Robbery | 5 | 3 | 5 | 4 | 5 | 3 | 5 | 4 | 8 |
| Aggravated Assault | 5 | 3 | 4 | 5 | 5 | 4 | 5 | 10 | 8 |
| Arson | 0 | 0 | 0 | 0 | 0 | 0 | 1 | 0 | 2 |
| Burglary | 31 | 32 | 35 | 25 | 30 | 21 | 28 | 36 | 29 |
| Larceny | 44 | 46 | 53 | 51 | 56 | 62 | 77 | 62 | 67 |
| Theft from Motor Vehicle | 31 | 29 | 37 | 40 | 58 | 48 | 87 | 100 | 98 |
| Auto Theft | 23 | 26 | 24 | 23 | 26 | 26 | 50 | 75 | 79 |
| Total | 251 | 236 | 269 | 278 | 281 | 255 | 331 | 388 | 400 |
| Source: Denver Police Department | |||||||||
Appendix K: Incidents by Type and Neighborhood District 11
| Table K1 – DIA District 11 – Number of Incidents | |||||||||
| 2014 | 2015 | 2016 | 2017 | 2018 | 2019 | 2020 | 2021 | 2022 | |
| Public Disorder | 67 | 81 | 82 | 95 | 91 | 110 | 141 | 263 | 415 |
| Drug/Alcohol | 16 | 16 | 27 | 33 | 22 | 33 | 64 | 68 | 27 |
| Sexual Assault | 3 | 8 | 10 | 10 | 11 | 8 | 15 | 6 | 20 |
| Other Crimes against Persons | 27 | 34 | 33 | 46 | 36 | 52 | 58 | 62 | 94 |
| All Other Crimes | 148 | 141 | 162 | 241 | 138 | 193 | 234 | 243 | 270 |
| White-collar Crime | 49 | 35 | 60 | 103 | 144 | 123 | 115 | 86 | 59 |
| Murder | 0 | 0 | 0 | 1 | 1 | 0 | 0 | 0 | 5 |
| Robbery | 2 | 3 | 6 | 9 | 3 | 7 | 12 | 13 | 19 |
| Aggravated Assault | 7 | 7 | 8 | 7 | 15 | 18 | 32 | 38 | 54 |
| Arson | 0 | 0 | 0 | 0 | 0 | 1 | 2 | 1 | 2 |
| Burglary | 7 | 9 | 8 | 20 | 12 | 30 | 34 | 46 | 41 |
| Larceny | 198 | 196 | 224 | 228 | 250 | 274 | 245 | 414 | 588 |
| Theft from Motor Vehicle | 45 | 56 | 118 | 90 | 121 | 124 | 129 | 413 | 635 |
| Auto Theft | 29 | 97 | 144 | 184 | 296 | 254 | 314 | 712 | 1,170 |
| Total | 598 | 683 | 882 | 1,067 | 1,140 | 1,227 | 1,395 | 2,365 | 3,399 |
| Source: Denver Police Department | |||||||||
| Table K2 – Gateway Green Valley Ranch District 11 – Number of Incidents | |||||||||
| 2014 | 2015 | 2016 | 2017 | 2018 | 2019 | 2020 | 2021 | 2022 | |
| Public Disorder | 329 | 306 | 369 | 258 | 263 | 259 | 288 | 341 | 337 |
| Drug/Alcohol | 39 | 33 | 25 | 29 | 37 | 46 | 38 | 9 | 10 |
| Sexual Assault | 18 | 21 | 24 | 32 | 33 | 20 | 35 | 28 | 25 |
| Other Crimes against Persons | 150 | 140 | 141 | 151 | 107 | 116 | 96 | 103 | 136 |
| All Other Crimes | 133 | 119 | 122 | 120 | 162 | 163 | 145 | 137 | 127 |
| White-collar Crime | 39 | 29 | 23 | 33 | 33 | 38 | 53 | 35 | 37 |
| Murder | 2 | 2 | 3 | 1 | 0 | 2 | 5 | 5 | 2 |
| Robbery | 33 | 32 | 28 | 33 | 38 | 45 | 25 | 36 | 37 |
| Aggravated Assault | 52 | 56 | 75 | 58 | 76 | 86 | 104 | 110 | 172 |
| Arson | 3 | 2 | 2 | 2 | 3 | 1 | 2 | 1 | 6 |
| Burglary | 135 | 134 | 133 | 96 | 108 | 119 | 104 | 121 | 119 |
| Larceny | 167 | 140 | 115 | 115 | 121 | 136 | 171 | 186 | 175 |
| Theft from Motor Vehicle | 202 | 198 | 241 | 204 | 203 | 253 | 305 | 347 | 335 |
| Auto Theft | 66 | 84 | 127 | 175 | 203 | 234 | 371 | 548 | 706 |
| Total | 1,368 | 1,296 | 1,428 | 1,307 | 1,387 | 1,518 | 1,742 | 2,007 | 2,224 |
| Source: Denver Police Department | |||||||||
| Table K3 – Montbello District 11 – Number of Incidents | |||||||||
| 2014 | 2015 | 2016 | 2017 | 2018 | 2019 | 2020 | 2021 | 2022 | |
| Public Disorder | 240 | 228 | 250 | 180 | 146 | 153 | 167 | 160 | 169 |
| Drug/Alcohol | 30 | 58 | 65 | 69 | 79 | 60 | 30 | 34 | 26 |
| Sexual Assault | 17 | 15 | 14 | 15 | 18 | 19 | 14 | 11 | 12 |
| Other Crimes against Persons | 116 | 132 | 120 | 107 | 67 | 72 | 61 | 39 | 54 |
| All Other Crimes | 138 | 132 | 178 | 184 | 171 | 186 | 187 | 162 | 167 |
| White-collar Crime | 20 | 26 | 20 | 23 | 18 | 27 | 22 | 11 | 17 |
| Murder | 0 | 2 | 3 | 1 | 2 | 1 | 2 | 3 | 1 |
| Robbery | 27 | 38 | 27 | 21 | 23 | 26 | 17 | 22 | 26 |
| Aggravated Assault | 59 | 50 | 62 | 48 | 60 | 69 | 86 | 84 | 90 |
| Arson | 5 | 5 | 4 | 4 | 4 | 4 | 3 | 4 | 3 |
| Burglary | 77 | 64 | 54 | 52 | 37 | 40 | 43 | 55 | 69 |
| Larceny | 87 | 80 | 92 | 64 | 70 | 74 | 74 | 69 | 89 |
| Theft from Motor Vehicle | 137 | 118 | 112 | 95 | 121 | 98 | 107 | 159 | 161 |
| Auto Theft | 75 | 68 | 76 | 114 | 100 | 106 | 154 | 245 | 272 |
| Total | 1,025 | 1,010 | 1,074 | 974 | 912 | 933 | 965 | 1,056 | 1,154 |
| Source: Denver Police Department | |||||||||
[ii] https://www.denvergov.org/media/gis/WebDocs/CityCouncil/LgMap_City_Council_Dist_Precincts_Streets_2015.pdf