

About the Authors
Steven Byers, Ph.D. is the Senior Economist with Common Sense Institute. Steven’s experience as an economist spans twenty-three years, including work at federal regulatory agencies (SEC, CFTC, PCAOB) and quantitative economic analysis supporting international trade litigation cases brought before the U.S. International Trade Commission.
2023 Owens – Early Criminal Justice Fellows
George Brauchler served as the elected District Attorney for the 18th Judicial District, Colorado’s most populous district, which includes Arapahoe, Douglas, Elbert, and Lincoln counties, from 2013-2021. As a state prosecutor, he handled the felony cases from the Columbine High School mass shooting case, the Aurora Theater (Batman) mass shooting case, and more recently, the STEM Academy school mass shooting case.
Mitch Morrissey served as the elected District Attorney for the 2nd Judicial District covering Denver, Colorado from 2005-2017. Mitch is internationally recognized for his expertise in DNA technology and applying that technology to solve crimes. He has trained law enforcement officers and prosecutors throughout the United States, the Middle East, Central America, and Canada. He currently runs a company that solves Cold Cases with DNA and Investigative Genetic Genealogy
2023 Local Elections
In 2023, Coloradans will have municipal elections in our most populated cities. To inform these debates CSI will produce reports on the most pressing issues facing Colorado cities: crime, housing, and homelessness for Fort Collins, Denver, Grand Junction, and Aurora.
About Common Sense Institute
Common Sense Institute is a non-partisan research organization dedicated to the protection and promotion of our economy. As a leading voice for free enterprise, CSI’s mission is to examine the fiscal impacts of policies, laws, and to educate voters on issues that impact their lives.
CSI’s founders were a concerned group of business and community leaders who observed that divisive partisanship was overwhelming policymaking and believed that sound economic analysis could help people make fact-based and common sense decisions.
CSI employs rigorous research techniques and dynamic modeling to evaluate the potential impact of these measures on the Colorado economy and individual opportunity.
Teams & Fellows Statement
CSI is committed to independent, in-depth research that examines the impacts of policies, initiatives, and proposed laws so that Coloradans are educated and informed on issues impacting their lives. CSI’s commitment to institutional independence is rooted in the individual independence of our researchers, economists, and fellows. At the core of CSI’s mission is belief in the power of the free enterprise system. CSI’s work explores ideas that protect and promote jobs and the economy, and the CSI team and fellows take part in this pursuit with academic freedom. The CSI team’s work is guided by data-driven research and evidence.
The views and opinions of fellows do not reflect the institutional views of CSI. CSI operates independently of any political party and does not take positions.
Introduction
Since 2019, crime in Colorado has skyrocketed to become a major issue for policy makers across the state. Ahead of local municipal elections, CSI is highlighting important issues, including crime, that voters care about at the local level. This report analyzes Fort Collins through the lens of crime and crime rates. CSI utilized data from Colorado Crime Statistics and focused on statistics reported by the Fort Collins Police Department.[i]
One of the goals of CSI is to offset fear with facts. Media reports and anecdotal observations do not present a full and fair picture. Data of actual crime events, especially when compared to the experiences of other jurisdictions and the entire state clarify the reality of a given community. Statewide crime statistics combine both urban and rural areas, and, because they are overarching, will often be lower than those of individual cities. The news about Fort Collins presents a more optimistic picture relative to other cities. The crime rate has been declining. This trend can be influenced by policymakers and other leaders who study the data collected and analyzed by CSI.
The number of incidents of crime in Fort Collins, represented by the blue line in Figure 1, has averaged 7,761 since 2008 and fluctuated between 6,931 and 8,785 between 2008 and 2022. The volatility in total crime incidents has been largely impacted by changes in property crimes, including burglary, vandalism, and theft from motor vehicles. The change in the annual number of incidents of crime in Fort Collins contrasts with a steady increase in crime at the state level through 2022 as shown in Figure 1.
Figure 1 – Number of Crime Incidents in Colorado and in Fort Collins, CO.
Report Key Findings
- Fort Collins 2022 total crime rate is 18.8% lower than in 2008, whereas Colorado’s has increased by 28.6% over the same period.
- The decline in Fort Collins’s total crime rate from 2008 to 2022 was primarily driven by decreases in property crimes (24.9%) and crimes against persons (23.3%).
- The Fort Collins Police Department (FCPD) arrest rate increased by 28.7% between 2008 and 2022. The crime rate decreased 18.8% over the same period.
- FCPD clearance rates increased 54.8% from 2008 to 2023.
- FCPD budget has grown 22.5% from 2019 to 2024.
- FCPD personnel (FTE’s) have grown 7.7% from 322.75 in 2019 to 347.75 in 2024.
- The number of patrol officers (FTE’s) has decreased 4.9% from 136.75 in 2019 to 130 in 2024, while the number of community and special services personnel (now called Special Operations) has increased 274% from 16.3 in 2019 to 61 in 2024.
- FCPD response times, currently at 4:06, continue to improve and are well below their target level of 5:15.
Crime Rates in Fort Collins
The data in this section comes from Colorado Crime Statistics. Figure 2 shows the evolution of the average monthly crime rates in Fort Collins and Colorado since 2008. The average monthly crime rate in Fort Collins fell by 18.8% from 646 per 100,000 in 2008 to 525 per 100,000 in 2022. In 2008, Fort Collins’s crime rate was 46.2% higher than Colorado’s, after 2012, the crime rate has been below Colorado’s.
Figure 2 – Average Monthly Crime Rate per 100,000 in Fort Collins and Colorado
Figure 3 shows the average monthly rates of crimes against persons per 100,000 residents in Fort Collins and Colorado. From 2008 to 2022, Fort Collins’ rate of crime against persons fell 23.3% from 118.3 to 90.6 per 100,000 while Colorado’s rose by 57% from 66.3 to 104.1 per 100,000.
Figure 3 – Average Monthly Crime Rate per 100,000 in Fort Collins and Colorado – Crimes Against Person
Figure 4 shows the average monthly rate of crimes against property per 100,000 residents in Fort Collins and Colorado. From 2008 to 2022, Fort Collins’s rate fell by 24.9% from 488.6 to 367.2 per 100,000 while Colorado’s rose by 27.3% from 322.5 to 410.6 per 100,000.
Figure 4 – Average Monthly Crime Rate per 100,000 in Fort Collins and Colorado – Crimes Against Property
Figure 5 shows the average monthly rate of crimes against society per 100,000 residents in Fort Collins and Colorado. From 2008 to 2022, Fort Collins’s rate increased by 70.7% from 39.2 to 66.8 per 100,000 while Colorado’s rose by 1.3% from 53.3 to 54 per 100,000.
Figure 5 – Average Monthly Crime Rate per 100,000 in Fort Collins and Colorado – Crimes Against Society
Crimes against society include all crimes that are not crimes against persons or property. These include drug and narcotic violations, illegal betting and wagering, illegal gambling operations, illegal pornography, prostitution, and weapons violations.
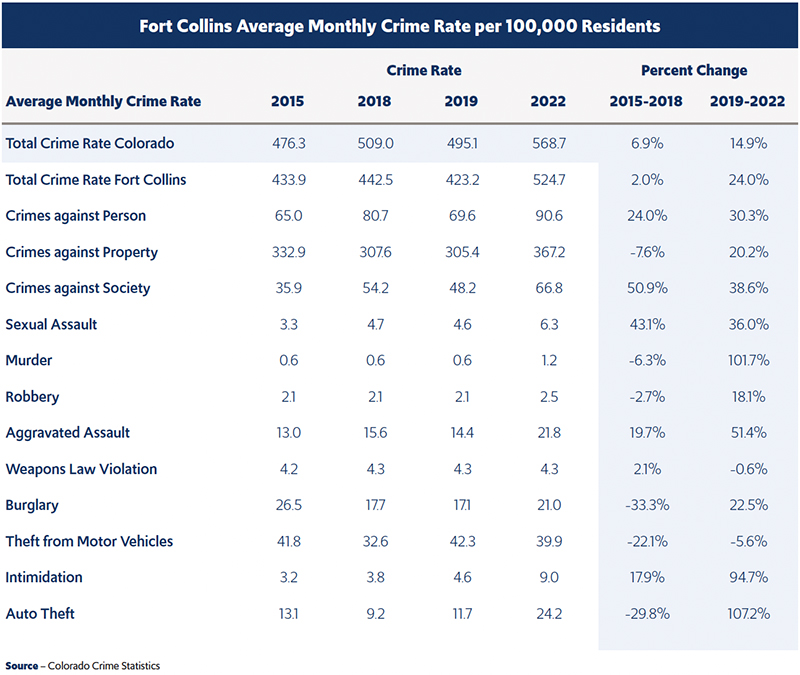
Figure 6 shows average monthly crime rates by major crime category in 2015, 2018, 2019, and 2022, as well as their changes from 2015 to 2018 and from 2019 to 2022. Full year statistics were chosen to make data comparable over the four-year intervals. The total crime rate in Fort Collins increased by 2.0% from 2015 to 2018 and increased by 24% from 2019 to 2022. Crimes against persons increased by 30.3% from 2019 to 2022 after increasing 24% between 2015 and 2018. Crimes against property increased by 20.2% from 2019 to 2022 after decreasing 7.6% from 2015 to 2018. Crimes against society increased by 38.6% from 2019 to 2022 after increasing by 50.9% from 2015 to 2018.
Some of the larger increases occurred in robbery, which increased by 18.1% from 2019 to 2022 after a 53.5% decline between 2014 and 2018; intimidation, which rose by 80.9% from 2018 to 2022 after a 2.7% decrease between 2015 and 2018; aggravated assault, which increased by 51.4% from 2019 to 2022 following a 19.7% increase between 2015 and 2018, and auto theft; which increased by 107.2% from 2019 to 2022 concurrent with a statewide increase. A more comprehensive version of Figure 6 showing all categories of crime is provided in Figure 14 in the appendix.
Figure 6 – Fort Collins Average Monthly Crime Rate per 100,000 by Crime Category
Crime in Fort Collins Relative to Other Larimer County Jurisdictions
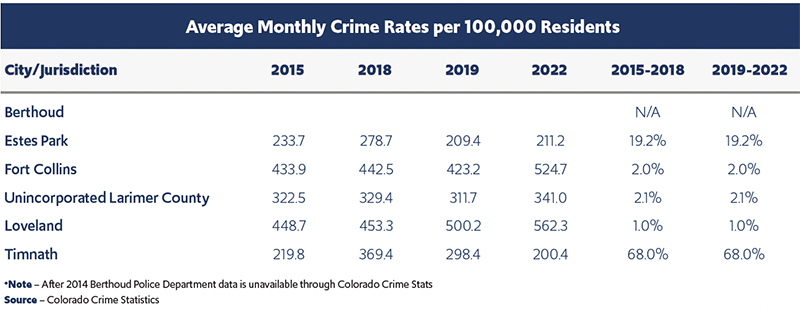
Figures 7 and 8 show the average monthly crime rates per 100,000 residents in Larimer County cities (Berthoud, Estes Park, Fort Collins, Loveland, Timnath, and unincorporated Larimer County). Fort Collins is second to Loveland in terms of average monthly crime rates. From 2008 to 2023, the crime rate in Fort Collins fell 32% from 646 per 100,000 in 2008 to 439.2 per 100,000 in 2023. From 2015 to 2018, Fort Collins experienced the second lowest crime rate increase, 2%, compared to all other cities and unincorporated areas in Larimer County. Loveland had the lowest increase over the same period. This was reversed over the period 2019 to 2023, as the crime rate increased 24%, while the crime rate in unincorporated Larimer County rose 9.4%, Loveland 12.4%, and Estes Park experienced an increase of, 0.9%. Only Timnath experienced a decrease from 2019 to 2022, 32.8%.
Figure 7 – Average Monthly Crime Rate in Larimer County Cities
Figure 8 – Changes in Average Monthly Crime Rates per 100,000 in Larimer County Cities
Arrests in Fort Collins
Figure 9 shows the number of arrests and number of incidents of crime in Fort Collins. Over a period when the number of incidents of crime decreased since 2008, the number of arrests by the FCPD increased by 11.6%. After rising from 2008 through 2013, arrests have increased slightly through 2023. Arrests in 2022 increased dramatically but have reverted back to towards the long average in 2023.
Figure 9 – Number of Crime Incidents vs. Number of Arrests – Fort Collins, CO.
Police Department Clearance Rates
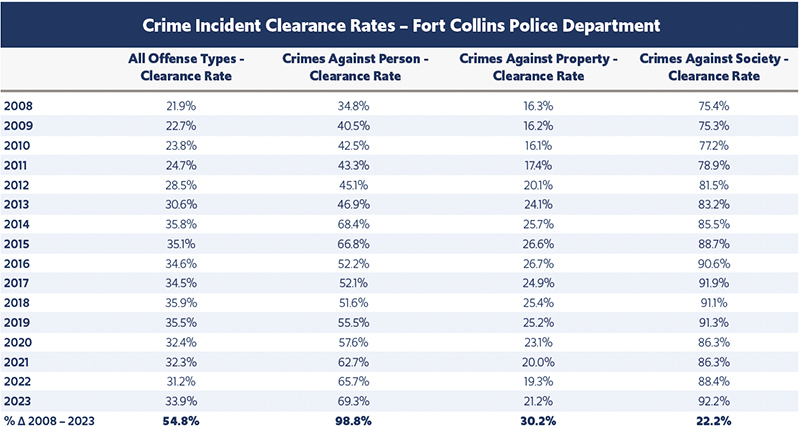
The Fort Collins Police Department’s clearance rate of crime incidents increased 54.8% since 2008 and is 33.9% in 2023. Figures 10 and 11 show the Fort Collins Police Department clearance rates for overall crime incidents, crimes against person, crimes against property, and crimes against society. Clearance rates have been increasing in all broad categories. Clearance rates are highest for crimes against society followed by crimes against person, and crimes against property.
Figure 10 – Incident Clearance Rates – Fort Collins Police Department
Clearance rates for crimes against person have increased by 98.8% since 2008, from 34.8% to 69.3% in 2023. Crimes against property have increased 30.2% to 21.2%; crimes against society have increased by 22.2% to 92.2% in 2023.
Figure 11 – Crime Incident Clearance Rates – Fort Collins Police Department
Police Department Budget
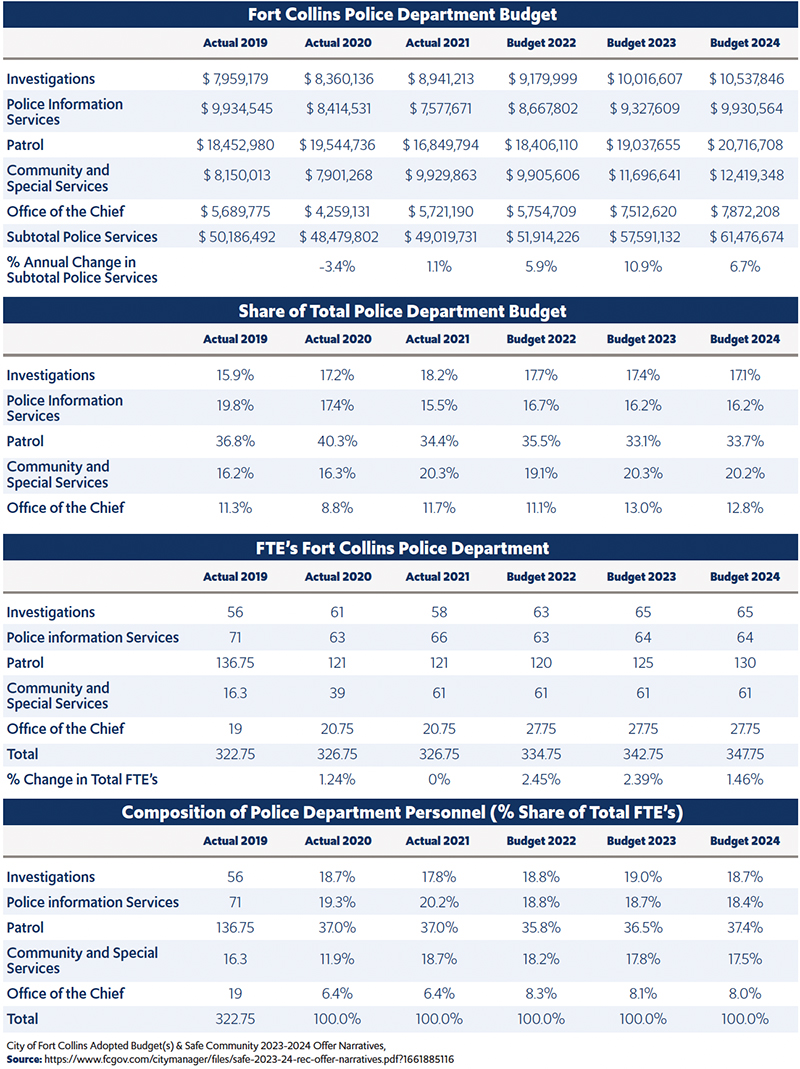
The Fort Collins Police Department budget and personnel data is shown in Figure 12. The Fort Collins Police Department budget declined -3.4% in 2020, and -1.5% in 2021, following the pandemic. However, in 2022 it increased 5.9%, increased 10.9% in 2023, increased 6.7% for 2024 for a total increase of 22.5% from 2019 to 2024. Budget allocations of each service area as a share of the total police services budget have been fairly stable although patrol decreased 3.1 percentage points from 2019 to 2024, while community and special services has increased by 4.0 percentage points over the same period, and investigations has gone up by 1.3 percentage points.
The number of personnel in the police department has grown slightly every year, 7.7% from 2019 to 2024, but there is a change in the allocation of personnel among the five sub-departments (Investigations, Police Information Service, Patrol, Community and Special Services (Special Operations), and Office of the Chief).
The Fort Collins Police Department has shifted budget and FTE’s away from patrol officers. The budget for patrol officers in 2024 is 4.2 percentage points below 2019 levels, and the number of patrol officers is down 4.9%, while the number community and personal services (now called Special Operations) personnel has increased 274.2%.
- Investigations grew from 56 FTE’s (17.4% of total FTE’s) in 2019 to 65 FTE’s (18.7% of total FTE’s) in 2024. Total change since 2019 is 9 FTE’s, a 16.1% increase.
- Police Information Systems declined from 71 FTE’s (22% of total FTE’s) in 2019 to 64 FTE’s (18.4% of total FTE’s) in 2024. Total change since 2019 is -7 FTE’s, a 9.9% decrease.
- Patrol dropped from 136.75 FTE’s (42.4% of total FTE’s) in 2019 to 130 FTE’s (37.4% of total FTE’s) in 2024. Total change since 2019 is -6.75 FTE’s, a 4.9% decrease.
- Community and Special Services more than tripled from 16.3 FTE’s (5.1% of total FTE’s) in 2019 to 61 FTE’s (17.5% of total FTE’s) in 2024. Total change since 2019 is 44.7 FTE’s, a 274.2% increase.
- Office of the Chief grew from 19 FTE’s (5.9% of total FTE’s) in 2019 to 27.75 FTE’s (8.0% of total FTE’s) in 2024. Total change since 2019 is 8.75 FTE’s, a 7.7% increase.
At first glance, it may appear that fewer patrol officers might mean a lower police presence, however, the Special Operations personnel has sworn officers with designated policing duties with direct contact with citizens. According to the City of Fort Collins 2023-2024 adopted budget the Police Special Operations Division includes 1 Assistant Chief, 3 lieutenants, 8 sergeants, 6 corporals, 46 officers, 1 full-time civilian and 6 hourly civilians. The Division performs the following duties:
- The Emergency Management and Special Events lieutenant works with City departments and the community on emergency and special events management. The traffic unit reports to this Lieutenant.
- Traffic Unit: 1 sergeant, 1 corporal, 5 traffic officers, and 6 hourly civilians who operate two photo radar vehicles. This team leads the enforcement of traffic safety and CRASH investigations.
- Community Policing: one lieutenant is responsible for leading the agency’s community policing teams and initiatives. The following units report to the Community Policing Lieutenant: District One Nights: 1 sergeant, 1 corporal and 6 officers. The District One Night team’s primary focus is to provide a safe nightlife environment in the Downtown area. District One Days: 1 sergeant, 4 officers, 1 liquor compliance officer and 1 marijuana compliance officer. The District One day team focuses on quality-of – life issues in the Downtown area. A large amount of the team’s time is devoted to addressing disruptive behaviors of the homeless/transient population. Neighborhood Engagement Team (NET): 1 sergeant, 1 corporal, and 7 police officers. NET addresses crime prevention and neighborhood quality-of-life issues using proactive community policing.
- School Resource Officers: 1 sergeant, 2 corporals and 11 police officers provide essential safety and outreach in the schools. By contract, PSD and the City each pay 50% of this program. The Tactical Operations Lieutenant manages the SWAT Team, K9 Unit, UAS (Drone) Program, Mental Health Co Responder initiative, and the Hazardous Devices Team.
- SWAT Team: 1 sergeant is assigned full time to lead 24 part-time SWAT operators.
- K9 Team: 1 Sergeant and 7 officer handlers.
- Mental Health Response Team: 1 Sergeant and 4 officers. This team supports the following Strategic Objectives: – SAFE 5.1 – Improve overall community safety while continuing to increase the level of public trust and willingness to use emergency services. SAFE 5.2 – Meet the expected level of policing services as the community grows and changes through innovative and non-traditional service delivery models. – NLSH 1.2 – Collaborate to leverage community partners’ expertise in addressing priority human service issues like poverty and mental health, and to make homelessness rare, brief, and non-recurring.
Figure 12 – Data on the Fort Collins Police Department
Police Response Time
The Fort Collins Police Department’s average response time has been trending downward since the first half of 2019; it is well below their target response time of 5:15. The average response time in 2023 is 4:06, see Figure 13.
Figure 13 – Fort Collins Police Department Response Time
Conclusion
The information in this report is intended to help voters and elected officials better understand the key areas of concern, so as to better focus policy and resource discussions. The annual crime rate in Fort Collins is lower than Colorado’s by 7.7% and, in contrast to Colorado, the crime rate in Fort Collins has declined since 2008 while Colorado’s has increased dramatically. Despite the overall decrease in crime since 2008, over the period 2019 to 2022, crime rates have increased significantly. This increase occurred at the same time as the Fort Collins Police Department’s shift in personnel from patrol officers to special operations officers, so the effectiveness of this resource reallocation remains to be seen. CSI will continue to monitor crimes rates in the city going forward to assess its impact.
Appendix
Figure 14 – Crime Rates in Fort Collins
| Crime Rates in Fort Collins | |||||||
|---|---|---|---|---|---|---|---|
| Category of Crime | 2015 | 2018 | 2019 | 2022 | Change 2015-2018 | Change 2019-2022 | |
| Crimes against Person | 780.6 | 968.1 | 835 | 1087.8 | 24.00% | 30.30% | |
| Murder and Nonnegligent Manslaughter | 1.3 | 1.8 | 0.6 | 1.2 | 42.40% | 101.70% | |
| Negligent Manslaughter | 0 | 1.2 | 0.6 | 1.2 | 101.70% | ||
| Justifiable Homicide | 0 | 0 | 0 | 0 | |||
| Kidnapping/Abduction | 26.9 | 24.4 | 27.5 | 33.3 | -09.50% | 21.20% | |
| Rape | 15 | 17.8 | 19.3 | 20.2 | 18.70% | 4.80% | |
| Sodomy | 3.8 | 1.8 | 2.9 | 5.4 | -52.70% | 82.90% | |
| Sexual Assault with an Object | 1.9 | 1.8 | 4.7 | 8.9 | -5.30% | 90.80% | |
| Fondling | 18.8 | 35.1 | 28.7 | 41.1 | 86.70% | 43.20% | |
| Incest | 0.6 | 0 | 0 | 0 | -100.00% | ||
| Statutory Rape | 2.5 | 0 | 2.3 | 1.8 | -100.00% | -23.50% | |
| Aggravated Assault | 156 | 186.7 | 172.6 | 261.2 | 19.70% | 51.30% | |
| Simple Assault | 521.8 | 651.8 | 520.2 | 604.6 | 24.90% | 16.20% | |
| Intimidation | 32 | 45.2 | 55.6 | 108.3 | 41.40% | 94.80% | |
| Human Trafficking, Commercial Sex Acts | 0 | 0.6 | 0 | 0.6 | |||
| Human Trafficking, Involuntary Servitude | 0 | 0 | 0 | 0 | |||
| Crimes against Property | 3994.9 | 3691.7 | 3664.4 | 4406 | -7.60% | 20.20% | |
| Arson | 6.9 | 7.1 | 4.1 | 14.9 | 3.60% | 262.90% | |
| Bribery | 1.3 | 0.6 | 1.8 | 0.6 | -52.80% | -65.90% | |
| Burglary/Breaking & Entering | 318.2 | 212.3 | 205.4 | 251.7 | -33.30% | 22.60% | |
| Counterfeiting/Forgery | 52 | 70.2 | 75.5 | 64.9 | 34.90% | -14.10% | |
| Destruction/Damage/Vandalism of Property | 775.6 | 677.9 | 742 | 805.7 | -12.60% | 8.60% | |
| Embezzlement | 26.9 | 21.4 | 26.3 | 15.5 | -20.50% | -41.20% | |
| Extortion/Blackmail | 3.8 | 10.1 | 11.1 | 31.5 | 168.90% | 183.60% | |
| False Pretenses/Swindle/Confidence Game | 171 | 273.5 | 245.8 | 249.3 | 59.90% | 1.50% | |
| Credit Card/Automated Teller Machine Fraud | 106.5 | 165.3 | 139.9 | 191.6 | 55.20% | 37.00% | |
| Impersonation | 202.3 | 87.4 | 70.2 | 72 | -56.80% | 2.50% | |
| Welfare Fraud | 0 | 0 | 0 | 0 | |||
| Wire Fraud | 41.4 | 12.5 | 12.9 | 52.4 | -69.80% | 306.90% | |
| Identity Theft | 0.6 | 63 | 67.3 | 107.7 | 9904.80% | 60.00% | |
| Hacking/Computer Invasion | 0 | 6.5 | 6.4 | 8.9 | 38.70% | ||
| Robbery | 23.2 | 22.6 | 21.1 | 27.4 | -2.50% | 29.90% | |
| Pocket-picking | 5 | 4.8 | 4.1 | 1.8 | -5.00% | -56.30% | |
| Purse-snatching | 1.3 | 3.6 | 0 | 0.6 | 185.60% | ||
| Shoplifting | 570.1 | 451.9 | 408.5 | 455.2 | -20.70% | 11.50% | |
| Theft from Building | 213.6 | 229.5 | 221.2 | 186.3 | 7.50% | -15.80% | |
| Theft from Coin Operated Machine or Device | 3.8 | 3.6 | 2.9 | 3.6 | -5.10% | 21.80% | |
| Theft from Motor Vehicle | 501.8 | 390.7 | 507.4 | 479 | -22.10% | -5.60% | |
| Theft of Motor Vehicle Parts/Accessories | 109.6 | 126.7 | 131.1 | 333.8 | 15.50% | 154.70% | |
| All Other Larceny | 680.3 | 680.3 | 579.9 | 674.2 | 0.00% | 16.30% | |
| Motor Vehicle Theft | 156.6 | 110 | 139.9 | 289.8 | -29.80% | 107.20% | |
| Stolen Property Offenses | 23.2 | 60.1 | 39.8 | 87.5 | 159.10% | 119.90% | |
| Crimes against Society | 431 | 650.6 | 578.7 | 802.2 | 50.90% | 38.60% | |
| Drug/Narcotic Violations | 284.4 | 442.4 | 400.8 | 389.8 | 55.60% | -2.80% | |
| Drug Equipment Violations | 72 | 111.8 | 83.1 | 320.2 | 55.20% | 285.30% | |
| Betting/Wagering | 0 | 0 | 0 | 0 | |||
| Operating/Promoting/Assisting Gambling | 0 | 0 | 0 | 0 | |||
| Gambling Equipment Violations | 0 | 0 | 0 | 0 | |||
| Sports Tampering | 0 | 0 | 0 | 0 | |||
| Pornography/Obscene Material | 3.1 | 17.3 | 24.6 | 36.3 | 451.10% | 47.70% | |
| Prostitution | 8.1 | 4.8 | 0.6 | 0 | -41.50% | -100.00% | |
| Assisting or Promoting Prostitution | 11.9 | 3.6 | 2.9 | 0.6 | -70.00% | -79.50% | |
| Purchasing Prostitution | 1.3 | 14.3 | 11.7 | 0.6 | 1041.60% | -94.90% | |
| Weapon Law Violations | 50.1 | 51.1 | 51.5 | 51.2 | 2.00% | -0.60% | |
| Animal Cruelty | 0 | 5.4 | 3.5 | 3.6 | 1.70% | ||
| Violent Crime | 219.9 | 267.6 | 249.9 | 365.4 | 21.70% | 46.20% | |
| Murder | 1.3 | 1.8 | 0.6 | 1.2 | 42.40% | 101.70% | |
| Aggravated Assault | 156 | 186.7 | 172.6 | 261.2 | 19.70% | 51.30% | |
| Non-consensual Sex Offenses | 39.5 | 56.5 | 55.6 | 75.6 | 43.10% | 35.90% | |
| Robbery | 23.2 | 22.6 | 21.1 | 27.4 | -2.50% | 29.90% | |
| Total | 5206.5 | 5310.3 | 5078.2 | 6295.9 | 2.00% | 24.00% | |