

Sales tax revenues across Colorado cities and counties reflect varied economic and budgetary impacts following the March stay-at-home orders and the continued social distancing measures. Some regions are seeing large declines in revenue and taxable sales relative to 2019, as others remain nearly equal, or even above 2019 levels.
While many communities saw strong recoveries following late spring lows, Colorado currently faces a third wave of cases that has started to trigger stricter state and local social distancing restrictions, established by the state’s new COVID-19 Dial framework.[i] Given the impacts seen over the last 7 months, and likelihood of stricter distancing measures to come, both taxpayers and elected officials should be aware of the near and long-term economic implications.
Key Findings:
- While several cities showed slightly lower sales and use tax revenue prior to the pandemic, no city was spared from experiencing sharp monthly declines in at least one month through March to May.
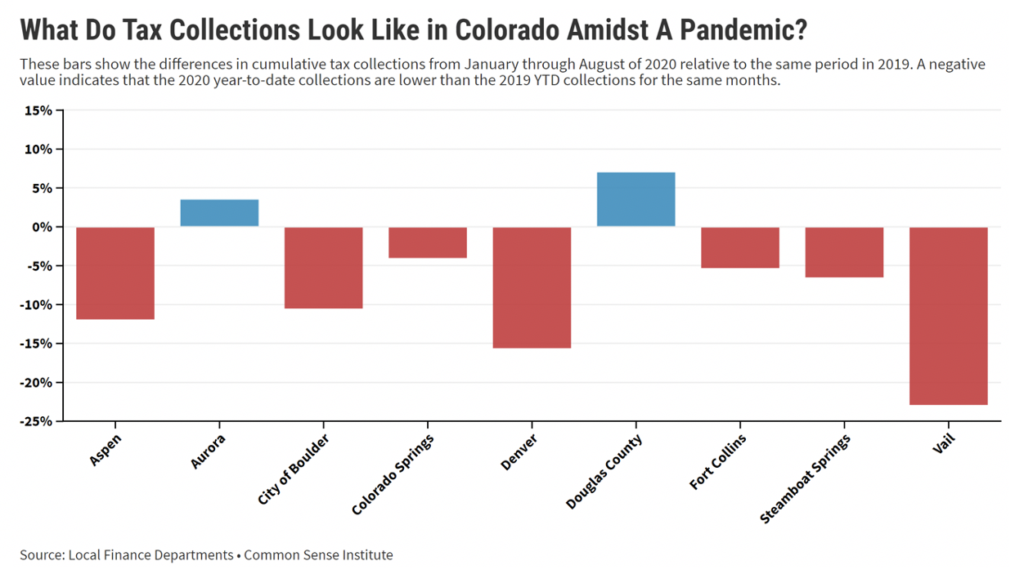
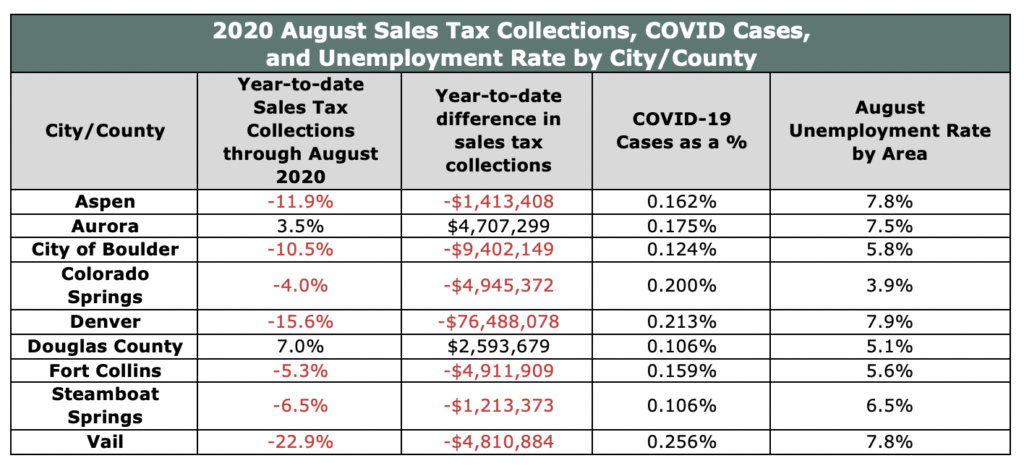
- As of August, seven of the nine cities/counties shown had negative year-to-date (YTD) sales and use tax revenue.
- Vail revenue was down 23% YTD, or $4.8 million.
- Denver revenue was down nearly 16% YTD, or $76.5 million
- Aurora and Douglas County, two larger commuter areas, had an increase in YTD revenue as of August 2020.
- Aurora increased 4% in YTD revenue, or $4.7 million.
- Douglas County increased 8% in YTD revenue, or $2.5 million.
Definition Guide
Sales Tax Collections: the dollar amount a county or city collects based off taxable sales during a specific period.
Taxable Sales: the total dollar amount of purchased goods and services subject to taxation.
Unemployment Rate: the percent of people in the labor force without jobs.
Year-to-date: the cumulative dollar amount of each month in the calendar year through the most recent month.
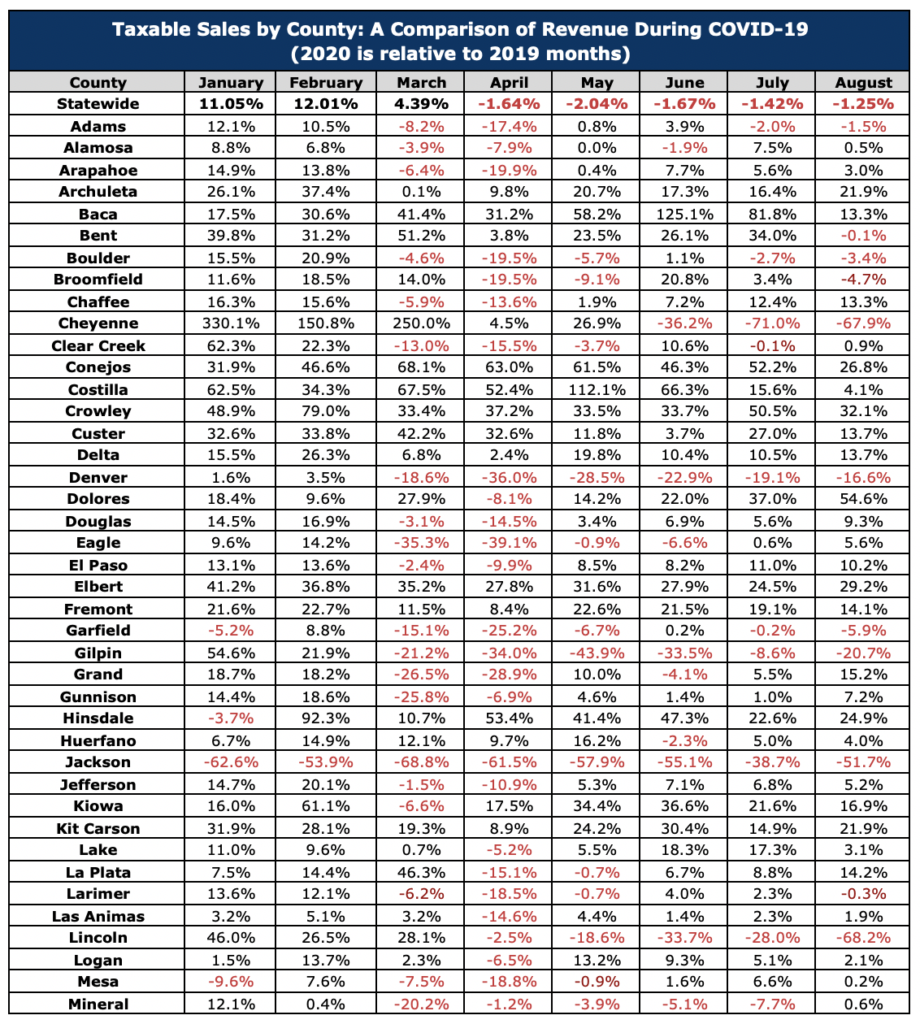
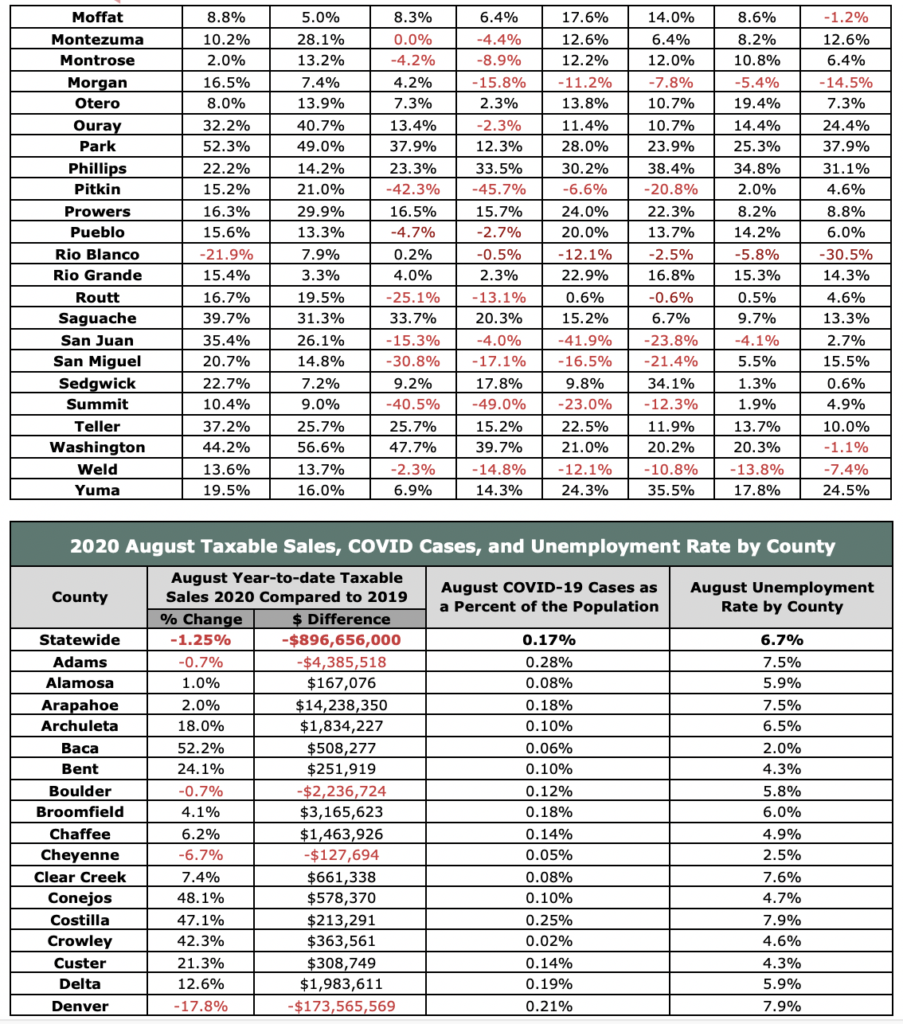
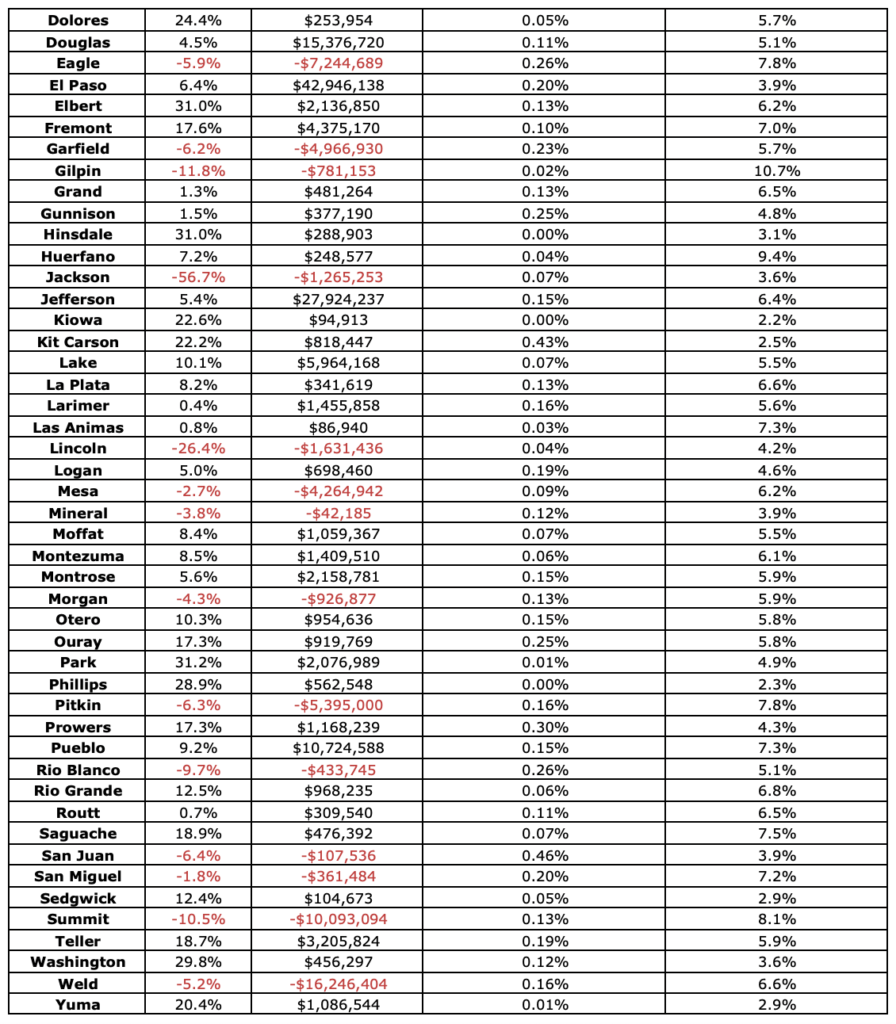
Impact on Colorado Counties Taxable Sales
The Colorado Department of Revenue releases a monthly County report summarizing the number of returns, gross sales, retail sales, state net taxable sales, and state sales tax.[ii] Understanding the decrease in taxable sales relative to a county’s openness can help policymakers and citizens understand the importance of looking at COVID on a case-by-case basis rather than a one-size-fits all method.
Key Findings:
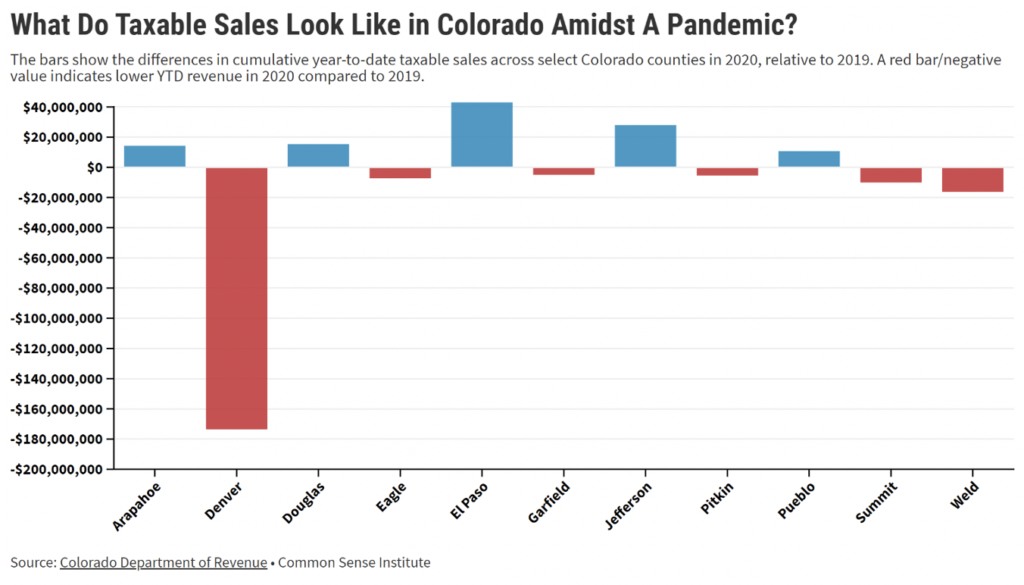
- In April, 38 of the state’s 64 counties had lower YTD taxable sales relative to 2019. As of August, 12 of those 38 counties continued to have lower taxable sales YTD.
- As of August, 16 counties of the state’s 64 counties had negative YTD taxable sales relative to 2019.
- Arapahoe, Douglas, and Jefferson are among some of the largest front range commuter counties that had negative YTD taxable sales through April, yet by August were positive.
- Jackson County YTD taxable sales in August was 57% below 2019 YTD levels, yet had a UE rate of 3.6%.
- Denver County had a 18% decrease in YTD through August, a $174 million shortfall in August, and a UE rate of 8%.
After several months of enduring the COVID29 restrictions, it is evident that select cities and counties were hit harder than others. There are likely many factors contributing to the economic turmoil brought upon in 2020, a few potential reasons are listed below.
- City industry mix – Cities such as Vail and Aspen are amongst a few mountain communities that had disproportionate employment impacts due to share of regional economy contributed by large ski resorts which were forced to end their winter seasons very early.
- City mix of residential commercial – Denver, which typically benefits from large numbers of in-commuters, faced larger revenue losses due to the near elimination of daily commuters, business travelers, and evening commuters going to events or dinners. Cities and counties outside the urban core may benefit from local citizens staying in their homes and shopping more locally than usual.
- Degree to which businesses stayed open and consumers have returned to normal spending Patterns – While the State’s executive administration issued many statewide orders related to public health, including the March and April Safer-at-Home orders, some cities implemented stricter polices, while others received exemptions. There is an apparent difference between the citizens of different counties or cities responses to the orders. In some regions, people have continued to shop in retail stores or frequent restaurants and bars at higher rates than others.
Sources
Colorado Covid-19 webpage: https://covid19.colorado.gov/data
Colorado Department of Revenue: https://cdor.colorado.gov/retail-sales-reports
City of Aspen: https://cityofaspen.com/417/Financial-Reports
City of Boulder: https://bouldercolorado.gov/tax-license/revenue-reports
City of Colorado Springs: https://coloradosprings.gov/sales-tax/page/sales-tax-reports?mlid=28876
City of Fort Collins: https://www.fcgov.com/salestax/salesreport.php
City of Steamboat Springs: https://steamboatsprings.net/DocumentCenter/Index/14
City of Vail: https://vailgov.com/departments/finance/financial-reports
Aurora, Denver, and Douglas variables were collected from a point of contact in their sales tax department.
[i] https://covid19.colorado.gov/data/covid-19-dial/covid-19-dial-dashboard
[ii] https://cdor.colorado.gov/retail-sales-reports
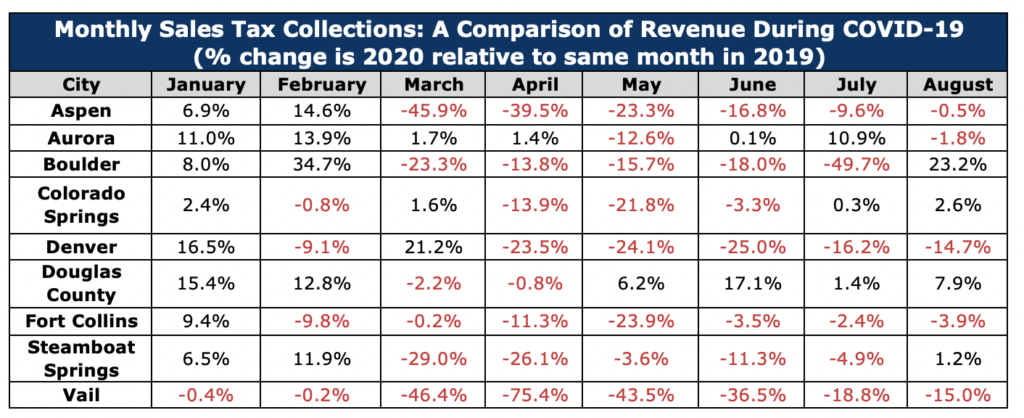
Monthly revenue estimates suggest differing impacts on sales tax revenue across Colorado cities. While some are experiencing large monthly reductions relative to previous year’s collections, others are equal to, or even slightly above.
Key Findings:
- Sales tax revenue in Vail for the months of April, May and June, was consistently more than 35% lower than the same three months in 2019. This stands in distinct contrast to Aurora, that saw a 12.6% decline in May 2020 sales tax revenue relative to the previous May but saw slightly increased revenue in April and June from the same months in 2019.
- Both Denver and Boulder experienced consistently lower sales tax revenue for the months of April to June relative to 2019. The three-month average sales and use tax revenue for Denver was -24.2%, or -$17,500,00 per month, and Boulder was -15.8%, or -$1,900,000 per month between April and June compared to 2019.
- Both Aurora and Douglas County have seen much less of an impact, as sales tax revenue slightly increased relative to 2019 during a few months. Total sales and use tax revenue from January to June 2020 in Aurora, is nearly 3% above 2019 levels for the same months. May sales and use tax revenue in Douglas County was 4.5% above May 2019 levels.