

Authors: Tamra Ryan, Coors Economic Mobility Fellow; Kelly Caufield, Cole Anderson
Coors Fellowship for Economic Mobility
The Coors Fellowship for Economic Mobility focuses on issues that stifle greater economic independence of the individual and embrace tried-and-true economic principles of free enterprise centered around choice, access, and competition. The fellowship is designed to spur thoughtful policy discussion and potential solutions around the economic and fiscal ramifications of increasing workforce opportunities, with a focus on increasing economic prosperity of all workers.
Named in honor of the Coors family, the fellowship pays tribute to the vision, hard work, true grit, relentless determination, and fearless innovation that were the hallmarks of the pioneering spirit that characterized the success of the men and women who founded Colorado as the place where opportunity abounds. Providing that same opportunity for individuals and families to prosper, grow and achieve their dream today, just as our founders did, is at the heart of the Coors Fellowship and the legacy of that family name.
About the Authors
Tamra Ryan is the 2023 Coors Fellow for Economic Mobility at the Common Sense Institute. She is the CEO of Women’s Bean Project, a social enterprise providing transitional employment in its food manufacturing business to women attempting to break the cycle of chronic unemployment and poverty.
Tamra is a former partner and board member for Social Venture Partners-Denver and Social Enterprise Alliance. Congressman Mike Coffman (R-CO) recognized Tamra’s servant leadership and entered it into the Congressional Record of the 115th Congress, Second Session in May 2018. She was honored by the Colorado Women’s Chamber of Commerce as one of the Top 25 Most Powerful Women in Colorado, and in 2022 and 2023 as a Titan100 CEO and Social Entrepreneur of the year by the Colorado Institute for Social Impact. She was a presenter at TEDxMilehigh and is a highly sought-after speaker for topics such as compassionate leadership and social enterprise.
Kelly Caufield is the Executive Director of Common Sense Institute Colorado. Kelly brings nearly 20 years of policy, research, and advocacy experience to her role.
Before joining CSI, Kelly served as the Vice President of Government Affairs for Colorado Succeeds, a coalition of business leaders dedicated to improving public education. Kelly also has experience as a federal lobbyist for the Society for Human Resource Management (SHRM), focusing on labor and employment policy on behalf of 275,000 HR business professionals. Before joining SHRM, she spent a total of eight years on Capitol Hill working on the U.S. Senate Health, Education, Labor, and Pensions Committee and served as a legislative director for a U.S. Congressman. She attended the College of William and Mary in Virginia for her undergraduate degree and George Washington University for her master’s degree in Public Policy.
Cole Anderson is a Research Analyst with Common Sense Institute. He is an alum of the University of Denver where he graduated with a double-major in Public Policy and Economics. His work covers a range of issues including homelessness, inflation, housing, and education.
CSI wants to thank Cross Purpose and Onsi Fakhouri for their contributions to this report, including significant analysis and description of tools used to help families navigate the benefits cliff in Colorado.
About Common Sense Institute
Common Sense Institute (CSI) is a non-partisan research organization dedicated to the protection and promotion of our economy. As a leading voice for free enterprise, CSI’s mission is to examine the fiscal impacts of policies laws and educate voters on issues that impact their lives.
CSI’s founders were a concerned group of business and community leaders who observed that divisive partisanship was overwhelming policy making and believed that sound economic analysis could help people make fact-based and common sense decisions.
CSI employs rigorous research techniques and dynamic modeling to evaluate the potential impact of these measures on the Colorado economy and individual opportunity.
Teams & Fellows Statement
CSI is committed to independent, in-depth research that examines the impacts of policies, initiatives, and proposed laws so that Coloradans are educated and informed on issues impacting their lives. CSI’s commitment to institutional independence is rooted in the individual independence of our researchers, economists, and fellows. At the core of CSI’s mission is a belief in the power of the free enterprise system. CSI’s work explores ideas that protect and promote jobs and the economy, and the CSI team and fellows take part in this pursuit with academic freedom. The CSI team’s work is informed by data-driven research and evidence.
The views and opinions of fellows do not reflect the institutional views of CSI. CSI operates independently of any political party and does not take positions.
Table of Contents
About Common Sense Institute. 3
Introduction and Key Findings. 5
Who Is Most Likely to Earn the Minimum Wage. 10
Work Requirements and the Benefits Cliff 10
Impact of Inflation on Low-income Individual 14
Minimum Wage Increase Impact on Employers. 15
Economic Analysis of Minimum Wage Policy and Impact on the Colorado Economy. 16
What Programs or Policies Incentivize Work. 20
Introduction and Key Findings
Hard work is the key to success. Or is it?
For centuries, successful leaders have shared the secrets to their success: hard work, determination, commitment. It’s a notion that has been engrained in our spirit and foundation as pioneers and Americans. From former Secretary of State Colin Powell proclaiming, “A dream does not become reality through magic; it takes sweat, determination and hard work,” to legendary football coach Vince Lombardi, “The price of success is hard work.” Over and over we have been told that success and the American Dream is possible with hard work.
Unfortunately, current programs and policies that drive a safety net for individuals simply do not support that premise. The long-term goal of creating a safety net of government programs was to provide support for those in need and reduce poverty, thus creating a more equal and stable society. By providing assistance with basic needs such as food and housing, such programs sought to prevent individuals and families from falling into extreme poverty and help them achieve greater economic mobility.
The long-term question for policy makers is whether current public policy is a safety net or quicksand.
Today, many of the programs and policies that make up our safety net discourage rather than incentivize work for employees or seeking higher wages, forcing individuals into a cycle of government programs and poverty. In fact, some of the proposals create a “benefits cliff,” a situation where a small increase in income leads to the cessation of certain government benefits, resulting in a net decrease in income.
This can create a disincentive for people to work harder or take on higher-paying jobs because they would lose important benefits such as Medicaid, food stamps, or housing assistance. The benefits cliff can create a poverty trap for low-income individuals and families, making it difficult for them to break the cycle of poverty.
In March 2023, the Economic Policy Institute published a report in which they presented data confirming that between 2019 and 2022, low wage workers across the United States have experienced 9% real wage growth – the greatest since 1979 and greater than any other group.
Despite recent significant increases, the cycle of poverty continues to make it necessary for policy makers to consider long-term solutions including tax incentives, education, and training to assist more Coloradans on the pathway of higher wages.
Specifically, this paper examines the impact of an increased minimum wage on employees, employers, and the Colorado economy.
Key Findings
- The “benefits cliff” is real and exists at discrete wage levels that may hinder some individuals from pursuing increased wages. Those most impacted by a reduction in benefits as their income increases are single parent families. As a result of a $1 wage increase from $30 to $31, a single parent with one child will lose $6.25 in hourly benefits, this is the benefit cliff. The benefit cliff for families with more children is more pronounced at a higher wage. Modeling shows some families are marginally worse off per hour than if they had never received the increase in the minimum wage. Minimum wage increases reduce employment, increase prices, and reduce consumer purchasing power.
- Minimum wage adjustments shift much of the burden from the public sector onto the private sector without substantially undoing the cost-of-living adjustment. In this way households move in lockstep, roughly maintaining the same standard of living, and not getting ahead, in the midst of a confusing and complex swirl of changing income and benefits levels.
- Expenditures on the specified public benefit programs to help low wage households in Colorado is a significant cost, approximately $12.24 billion (federal and state spending) in 2021.
- The full impact of minimum wage increases can lower employment opportunity and suppress real wages. An economic modeling simulation of raising the minimum wage to $17.29, equivalent to Denver’s 2023 rate, across the 7 Denver Metro counties shows a host of adverse economy-wide impacts, that disproportionately impact lower wage workers.
- Minimum wage increases have several economy-wide impacts, including:
- Reduced levels of employment: Increasing the minimum wage to $17.29 per hour reduces overall employment by
- Increased prices: The PCE index, a similar measurement of consumer prices to the CPI, increased by 1.43% on average through 2033.
- Reduced real disposable income per capita: Despite nominal wage increases for some workers, the loss of jobs, combined with higher overall prices reduced real disposable income per capita by 0.52%.
- Increasing the marginal productivity of labor for low wage workers is necessary to alleviate poverty. Staying employed and attaining education beyond high school, along with career specific training is key to long-term economic success. For those able to maintain persistent employment, considered to be at least 27 months (about 2 and a half years) out of a 36-month period, the incidence of poverty is only 2.6%. Overall, getting more people to work consistently will impact poverty perhaps more than any other actions.
- Low wage workers, because of the way the minimum wage works, keeps up with inflation, however, they never get ahead. The minimum wage changes are tied to inflation, they receive cost-of-living adjustments, thus, increased wages lead to an overall net zero change.
The Issue/Background
In 2016, Colorado voters approved Amendment 70 to increase the state’s minimum wage to $12 per hour by 2020 and allow annual cost-of-living adjustments thereafter. In 2023, Colorado’s minimum wage is $13.65 per hour and Denver’s is $17.29 per hour.
By increasing its minimum wage, Colorado follows several states and cities attempting to increase their minimum wages to a level closer to the self-sufficiency wageThe self-sufficiency standard was created by the Center for Women’s Welfare (CWW) at the University of Washington. It is a budget-based living wage measure that defines the real cost of living for working families at a minimally adequate level. The standard is an alternative affordability measure to the official poverty measure established by the federal government. The self-sufficiency standard is one way of defining the amount of income working families need to meet basic needs (excluding taxes) without public subsidies (e.g., public housing, food stamps, Medicaid, and childcare) and without private or informal assistance. The amount varies by family composition and location, in order to show the household income required to meet local housing, childcare, food, health care, and transportation expenses. The CWW makes available the self-sufficiency standard for every county in all 50 states and the District of Columbia.[i] The 2023 self-sufficiency wage for several Colorado counties is included in Table 3 below. The gap between minimum wage and self-sufficiency is wide enough that, for most families, increasing the minimum wage alone is not a path to achieving self-sufficiency. Closing the gap requires more education and training, among other considerations outlined in this report. Policy makers could intentionally decide to increase or decrease that standard of living (e.g., to bring it closer to the self-sufficiency standard) or to step away from the concept of a social safety net in favor of privatized solutions.
The self-sufficiency standard is distinct from the Federal Poverty Level (FPL), a measurement defined in the 1960s that assumes food is one-third of a household’s costs and all other expenses fit within the remaining two-thirds. Today, however, food accounts for only about 13% of America’s household expenses . The FPL does not account for rising healthcare and housing or other changes in household costs such as the cost of technology. Though the FPL is adjusted annually for cost-of-living increases, it has become inadequate at predicting families’ actual costs of living. Additionally, the FPL is the same for each of the 48 contiguous states and does not reflect regional variations in cost of living. Several social safety net programs exist to support families experiencing the gap between low wages and basic needs costs.
These include the Supplemental Nutrition Assistance Program (SNAP), also known as food stamps, Medicaid, housing and childcare subsidies, and Colorado’s low-income energy assistance program (LEAP). Each of these programs has income eligibility thresholds and several also require claimants to work to maintain benefits. Although these programs are implemented at local (city and county) levels, the income thresholds for eligibility are, in most instances, based on the FPL.
Table 1 shows the most recent statistics available on specified social program benefits, recipients, and the share of Coloradans receiving benefits. The table represents both federal and state spending. The approximate spending on specified public social benefits in 2021 was $12.24 billion. Medicaid represented 85% of total public social benefit expenses, supporting more than 1.55 million Coloradans or more than 1 in 4 people in the state at the end of 2021. As of February 2023, the number grew to over 1.7 million. There were 1.2 million enrolled in January 2020, right before the start of the pandemic, and under 400,000 in FY08 prior to the start of the financial crisis.
| Table 1 – | |||
| Program | Total Spent In 1 Year in CO – 2021 | # of People Receiving Benefits | |
| SNAP | $1.3B[ii] | 499,000[iii] (2021) | 8.6% |
| TANF | $424M[iv] | 28,059[v] (2021) | 0.5% |
| Medicaid | $10.4B[vi] | 1,556,000[vii] (2021) | 27% |
| LEAP | $42.6M[viii] | 77,444[ix] (2021) | 1.3% |
| Section 8 | $77.5M[x] | 15,700[xi] (2020) | 0.3% |
| Total | $12.24B | ||
Policy makers consistently put forth increases in the minimum wage as a means to increase the standard of living for low wage workers. Figure 1 shows the evolution of the minimum wage in Colorado and Denver since 2007. At $17.29/hour, Denver’s minimum wage requirement just exceeds the self-sufficiency standard wage for single person ($16.89/hour) but is far below the self-sufficiency standard for households of more than one person. Later in this report, CSI models the economic impact of increasing the minimum wage to $17.29/hour upon output, employment, and prices in the Denver metro region.
Staying employed and receiving education beyond high school, along with career-specific training, is key to long-term economic success. For those able to maintain persistent employment, considered to be at least 27 months (about 2 and a half years) over a 36-month period, the incidence of poverty is only 2.6%.[xii] Overall, getting more people to work consistently will reduce poverty perhaps more than any other action. Policies should be calibrated to ensure that Colorado workers are not discouraged from staying employed. A future paper will examine the beneficial impact of education and training on economic mobility as well as how policy can make a difference.
Figure 1 – Colorado vs. Denver Minimum Wage Growth
The 2023 Federal P$17.29 per hour for full-time work provides only enough income to exceed the FPL by a small margin.
| Table 2 – 2023 Federal Poverty Guidelines[xiii] | |||||
| Family Size | FPL | 133% | 150% | FT @$13.65 | FT@$17.29 |
| Individual | $14,580
($7.01/hour) |
$19,391 ($9.32/hour) | $21,870 ($10.51/hour) | $28,392
($13.65/hour) |
$35,963 ($17.29/hour) |
| Family of 2 | $19,720
($9.48/hour) |
$26,228
($12.61/hour) |
$29,580 ($14.22/hour) | $28,392 ($13.65/hour) | $35,963 ($17.29/hour) |
| Family of 4 | $30,000 ($14.42/hour) | $39,900
($19.18/hour) |
$45,000 ($21.63/hour) | $28,392 ($13.65/hour) | $35,963 ($17.29/hour) |
Table 3 shows the annual self-sufficiency income standard for various family sizes in three Colorado counties. A minimum full-time wage of $17.29 per hour provides enough annual income for a single adult to earn enough to meet the self-sufficiency standard. In a household with a child, the minimum wage does not provide enough income to meet the standard.
| Table 3 – Self Sufficiency Standard Annual Income[xiv] | ||||
| County |
|
|
|
|
| Denver | $35,160 ($16.90/hour | $68,799 ($33.08/hour) | $85,459 ($40.61/hour) | $91,607 ($44.04/hour) |
| El Paso | $32,589 ($15.67/hour) | $62,731 ($30.15/hour) | $74,313 ($35.73/hour) | $84,651 ($40.70/hour) |
| Mesa | $27,901 ($13.41/hour) | $54,323 ($26.12/hour) | $64,730 ($31.12/hour) | $74,658 ($35.89/hour) |
Who Is Most Likely to Earn the Minimum Wage
Setting aside minimum-wage workers younger than 25 years old, vulnerable workers with barriers to employment across the state are most likely to earn minimum wage. These barriers include the lack of a high school diploma, a lack of job skills, criminal background, and, for women, living in poverty with children. Nine percent of Coloradans over the age of 25 do not have a high school diploma, nearly 527,000 live in poverty, and 1.2 million have a criminal record.
For those at the bottom of the pay scale, regular full-time employment is inadequate to support themselves and their families. Even before recent inflationary pressures, many individuals and families received supplemental assistance such as SNAP, housing subsidies, energy assistance, and Medicaid to make ends meet.
In order to limit overall poverty rates and societal costs, many of these benefits have work requirements. In fact, most recipients of public assistance live in households with at least one employed person.
Work Requirements and the Benefits Cliff
Today, many of the programs and policies that make up our safety net discourage rather than incentivize work for employees, forcing individuals into a cycle of government programs and poverty. In fact, some of the proposals create a “benefits cliff,” a situation where a small increase in income leads to the cessation of certain government benefits, resulting in a net decrease in income.
This can create a disincentive for people to work harder or take on higher-paying jobs or delay pay increases because they would lose important benefits such as Medicaid, food, child care, or housing assistance. The benefits cliff can create a poverty trap for low-income individuals and families, making it difficult for them to break the cycle of poverty.
Overall, work requirements associated with public assistance programs can benefit workers and their families. However, there are also income thresholds for benefits eligibility which workers may not exceed without losing those benefits.
Although Colorado minimum wages are determined locally, income thresholds for benefits eligibility are set using FPL as a basis. Because of the recent increases in minimum wage, low-wage Colorado earners exceed many income thresholds for benefits that are essential to make ends meet. Increases in the minimum wage, in many instances, do not change eligibility for public benefits. However, increased earnings can result in reductions in public assistance and create a net household income decrease. This can reduce low-wage workers’ incentive to work or make them reluctant to accept pay increases because they risk being materially better-off at lower income levels.
Added to this pressure are changes from early 2023 when additional assistance from SNAP and Medicaid, put into effect during the public health emergency caused by the pandemic, expired. States received increased funding from the federal government for SNAP and Medicaid throughout the pandemic, but just recently the temporary SNAP increases expired on March 1. In terms of Medicaid, coverage will end for an estimated 315,000 Coloradans, with disenrollments spread out across 2023 or early 2024.[xvi] The timing of the changes to the SNAP benefits related to both the minimum wage increases and the expiration of the emergency order are unfortunate as food costs continue to increase—by 11.8% in 2022 alone.[xvii]
Added to the complexity, the benefits administration and eligibility determinations are siloed, so that families must work with each benefits provider to determine how their benefits will be affected by changes in their wages.
Enter Cross Purpose, a faith-based nonprofit organization based in Denver that offers career and leadership development programs to help underserved people gain access to opportunities and create lasting generational change. Having witnessed the challenges working families face when the public benefits helping them keep their family afloat are cut, Cross Purpose developed a tool to help families plan for the impact of increased wages on one’s household. Cross Purpose’s tool consolidates information from all forms of public assistance. It allows individuals to enter their family’s specific information, then input the adjusted income to immediately show which benefits will be affected by the income increase and then the overall net increase or decline in household income.
The Cross Purpose Financial Planner is one tool designed to help low-income households, working with a financial coach, make financial decisions with confidence. Such decisions are challenging because the government benefits that a household receives, whether in the form of subsidies, stipends, or tax credits, changes in unintuitive ways as the household’s makeup, income, and expenses change. For example, the model can generate a scenario for a household of one adult and two children living in Denver County and the user can explore how the benefits received by this household change as a function of hourly wage. Some of these scenarios rely upon estimates of certain cost categories (for example: once the household loses eligibility for a childcare benefit, what is the typical cost it would incur for unsubsidized childcare?).
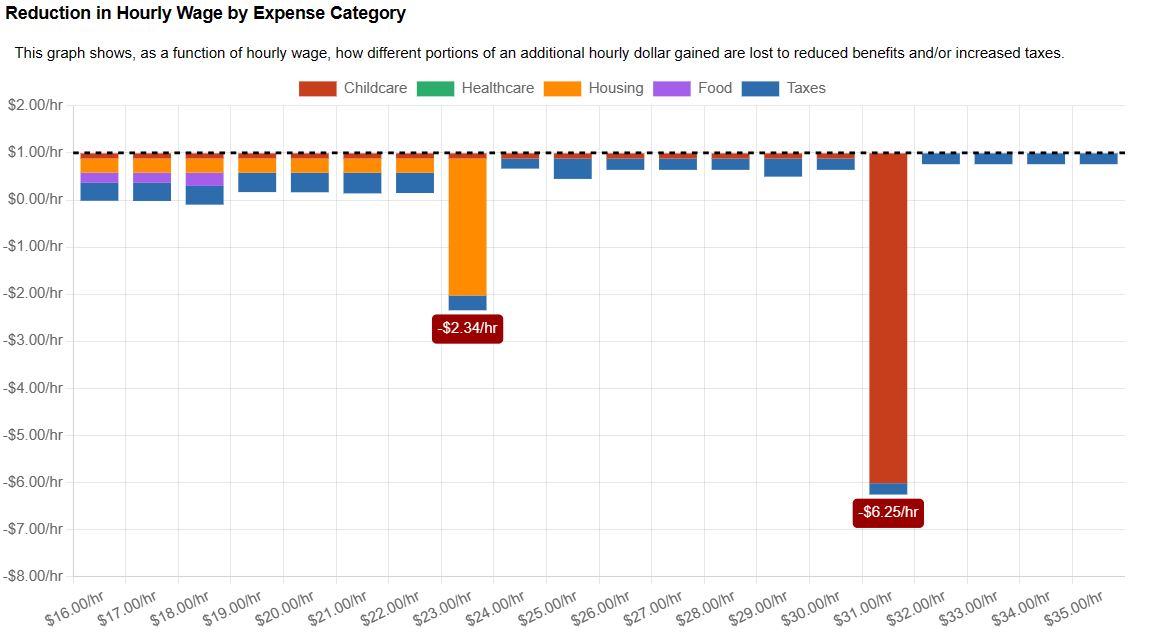
Figure 2 shows that a single parent with one child faces two distinct benefit cliffs. The first cliff is caused by the loss of Section 8 housing benefits. This occurs when the parent receives a wage increase from $22 per hour to $23 per hour. The parent’s increased hourly wage increases their income and makes them ineligible for this benefit, causing a net estimated loss of $2.34 per hour. The parent hits the second cliff upon receiving a pay increase from $30 to $31 per hour. The increased income makes them ineligible for the Colorado Child Care Assistance Program (CCCAP) and causes an estimated loss of $6.25 per hour due to decreased CCCAP benefits and a higher tax rate.
* The self-sufficiency wage for a one adult, one child household is $33.08
To fully understand how the financial picture of a household has changed between 2022 and 2023, it is necessary to tease apart several factors. Table 4 captures these various factors in a highly detailed manner across multiple benefits, all expressed in $/hour.
When reviewing this table, it is important to understand that federal and state benefits programs naturally become more generous over time as regulations adapt to inflation. Tax brackets shift and the Federal Poverty Level is increased in response to the federal government’s estimates of inflation. This results in a natural increase in benefits and credits to all households in 2023 over 2022 and is not predicated on any change in household income. This is acknowledged in the first section of the table.
For example, a single-parent family with two children living in Denver County will receive an increased monthly allotment of food stamps (SNAP). When expressed in units of $/hour this increased allotment is equivalent to a $0.55/hour raise. That value is converted to a yearly amount then divided by the total number of hours worked per year at a full-time job: 16,640 = (52 x 40 x 8). On balance, this family, which is assumed to be participating in all major available benefits programs and tax credits, will experience an effective increase of $1.14/hour in benefits and tax credits from 2022 to 2023.
Secondly, and independent from the more generous taxes and benefits, Denver has instituted an inflation-adjustment to the minimum wage of $1.42/hour.[xviii] Though this increases some households’ earned incomes, it will also cause families’ benefits eligibility levels to shift. In the case of a single-parent, two child household, the increased wage results in a reduction of SNAP benefits of about $0.31/hour. On balance—and somewhat unintuitively—the $1.42/hour wage increase leads to a decrease in that household’s available funds: now, instead of the effective $1.14/hour increase noted above, due to the reduction in SNAP and several other benefits, the household will only earn an effective $0.99/hour more than in 2022 (see Table 4).
Finally, while the family does come away with a net $0.99/hour increase after both the 2023 adjustments and the minimum-wage adjustment are accounted for, this is not the complete picture. To understand how the household’s living standard is impacted we must account for inflation to determine if the $0.99/hour increase is enough to compensate for the increased costs of living. Once inflation (assumed to be ~8% year-over-year) is taken into consideration, we find that the family’s net income change is -$0.09 —which is largely consistent with $0.
The bottom line is the minimum wage adjustment shifts much of that new burden from the public sector onto the private sector without substantially undoing the cost-of-living adjustment. In this way households move in lockstep, roughly maintaining the same standard of living, and not getting ahead, in the midst of a potentially confusing and complex swirl of changing income and benefits levels.
| Table 4 – Change in the Financial Situation for Families on Minimum Wage
in Denver County between 2022 and 2023 ($/hr) |
|||
| Single | Single + 1 Child | Single + 2 Children | |
| More generous benefits due to benefits inflation adjustments going from 2022 to 2023 | |||
| Childcare | $0 | $0.05 | $0.06 |
| Section 8 | $0 | $0 | $0 |
| SNAP | $0 | $0.41 | $0.55 |
| Healthcare | $0.08 | $0.06 | $0 |
| Taxes | $0.08 | $0.36 | $0.53 |
| Net Benefit Gain | $0.16 | $0.88 | $1.14 |
| Increase in minimum wage | |||
| Increase in Minimum wage | +$1.42 | +$1.42 | +$1.42 |
| Minimum Wage Increase + Increased Benefits | +$1.58 | +$2.30 | +$2.56 |
| Resulting changes in benefits due to the increased minimum wage | |||
| Childcare | $0 | -$0.17 | -$0.17 |
| Section 8 | $0 | -$0.43 | -$0.43 |
| SNAP | $0 | -$0.31 | -$0.31 |
| Healthcare | -$0.20 | -$0.13 | -$0.04 |
| Taxes | -$0.34 | -$0.55 | -$0.63 |
| Net Benefit Loss | -$0.54 | -$1.59 | -$1.58 |
| (Minimum Wage + Increased Benefits) – Benefit Loss | $1.04 | $0.72 | $0.99 |
| Inflation adjustment to capture increased cost of living in 2023 vs 2022 | |||
| Inflation Adjustment Going from 2022 to 2023 | -$1.01 | -$0.81 | -$1.08 |
| Net effective change in income in expressed in 2022 $/hour | |||
| Net Effective Change in Income After Adjusting for Inflation | $0.03 | -$0.09 | -$0.09 |
Impact of Inflation on Low-income Individuals
Figure 3 shows the annual income, consumption, and income minus consumption for the upper tier of the lowest income quintile from 2019 to 2023. Consumption is higher than annual income every year, producing a negative net effect. Presumably, people in this group are able to consume more than their annual income by using public benefits. Because their income is not keeping pace with the costs of their consumption due to inflation, they’re falling farther behind. This problem is compounded even more for families with children.
Figure 3 – Lowest Quintile Annual Income and Consumption
Minimum Wage Increase Impact on Employers
Increases to the minimum wage can cause employers to struggle to keep low-wage employees working. Unable to justify retaining vulnerable workers for the hourly wage required, employers may choose to cut these employees, or they may invest in automation. Increased minimum wages also put pressure on employers to increase mid-range wages to differentiate roles of varying responsibility. These increases are not isolated to pay but affect benefits tied to employees’ base pay and other costs such as unemployment insurance and payroll taxes. Often, firms strategically respond to minimum wage increases by changing worker schedules to offer fewer hours or consolidate positions and hire fewer workers. The net effect for low-wage employees is often fewer jobs or hours and thus a reduction of household income.
Currently the federal minimum wage is $7.25 and has not been raised in more than a decade. In 2021 lawmakers considered a proposal to gradually increase the federal minimum wage to $15 per hour by 2025. The Congressional Budget Office examined the impact of how this increase would affect employment and family income.[xix] While some families benefit from the increase, other families would experience decreased household income because some workers in the family become unemployed. In 2021, the CBO produced an additional report citing jobs lost due to a minimum wage increase to $15 by 2025, finding that employment would be reduced by 1.4 million workers.[xx] Overall, for both workers and employers, higher minimum wages disincentivize work and job creation.
Economic Analysis of Minimum Wage Policy and Impact on the Colorado Economy
CSI modelled the impact of increasing the minimum wage to $17.29 per hour in the Denver metro area using the REMI PI+ model. The model does not include the City and County of Denver as a standalone region. It has three regions: Denver Metro, Denver South, and the rest of Colorado. Denver Metro includes Adams, Boulder, Broomfield, Denver, and Jefferson Counties. Denver South includes Arapahoe and Douglas Counties. For this modeling exercise we chose to apply the minimum wage increase to Denver Metro and Denver South.
Using wages from the Bureau of Labor Statistics (BLS) for the Denver-Aurora-Lakewood MSA, the occupational categories that had wage rates below the new minimum wage rate of $17.29 per hour were identified.
Next, the percent increase in wage rates necessary to raise the wage rate for each of the 695 occupational categories in the BLS data was calculated. There were 483 occupational categories that had employees earning less than $17.29 per hour. Each of the occupational categories was mapped into the appropriate REMI industrial category. REMI has 72 industrial categories. Because multiple occupational categories map into a single industrial category, the weighted average increase for each industrial category was calculated and input into REMI via the wage rate variable.
The wage increases result in a change to the cost of labor and production, as well as a substitution between capital and labor usage. The increased cost of labor causes employers to reduce the level of employment. The minimum wage reduces overall employment by 0.2% in 2023 from the baseline level of employment and further reduces it in 2033 by 1.6%, as shown by Figure 4.
Figure 4 – Impact of Minimum Wage Increase on Employment in the Denver Metro Area
Figure 5 shows the baseline level of employment and employment after increasing the minimum wage to $17.29 per hour. Employment growth begins to taper off beginning in 2027 though it still increases. The minimum wage increase reduces the level of employment in all years as employers reduce employment in response to higher labor costs.
Figure 5 – Impact of Minimum Wage Increase on Employment in the Denver Metro Area
Table 5 shows the model results of increasing the minimum wage to $17.29 per hour in terms of the percentage change relative to the baseline model. Employment as previously discussed is lower every year. Gross domestic product is lower than the baseline in every year, and by 2033 is 0.93% below the baseline. Inflation, as measured by the personal consumption expenditures price index, is higher than the baseline by 1.43% on average over 2023 to 2033. As advocates of the minimum wage argue, personal income increases relative to the baseline by 1.15% on average from 2023 to 2033. Raising the cost of labor by increasing the minimum wage without increased operational efficiencies or increased quality of products and services to offset the higher labor costs raises prices. The result is that real incomes are lower due to the inflationary impact of the wage increases. Therefore, the minimum wage increase does not increase the standard of living for minimum wage workers.
Compounding the problem is that the workers who are most vulnerable to losing their jobs as a result of minimum wage increases are those whose productivity is low—the very people the policy is designed to help.
| Table 5– Impact of Minimum Wage Increase on Denver Metro Area (Percent Change from Baseline) | |||||||||||
| Category | 2023 | 2024 | 2025 | 2026 | 2027 | 2028 | 2029 | 2030 | 2031 | 2032 | 2033 |
| Total Employment | -0.18% | -0.34% | -0.53% | -0.73% | -0.91% | -1.08% | -1.22% | -1.34% | -1.43% | -1.51% | -1.57% |
| Gross Domestic Product | 0.01% | -0.09% | -0.22% | -0.37% | -0.50% | -0.62% | -0.72% | -0.80% | -0.86% | -0.90% | -0.93% |
| Personal Income | 1.71% | 1.66% | 1.54% | 1.40% | 1.25% | 1.10% | 0.98% | 0.87% | 0.78% | 0.70% | 0.64% |
| Real Disposable Personal Income per Capita | -0.08% | -0.22% | -0.36% | -0.48% | -0.57% | -0.63% | -0.66% | -0.68% | -0.68% | -0.68% | -0.66% |
| PCE-Price Index | 1.58% | 1.55% | 1.52% | 1.49% | 1.45% | 1.42% | 1.39% | 1.37% | 1.35% | 1.33% | 1.32% |
What Programs or Policies Incentivize Work
There are programs shown to incentivize work, most notably the Earned Income Tax Credit (EITC) and the Child Tax Credit (CTC). EITC is a tax break for low- and moderate-income workers. To qualify, individuals must have worked in the year for which they are requesting the tax credit. Credits range from $560 for a single adult to $6,935, depending on tax filing status, income, and number of dependent children in the household. EITC is most impactful for the bottom two quintiles of earners and creates a strong incentive for non-workers to become employed. Research on EITC shows that it is the first step toward economic mobility, since moving into the world of work is the first step to moving up the pay scale.
The National Bureau of Economic Research showed that EITC increases the share of women with lower education levels who work. EITC is widely acclaimed for lifting millions of people, including several million children, out of poverty, while also helping millions more avoid poverty. In 2017, one in six tax returns claimed the EITC.[xxi] Depending on the household type, workers become ineligible for this tax credit at between $43,000 and $56,000 of income per year.[xxii]
Colorado is one of 28 states plus the District of Columbia to offer a state EITC to those who qualify for the federal EITC. In Colorado, residents who receive the state EITC can get an additional 20% of whatever amount they receive from the federal EITC. New legislation, HB23-1112, has been introduced that would increase the EITC a Colorado resident can claim on his/her state income tax to 40% of the federal credit.
HB23-1112 also proposes to increase the share of federal credit that a resident individual can claim for the CTC on their state income tax return by 20%, 10%, or 5%, depending on the individual’s income level. CTC is newer and the effects have not been studied as extensively as EITC, but it is similarly designed in that it is only available to working families and phases out as earnings increase. The tax savings from the EITC and CTC has been shown to lead to benefits for all household members. Research suggests that children in these households do better in school, are more likely to attend college, and are expected to earn more as adults.[xxiii]
Recommendations
- States should push the federal government for more control over benefits thresholds, allowing them to vary based on regional cost of living rather than a one-size-fits-all federal poverty level standard.
- Because benefit cliffs can occur as a result of federal poverty level standards, states should lobby for gradual tapering of benefits, as opposed to dramatic decreases, to match gradual increases in household incomes and create a nimbler safety net that helps employees improve their economic mobility.
- States should audit their existing benefits and identify the benefit cliffs experienced by workers. In particular, Colorado could carefully examine the income thresholds for the Colorado Child Care Assistance Program (CCCAP), which is a state benefit and has a significant cliff.
- Entities within state governments and private organizations should create publicly accessible tools for workers to better understand the impacts of minimum wage increases on public benefits so that they can create realistic financial plans for their households. The aim should be to create a one-stop shop where beneficiaries can see the impact of increased wages on all benefits they are receiving to help them create realistic household financial plans. In addition to tools, individuals would benefit from coaching and financial planning.
- States should identify best practice models with proven records of increasing employment outcomes for low-income workers.
- Because they are effective at incentivizing work, Colorado lawmakers should support improvements to the Earned Income Tax Credit and Child Tax Credit for those qualifying for federal tax credits.
Conclusion
With recent increases in energy and food costs, family budgets are stretched even thinner. The increase of Colorado’s minimum wage to $13.65 and Denver’s to $17.29 will reduce employment, decrease real income, and raise prices in most cases. Low-wage workers only benefit when an increase in the minimum wage coincides with an increase in productivity or higher quality products and/or services. At the same time, it increases prices for everyone, making them marginally worse off if their wages do not increase.
Even as low-wage earners work to support their families, they experience a gap between minimum wage and self-sufficiency that public assistance can help cover in the short-term until the workers move up the pay scale to self-sufficient wages. Anywhere there are high minimum wages, like Colorado, the disparity between those wages and Federal Poverty Guidelines risks creating disincentives to work for low wage workers in the near term.
Whether benefits are cut incrementally (a ramp) or entirely (a cliff), the impact on households is material and can be demotivating. This is despite the fact that long-term employment decreases the need for just such benefits. Colorado should approach the federal government to make the case for smoothing income thresholds into more effective ramps (and not cliffs) and applying these thresholds regionally for the sake of incentivizing work and helping workers attain economic mobility through long-term employment.
We must make work worth it. When used well, public assistance can supplement household incomes for the short-term to help families make ends meet.
The real path to economic mobility is persistent employment, education, and training. If our systems help people maintain employment, eventually they will require less support and move out of poverty.
Appendix
Figure A1 shows the benefit cliff outlook for a family of one adult and two children. The single parent with two children still faces the same two benefit cliffs related to Section 8 housing and CCCAP, although these cliffs occur at higher wage levels than for a single parent with one child. When receiving a pay increase from $25 per hour to $26 per hour, the parent loses their Section 8 benefits entirely, costing them $1.57 per hour. However, the parent faces the largest benefit cliff of the four family size scenarios modeled when seeing their hourly pay increase from $38 per hour to $39 per hour. As a result of this $1 hourly pay increase, a parent with two kids will lose $15.28 per hour because of CCCAP benefits being cut off.
Figure A1 – One Adult Two Children
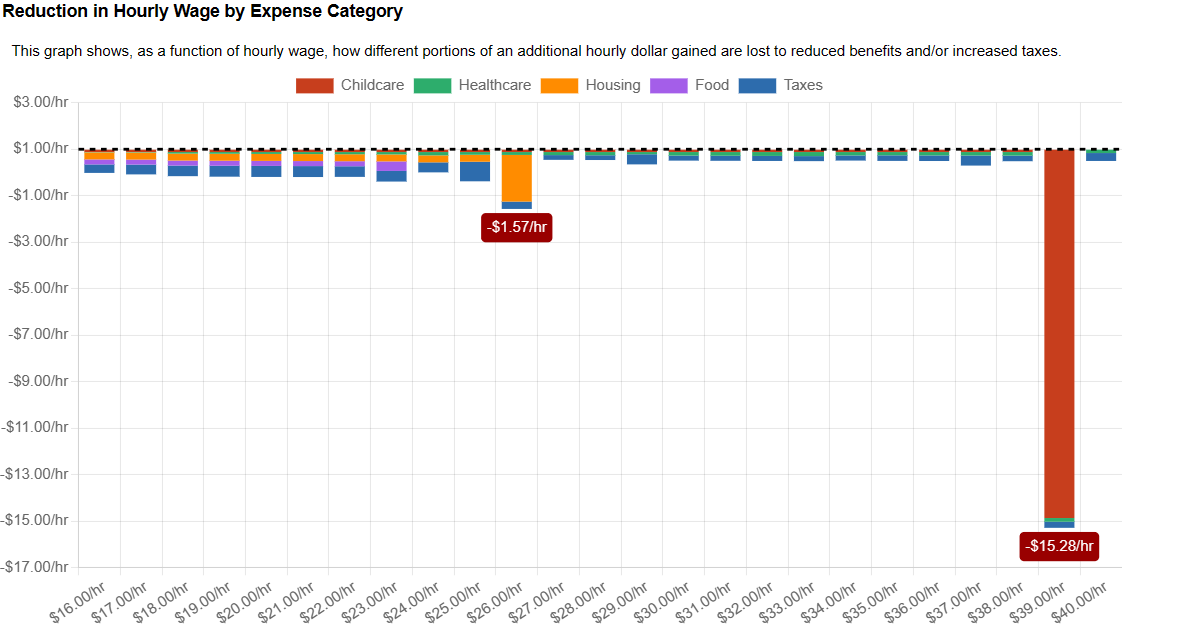
Figure A2 depicts the same benefit cliffs surrounding Section 8 and CCCAP as shown previously, but two parent one child households experience a slightly smaller CCCAP cliff than other family size units. Still, two adult one child households experience a $5.70 hourly decrease in CCCAP benefits for a $1 hourly pay increase when the working parent moves from $38, to $39 per hour.
Figure A2 – Two Adults one Child
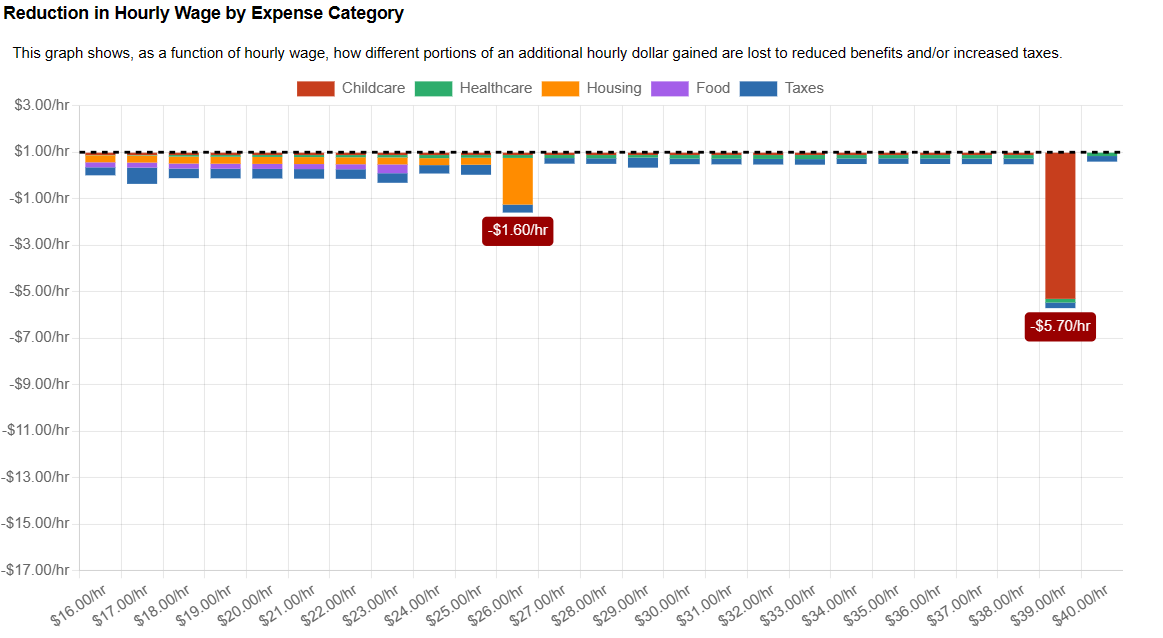
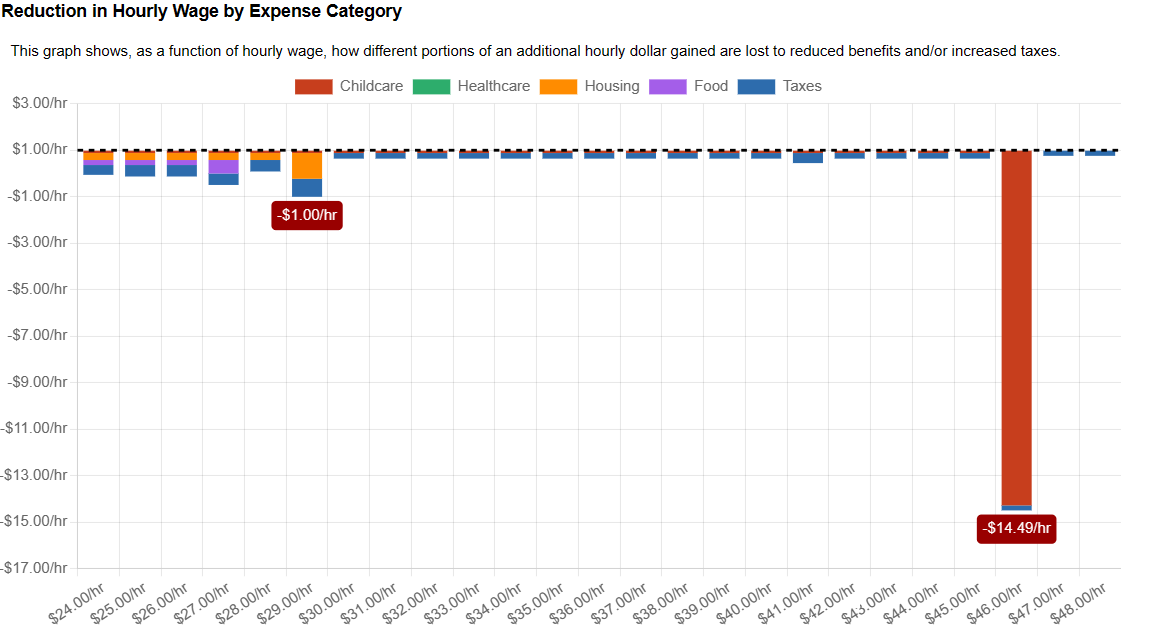
Figure A3 shows outcomes for a two adult, two child household. This family size experiences the smallest Section 8 benefit cliff of any of the modeled groups. Unfortunately, it also faces the second highest CCCAP benefit cliff, losing $14.49 per hour for a $1 per hour pay increase when moving from $45 to $46 per hour.
Figure A3 – Two Adults Two Children
[i] Colorado – Self Sufficiency Standard
[ii] snap_factsheet_colorado.pdf (cbpp.org)
[iii] Coloradans to see increase to SNAP benefits | Colorado Department of Human Services
[iv] FY 2021 TANF and MOE State Pie Charts (hhs.gov)
[v] Temporary Assistance for Needy Families (TANF): Fiscal Year 2021 (hhs.gov)
[vi] Annual Medicaid & CHIP Expenditures | Medicaid
[vii] ACA at 10 Years: Medicaid Expansion in Colorado | Colorado Health Institute
[viii] Weekly LEAP Stats By County – Google Sheets
[ix] Weekly LEAP Stats By County – Google Sheets
[x] 12-10-19hous-factsheet-co.pdf (cbpp.org)
[xi] 12-10-19hous-factsheet-co.pdf (cbpp.org)
[xii] Misunderstanding Persistent Poverty and Employment | American Enterprise Institute – AEI
[xiii] https://aspe.hhs.gov/sites/default/files/documents/1c92a9207f3ed5915ca020d58fe77696/detailed-guidelines-2023.pdf
[xiv] The Self-Sufficiency Standard for Colorado 2022 (selfsufficiencystandard.org)
[xv] Balancing paychecks and public assistance: How higher wages would strengthen what government can do | Economic Policy Institute (epi.org)
[xvi] Medicaid eligibility and enrollment in Colorado | healthinsurance.org
[xvii] https://gazette.com/premium/colorado-snap-reductions-food-stamp-benefits-to-return-to-pre-pandemic-levels-after-february/article_b2065dc4-976c-11ed-94f0-b77ff3c0fb04.html
[xviii] Denver’s minimum wage will increase, but you’ll have to wait until January 2023 – Denverite, the Denver site!
[xix] The Effects on Employment and Family Income of Increasing the Federal Minimum Wage (cbo.gov)
[xx] The Budgetary Effects of the Raise the Wage Act of 2021 (cbo.gov)
[xxi] Employment Effects of the Earned Income Tax Credit: Taking the Long View (nber.org)
[xxii] Earned Income and Earned Income Tax Credit (EITC) Tables | Internal Revenue Service (irs.gov)