

![]() SYNOPSIS | MODELING SCENARIOS | FULL REPORT
SYNOPSIS | MODELING SCENARIOS | FULL REPORT
Download the Model Used For this Report and Test How Proposition 118 Would Impact You
Did you know?
While Proposition 118 establishes a new state enterprise to collect the new wage premium, it does come with several costs to Colorado’s General Fund. First, as a large employer, state agencies will need to cover the employer share of premiums across its workforce. The net cost across the entire state, after accounting for the reduction in expenses for the cost of current paid leave benefits, is projected to be $10.9 million in FY24, 56% of which will come from the General Fund. Second, the paid leave benefit payments are not subject to state income taxes, therefore benefit payments that replace taxable income, will reduce state income tax revenue. The state fiscal note estimates the benefit payments to be $1.1B in FY25. Given the state’s current income tax rate of 4.63%, that could mean up to a reduction in state income tax of $50.9M
About the Authors
Lisa Strunk is the Development Research Partners Fellow with the Common Sense Institute. Lisa provided economic data and guidance on demographic projections, economic analysis, and report editing and technical review. She also contributed detailed model review and model results interpretation.
Chris Brown is the Director of Policy and Research with Common Sense Institute where he leads the research efforts of CSI to provide insightful, accurate and actionable information on the implications of public policy issues throughout the state of Colorado.
Erik Gamm is the Research Analyst with Common Sense Institute where he supports the research efforts of CSI. Erik recently graduated from the University of Michigan in 2020 with a Bachelor of Arts in Economics.
About Common Sense Institute
Common Sense Institute is a non-partisan research organization dedicated to the protection and promotion of Colorado’s economy. CSI is at the forefront of important discussions concerning the future of free enterprise in Colorado and aims to have an impact on the issues that matter most to Coloradans.
CSI’s mission is to examine the fiscal impacts of policies, initiatives, and proposed laws so that Coloradans are educated and informed on issues impacting their lives. CSI employs rigorous research techniques and dynamic modeling to evaluate the potential impact of these measures on the Colorado economy and individual opportunity.
Common Sense Institute was founded in 2010 originally as Common Sense Policy Roundtable. CSI’s founders were a concerned group of business and community leaders who observed that divisive partisanship was overwhelming policymaking and believed that sound economic analysis could help Coloradans make fact-based and common sense decisions.
Key Findings
- Proposition 118 would create a state-run paid leave insurance benefit program for Colorado. The program benefit includes a wage replacement up to 90% and covers 12 weeks of leave in most cases and up to 16 weeks of leave in others. The types of qualifying leave range from bonding with a newborn to personal injury as the program combines benefits often offered through the separate plans of paid family leave and short-term disability.
- While there are many benefits both to employees and to firms who currently offer these benefits, the direct costs of Proposition 118 have not yet been fully explored. The fiscal note accompanying the proposition includes a single estimate for the potential utilization level. While it acknowledges that utilization will likely increase over time, it offers no future year estimates, despite Proposition 118 proposing to create a program with higher benefit levels that existing programs in other states. And importantly, the legislation does not include provisions to reduce benefit levels in the event the cost continues to increase.
- To analyze a more robust range of direct and indirect costs associated with the potential implementation of Proposition 118, this paper describes the findings of a model constructed to reflect the likely costs and outcomes of Proposition 118. The findings indicate that it is very likely that the cost of the program will rise substantially higher than the initial premium rate of .9%, and could even be made to move higher than the current statutory cap of 1.2% to remain solvent, as the benefit levels of the proposed paid leave program under Proposition 118 are more generous than any other state with a history of established utilization data.
- Based upon expert recommendations provided to the 2019 FAMLI Colorado Task Force, a study from the University of Denver School of Social Work, and our own analysis of existing programs in other states, a broader range of potential program utilization levels are assumed. In year-5 when the program costs are most likely to stabilize, the following results summarize the range of costs.
- Solvency – If the program starts at a claims rate of 6.2% and an average length of leave of 9.5 weeks, the 2023 premium collections will not be sufficient to cover benefit and administrative costs in the first year of the program in 2024. In 2025, once the premium can increase to 1.2%, the program utilization can at most increase to a utilization level equivalent to a claims rate of 7.5% and an average length of leave of 10.2 weeks while maintaining solvency. Any higher and the program would face insolvency and likely require further legislative action.
- Direct Costs – The three constructed scenarios show a range of wage premiums to fund the benefit of .71%, 1.12% and 1.70%.
- This would amount to an annual premium of $178, $281 or $425, for an individual making $50,000.
- Given the current flat income tax of 4.63%, the wage premiums amount to between a 10% to 18% increase in income related taxes on those wages.
- The state government, a large employer required to participate in the program, would see the single year cost of between $39,000,000 and $94,000,000.
- In 2025, the total premiums to be paid by employers could total over $1.34 billion. This would be an effective increase of the corporate income tax of 204%.
- Indirect Costs – Given the one size-fits-all approach to the program, some businesses will face much higher net costs than others. A restaurant which must replace nearly 100% of the worker who take leave, would see their already low margin be reduced by 10%. On the other hand, a higher wage biotech research company, with a high margin, would see a decline in their margin of just 2% and a per employee net cost of $545.
Executive Summary
After several years of unsuccessful attempts at creating a state paid leave program through the state legislative process, Coloradans will be asked this very question on the ballot in November. If passed, Proposition 118, would establish a state-run paid leave insurance program, making Colorado one of the few states in the nation to have such a program.
Most Colorado employees would be eligible for this program, likely covering upwards of 85% of all jobs. The program would be funded by a payroll premium, equivalent in many ways to a tax, on all covered employees’ wages. Covered employees could take up to 12 weeks, or 16 weeks in some cases, for qualifying reasons including caring for a newborn or family member, or for personal medical issues.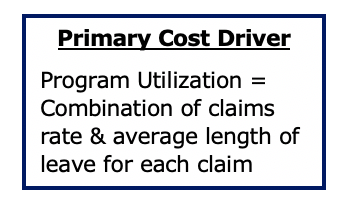
Our 2019 report, “Senate Bill 188: An Analysis of the Cost and Risk of Financial Insolvency for a Colorado Paid Leave Program” studied an early version of the 2019 paid leave bill, and found that the level of benefits of the program and the existence of a cap in the premium rate, without a mechanism to reduce benefits should the cap be hit, could face insolvency with fairly minor increases in program utilization. Proposition 118 differs from the 2019 Senate Bill, lowering the risk of insolvency by raising the cap to a 1.2% payroll premium, however the likely costs have not yet been fully explored.
Given the benefits to employees and employers, many Coloradans already have some form of paid time off. For decades employers have been offering employee compensation packages that cover a wide-range of benefits beyond just a wage salary. Aside from such incentives as the federal tax treatment of medical benefits, employers recognize that they often have a greater ability to cover insurance related expenses and experience a mutual benefit. However, that doesn’t then imply that all employers or employees would experience the same benefits or similar costs of a statewide program.
This report explores the range of potential, or likely, costs associated with funding the type of one-size-fits-all paid leave program outlined in Proposition 118. While there are undoubtedly benefits to both workers and employers in offering paid leave related benefits, it is critical that voters fully recognize the potential costs as the text of Proposition 118 does not include any provision to reduce benefit levels, say from 12 weeks to 10 week of leave, in the event the costs continue to climb. As those costs, both direct and indirect, are often likely the reason employers don’t currently offer this same level of benefit.
To estimate a wider range of both direct and indirect costs associated with the implementation and sustained operation of Proposition 118, a model of the programmatic details was constructed to be able to analyze alternatives given changes in some of the most critical cost drivers of the program. We refer to the model as the Colorado Paid Family Medical Leave Model, or COPFML model. Our findings indicate that it is very likely that the cost of the program will rise substantially higher than the initial premium rate of .9% and could even be made to move higher than the current statutory cap of 1.2% to remain solvent.
Based upon expert recommendations provided to and by the 2019 FAMLI Colorado Task Force and analysis of existing programs, a broader range of potential program utilization levels were assumed.
The range of key cost drivers are shown in the table below.
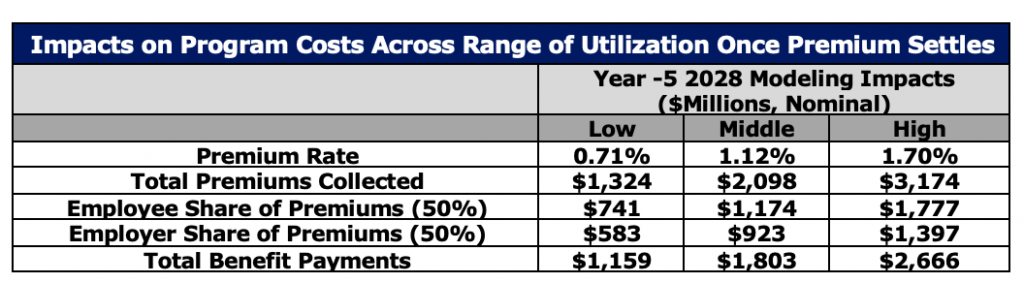
In year-5 2028 when the program is most likely to stabilize, the following results summarize the range of costs to both employees and employers. These results assume that the state legislature would have to pass new legislation to increase the premium cap in the event the utilization of the program pushes the costs higher than the currently proposed 1.2% premium cap can sustain.
While the direct costs of the program are ultimately born directly by both employees and employers, there may be further indirect impacts. Depending on the industry and firm dynamics many direct costs to employers are often passed on in the form of higher prices to consumers or lower wages to workers. Proposition 118 even concedes this point and suggest that employers can at maximum, pass on 50% of their employee share of the premium in the form of lower wages. This simply means that given the level of pressure an individual firm may face due to the higher costs, employees could pay up to 75% of the premium, rather than just 50%.
And while the additional .25% reduction in pay would be impactful for some, the direct cost of the premium would amount to an effective increase in personal income taxes of between 8% and 18% in just the middle scenario, given the current income tax rate of 4.63%.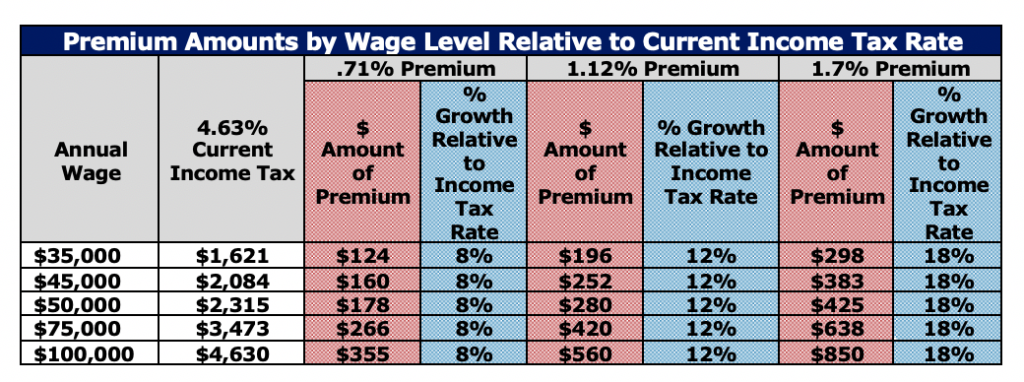
Overview of Proposition 118: Paid Family and Medical Leave Insurance Act
The full text of the measure can be found on the Secretary of State’s website, along with the accompanying fiscal note prepared by the Colorado Legislative Council Staff.
https://www.sos.state.co.us/pubs/elections/Initiatives/ballot/contacts/2020.html
This new benefit program would allow covered Colorado employees to take up to 12 weeks, or 16 weeks in some cases, of paid time off from work, for qualifying reasons, and to have a portion of their wages replaced based on a progressive wage replacement formula.
To fund the benefit payments and the administrative cost of the program, a payroll tax, defined in the text of the measure as a “Premium”, would be applied for all covered individuals. The types of events that would qualify for taking leave, cover the general categories of paid family leave and short-term disability.
Nearly all workers in Colorado, an estimated 85%, would be automatically covered and required to pay their share of the payroll premium. Local governments may opt out of the program, and yet their employees can opt back in under some conditions. Self-employed individuals must elect to pay into the fund for at least three years prior to being eligible to take paid leave. State government workers are automatically enrolled but federal government employees are exempt.
The wage premium is set according to a formula established in the statute. The wage premium starts at .9% of wages for the calendar years of 2023 and 2024, and then can adjust based on program demand thereafter in order to remain solvent up to 1.2%. The highest level of wages subject to the premium is equal to the same amount as used for social security contribution and benefit calculations. The total collections from the wage premium must be enough to cover 135% of current year benefits plus 100% of administrative costs.
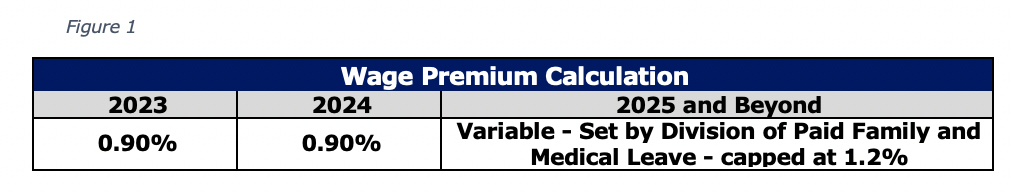
The statutory language sets a premium cap of 1.2%. This means that if the program benefit and administrative costs rise beyond a certain point, the Director of the Division of Paid Family and Medical Leave can’t raise the premium beyond 1.2%. As the program would face insolvency after going through any surplus, the Division could issue revenue bonds to cover expenses or the state legislature would need to lower the benefit levels.
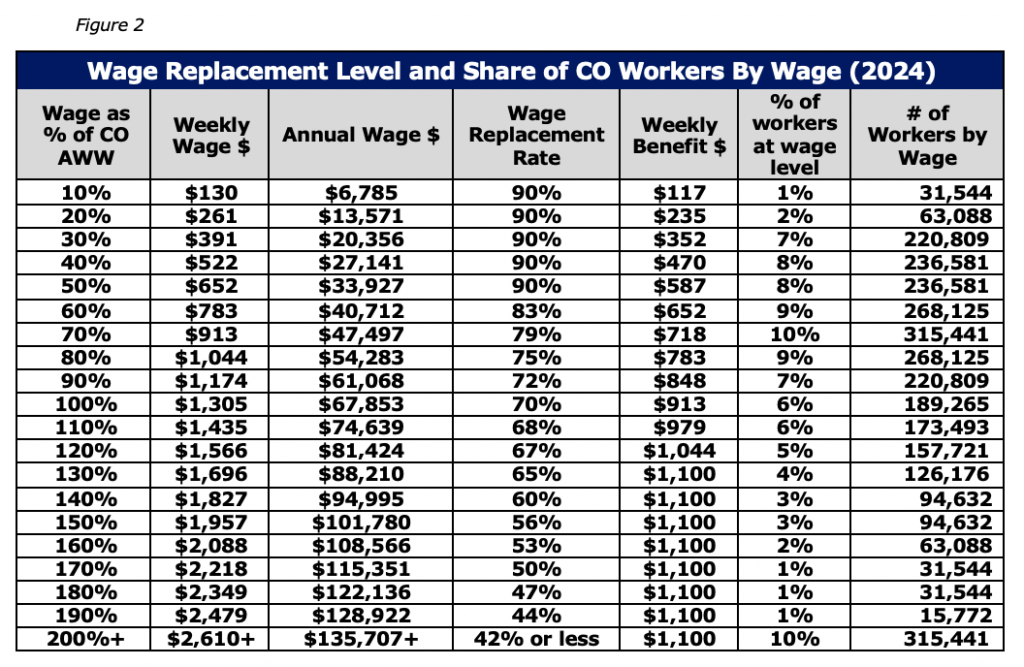
Each employee who elects to utilize the paid leave program will have their wages replaced based upon a progressive formula. Those that up to a maximum 90% of their weekly wage. The wage replacement formula is set to a progressive scale as lower wage workers receive a higher wage replacement rate. Those that make less than 50% of the average weekly wage (AWW) receive 90% of their wages replaced. Then workers above 50% of the AWW, have a wage replacement rate of 90% of income at or below 50% of the AWW and 50% of their wages above 50% of the AWW. The weekly benefit is capped at $1,100 per week at the start of the program. The table below shows the wage replacement rate based upon a range of wage levels.
Important Note on Interaction of Proposition 118 with Recently Passed Sick Leave Mandate and Other Existing Employer Benefits
In May of 2020, the Colorado State Legislature passed Senate Bill 20-205, which requires employers to cover 100% of their employee’s wages for up to 48 hours of sick leave within a 12-month period. The bill takes effect immediately but will apply to all employers starting in 2022. The direct cost to the employer of this mandate will depend largely on the extent to which they must pay another employee to cover the hours taken by the sick employee.
The text of Proposition 118 indicates that all other leave must be exhausted prior to be required to take a benefit through the new paid leave program. Unless under certain circumstances related to short-term disability insurance related leave, “Under no circumstances shall an employee be required to use or exhaust any accrued vacation leave, sick leave, or other paid time off prior to or while receiving family and medical leave insurance benefits.”
Given all Colorado employees will be eligible for two weeks of sick leave by the potential start of the paid leave program, several unintended consequences will likely arise given the interaction of the two laws.
- In situations where employees take fewer than 48 hours of sick leave, and no additional time off, both the employer and the employee will be paying into the paid leave fund and will not be able to draw from the benefits. This will add to the cost of employers especially if they have to pay 100% of employee’s wages during the 2-weeks of sick leave and then must also pay for the wages of another worker to cover.
- Given the two benefits do not need to be taken concurrently, employees will technically be eligible for up to 14 weeks of paid leave. This could have additional operational impacts when needing to replace workers on leave.
- As the combination of the sick leave mandate and the paid family program represent large expansions in paid leave related benefits, with a potential substantial increase in costs for some employers, it is also likely these two programs will put pressure on employers to reduce or eliminate existing benefits. While it may be that employers will eliminate equivalent benefits that would otherwise be duplicative, it may also be the case that the increase in costs forces reductions to additional benefits as well.
Comparison of Paid Leave Programs in Other States
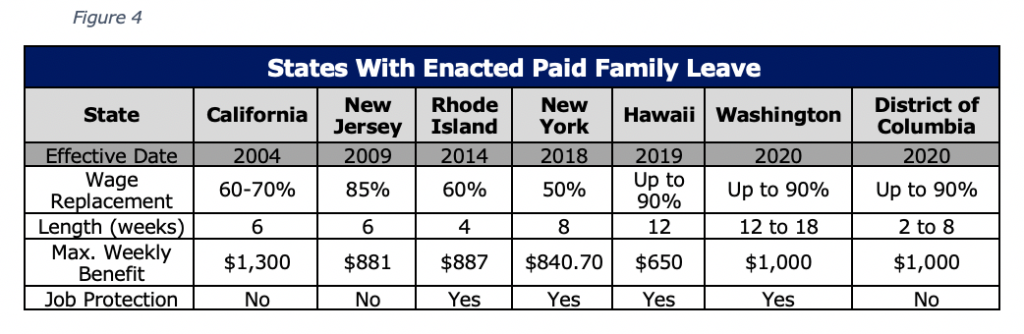
Several other states already have established paid leave benefit programs that can serve as useful points of comparison for understanding the potential impacts of Proposition 118 on Colorado. However, while these programs are comparable in some ways, the program proposed under Proposition 118 stands out as offering a greater level of benefits across several areas. This is a critically important observation, as this relatively higher level of benefits, makes it more likely that the program proposed by Proposition 118 would be more expensive that these longer-standing programs.
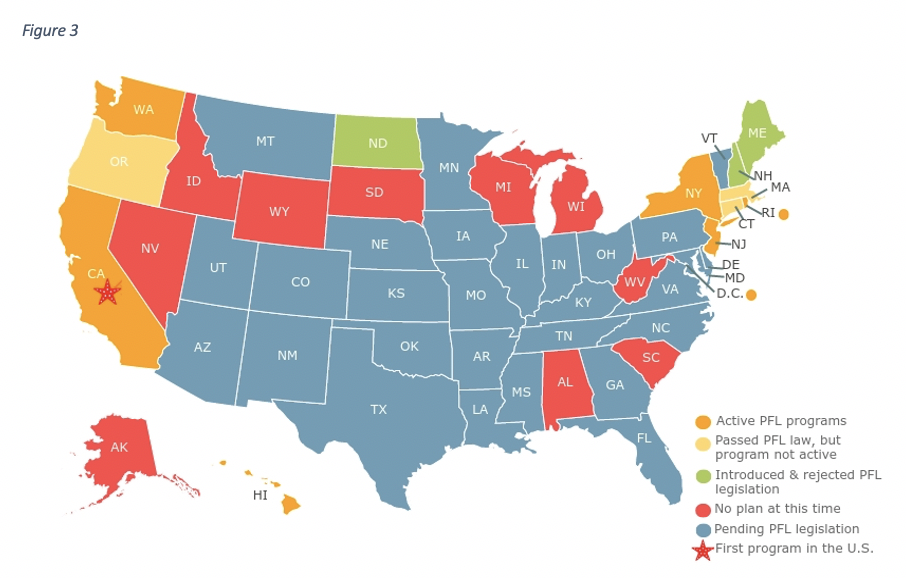
California was the first state to enact legislation in 2004, followed by New Jersey (2009), Rhode Island (2014) and New York (2018). These states also manage two separate paid leave benefit programs based on the two different types of claims; One related to temporary disability and personal sickness or injury, and a second related to caregiving claims either for childbirth or for supportive care of family members. Other states to recently pass legislation include Washington and the District of Columbia with benefits beginning in 2020. Massachusetts, Connecticut and Oregon also recently passed family leave benefits starting in 2021, 2022 and 2023, respectively. At least 16 other states have introduced similar legislation.
Given that the types of qualifying leave under Proposition 118 essentially combine these two types of paid leave programs under a single program, it is important to compare both programs from other states, to the proposed single program in CO. Since several of these states recently passed legislation that have not yet gone into effect or went into effect earlier this year, they do not yet have annual financial data available to evaluate their finance performance. Several of these states are similar in that they provide some form of partial wage replacement during paid family leave; however they differ in duration, funding mechanism, benefit amount, job protection, and what constitutes a qualifying event.[i]
Given no annual utilization data is available for newly established paid leave programs, the reference cases for program utilization come from the established programs of California, Rhode Island and New Jersey. In addition, researchers with the University of Denver’s School of Social Work, submitted several reports to the Colorado FAMLI 2019 Task Force, including one which provides a detailed comparison of program design across different states.[ii]
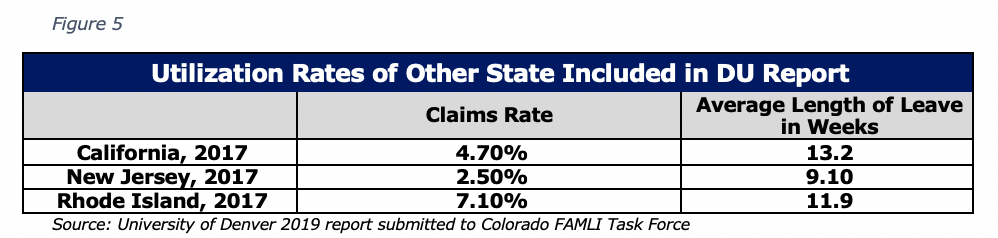
For the purpose of our financial analysis of the program, it is most important to understand the relative level of both coverage and benefit offerings, as this will have the most significant impact on the likely costs. The higher the level of benefits, the more people elect to use leave, and ultimately the annual costs to cover those benefits must increase. Therefore, while the comparison to other states is important, when trying to understand where Colorado’s likely utilization will rise to under Proposition 118, one must consider the relatively more generous benefit structure compared to these other states in 2017.
As an example, California increased their benefit structure slightly since 2017 and in 2019 experienced a claims rate of 5.4%, 15% higher than the 4.7% claims rate shown in the above table for 2017.[iii]
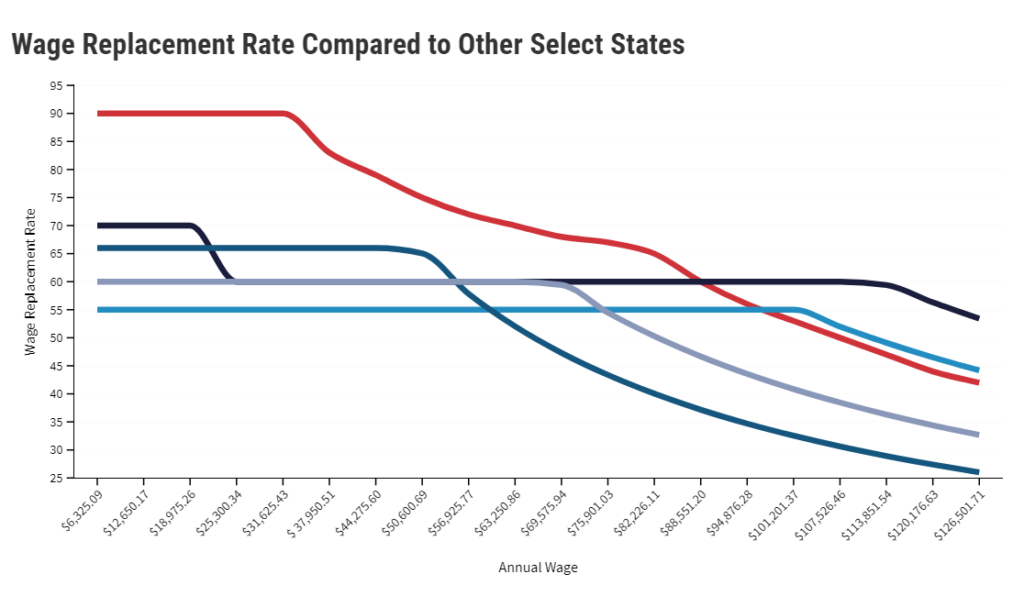
Wage Replacement Rate
In Figure 6 below, the wage replacement rate proposed under Proposition 118 would be substantially higher than the three reference states, starting at 90%. As a major determinant for taking leave is whether or not the individual can afford to forgo their normal wages, the higher the level of wage replacement, the higher the probability someone would be interested in taking leave.
Summary of Findings of a Colorado Paid Leave Model
Purpose
To understand the economic and fiscal ramifications of Proposition 118, CSI constructed a model to represent the different financial aspects of the program for the first 7-years of collecting premiums, 2023 through 2029. The model is based on a model developed by the Colorado Department of Labor and Employment in response to legislative policy debates in 2019, however it is updated to reflect the program details of Proposition 118 and to include the most recent economic data and demographic projections.
The model is constructed to estimate annual benefit payments, administrative costs, and required contribution amounts for both employers and employees based on several underlying factors.
Many factors are related to the specifics of Proposition 118, including the following;
- Maximum length of leave
- Wage replacement formula
- Cap in weekly benefits
- Maximum level of income used for contributions
Other model factors are related to economic and demographic projections of the state.
- Total universe of potential workers to be covered
- Growth in average weekly wage
- Share of employment across different classes of employers stipulated in Proposition 118 i.e. Self-employed, 2-9 employees, 10+ employees, state government employees, and local government employees.
A more complete description of the model and model parameters can be found in Appendix A.
Model Scenarios Range
Creating a model of the program is necessary to estimate anticipated costs, and to represent the likely outcome in the most informed way possible. However, the value of representative models is also in providing the ability to test alternatives and to be able to determine the elements of the program which may prove to be most impactful. A thorough sensitivity analysis and scenario testing of the model revealed that of the model inputs, the degree to which the program is utilized, including the combination of claims rate and average length of leave, ultimately impacts the degree to which the program is more or less affordable. And given the fact that the proposition language includes a premium cap of 1.2% of wages, the alternatives also show the degree to which the program can remain solvent or could require further legislative action.
The following table shows the range of utilization across currently established state paid leave programs, along with the range of utilization from expert analysis submitted by the University of Denver School of Social Work. For the purposes of the research, and as is often the convention used in other reports, utilization reflects the combined effects of the claims rate and the average length of leave. The claims rate reflects the total number of claims that receive payment, divided by the total number of people eligible to make claims. The average length of leave is shown in weeks and represents the total length of leave across all claims divided by the number of claims.
And administrative costs represent the costs to manage and administer claims as a percent of benefit payments.
Timing of Utilization
Most research on the utilization of paid leave suggests that the rate of utilization increases over time as covered workers gain more awareness of the program and become more likely to take the leave. The final actuarial report for the recommendations provided by the 2019 FAMLI Task Force, produced by AMI Risk Consultants, Inc.[iv], assumed an annual growth rate in utilization of 3.53%. This growth rate indicates that after 5 years the utilization rate will increase by 15% and 36% by year 10. Therefore, it is likely that the utilization of the program will be lower in the first year or two prior to escalating to a level where it will stabilize, which is described in other studies as well.
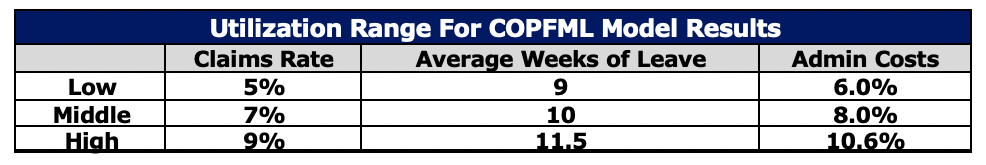
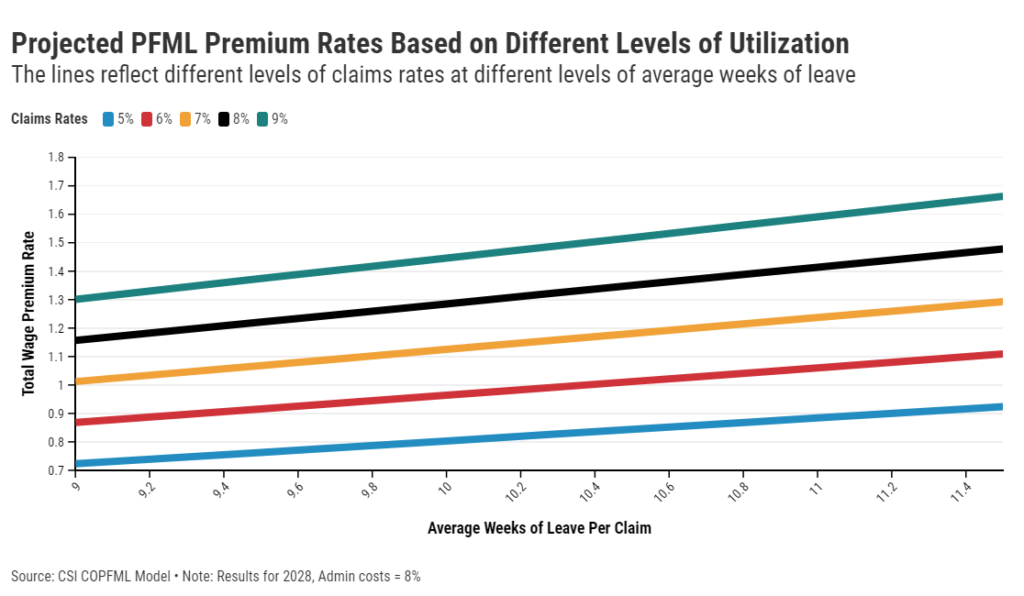
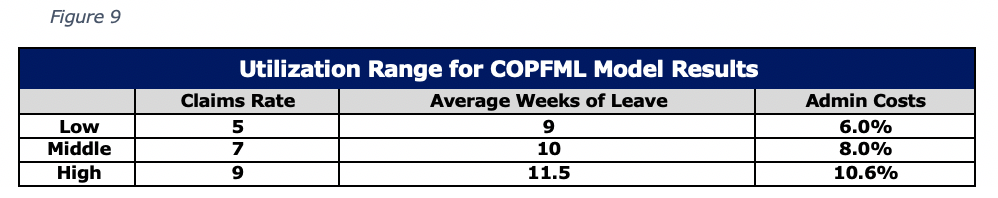
As such, the scenarios presented here do not intend to suggest that the utilization levels will remain flat from year-to-year. They are modeled as remaining constant for the years 2024 through 2029, both for the purpose of showing the level of the cost, and to show the different effects over time due to the interaction with the set rate in the first two years and a capped or un-capped rate in the later years. 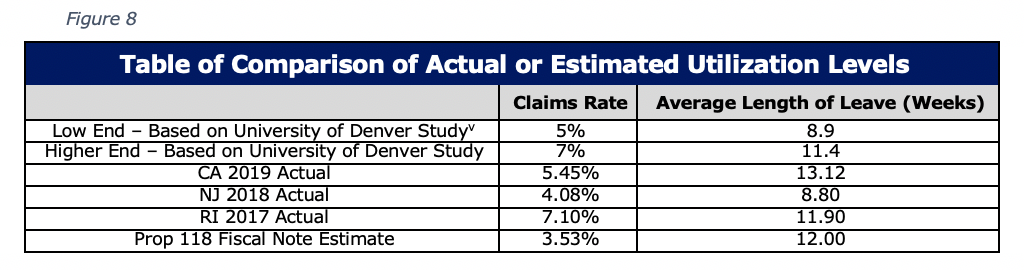 Based upon the observed and projected range, the following set of results show the estimated direct financial impacts of Proposition 118 using the COPFML Model. While the range of claims and average length of leave was demonstrated to be wider, the Figure 9 shows the range used to produce the results shown in Figures 10 – 16.
 Low
Low
Claims Rate – A 5% claims rate reflects the lower bound of the suggested range provided by researchers at the University of Denver in their report to the 2019 Colorado FAMLI Task Force.
Average Weeks of Leave – The same DU report showed that the simple average for the average weeks of leave across the three states of California, Rhode Island and New Jersey in 2017 was 8.9. This value was rounded to 9 as the lower range as no other state, except New Jersey, which has a much shorter length of leave, experienced an average length of leave this low.
Administrative Costs – While the DU study estimated administrative costs to be just 3% of benefits, this was much lower than several other reports provided to the 2019 FAMLI Task Force. While AMI estimated an expense ratio of 7%, Pinnacol estimated a 10% rate. 6% was assumed as a lower end estimate.
Middle
Claims rate – A 7% claims rate was assumed for the middle range, given this was the higher value in the University of Denver report submitted to 2019 task force. The low end assumed claims rate in the AMI FAMLI task force report was estimated to be 6.9%.
Average weeks of leave – An average of 10 weeks of leave was assumed as the middle value, as a point between the higher value of 11.5 and the lower value of 9.
Administrative costs – An administrative cost of 8% of benefits was used as a value between the high value of 10.6% and the low value of 6%.
High
Claims rate – Since the level of benefits proposed in Proposition 118 is greater than other existing programs with a history of claims, it is very likely the level of claims will be higher than in other states, particularly for paid leave claims related to caregiving. While it is possible that the claims rate could be higher, 9% was assumed for the higher range estimate.
Average weeks of leave – The weighted average across for the average weeks of leave across the three states of California, Rhode Island and New Jersey in 2017 was estimated to be 11.4 weeks. Given California and New Jersey have recently expanded their benefits, it likely those estimates will increase in future years. However, given the cap in the number of allowable weeks of leave of 12 under Proposition 118, 11.5 was assumed as an appropriate upper bound estimate.
Administrative costs – The upper bound of administrative cost was estimated at 10.6%, yet it is likely that the costs could escalate to this level and beyond. The 10.6% rate was assumed given this is the ratio of administrative expenses for Colorado’s Unemployment Insurance (UI) benefit program. Given this program is already managed under the Colorado Department of Labor and Employment (CDLE), the same department where paid leave will be managed, this appears a reasonable comparison. Costs were estimated based on the total appropriation to the UI program in the 2019 Long Bill, divided by the total benefit costs for 2019. It should be noted that, the administrative costs of the UI program jump to 14% in the current long bill, however given those are being influenced by COVID-19 related spending, it is too early to tell if those additional costs will be permanent.
The COPFML Model was constructed to be able to estimate results based on two potential outcomes.
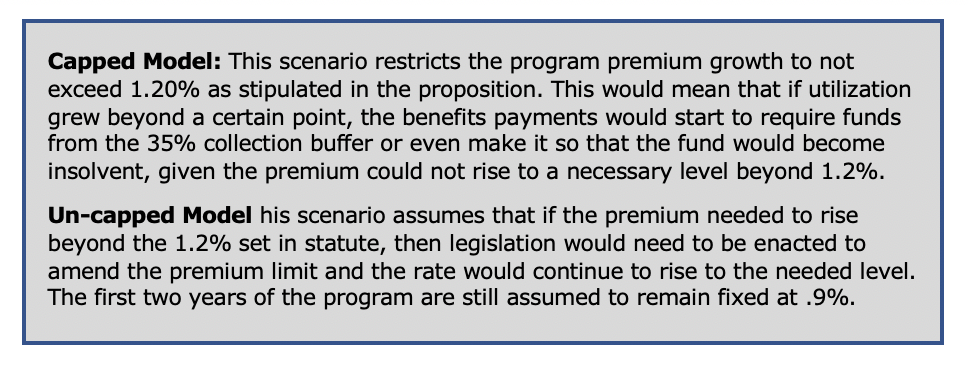
The “Capped” Model
To be able to gauge the solvency of the paid leave program as defined exactly in Proposition 118, it is necessary to assume that the premium rate cannot in-fact go above the statutory cap.
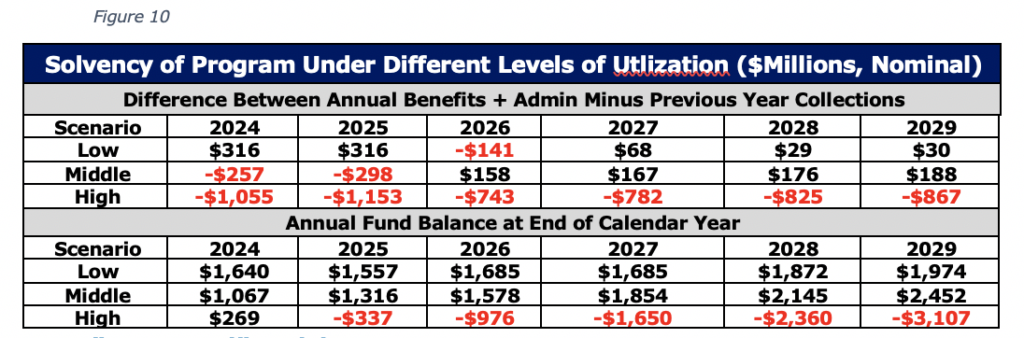
Figure 10 shows the results from the capped model, across two metrics;
- The difference between the benefits in the current year, and the contributions collected in the previous year.
- The projected surplus in the fund at the end of the year.
Given that the cost of current year benefits are expected to be covered by the premium collections in the year prior, the first metric in the table reflects when the fund may begin to see cash flow issues and face heightened solvency concerns. If the second metric goes negative, then that reflects more definitive evidence that the fund would run out of money to pay benefits.
While the model does not assume any of the following responses, if either of the solvency metrics go negative it would likely trigger one of the following 3 outcomes.
- It would push the fund to insolvency and claims would go unpaid.
- The fund could become insolvent and the Division of Paid Family and Medical Leave would issue revenue bonds to generate cash to cover claims in the short-run that would then need to be paid off through higher premiums in the long-run.
- The state legislature would intervene to change the law to reduce benefit levels, though this would not improve an immediate solvency crisis.
As shown in Figure 10, the level of benefit payments in 2024 would be larger than the 2023 collection for both the middle and high scenario given the starting contribution rate of .9%. The values drop in the out years as the model assumes that the model quickly increases the premium to the 1.2% cap, yet for the high scenario it is still not enough to cover the benefits. While the benefits may be slightly higher than the previous year collections, the model is not projected to see a year-end deficit until 2025 of the high scenario.
Given the high scenario shows a deficit over multiple years, it would not be feasible to fund the initial shortfall with a revenue bond. Rather, the premium cap would need to lifted, or benefits would need to be reduced.
“Un-capped” Model
The following results in Figures 11 through 16 show the model results for the un-capped model. The implication of this is that the program will not go insolvent, unless there is a major swing in utilization from year to year, as the premium rate would just increase to cover the increase in benefit payments.
For this framework the model results are characterized into three groupings given the different impacts observed across each one. Those three grouping are described in this report as;
- Year 1 and 2 – 2023 and 2024 – Fixed .9% premium
- Year 3 and 4 – 2025 and 2026 The first two years of a variable premium
- Years 5 through 7+ – 2027 through 2029 – Where the premium would stabilize
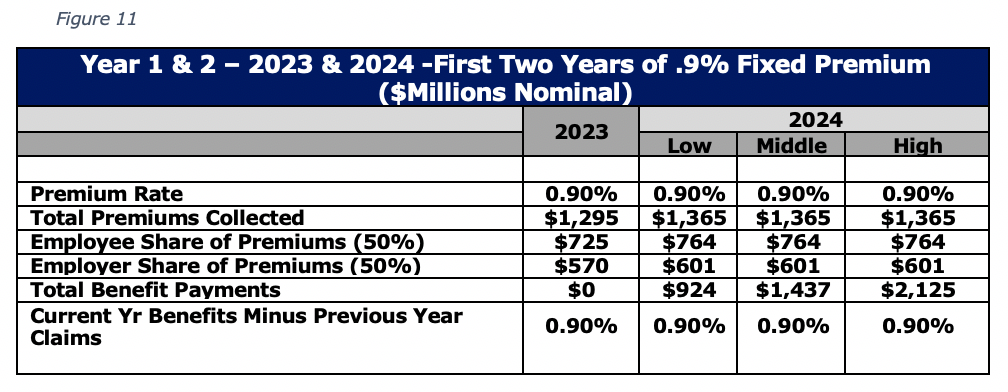
Year 1 and 2 – Fixed .9% premium
The first year that the PFML program would collect a payroll premium for all covered employees will be in calendar year 2023. 2024 is the second year of collecting premiums and the first year of paying benefits. It is likely that utilization will be lower in the first year and grow over time as more people become aware of it, which is what has been observed in other states. Given the fixed premium, and no prior years of claims experience to gauge the exact utilization, there still presents some risk that the program would become insolvent. However, that that risk is relatively low, given the fund will have one full year of collections, and then as benefits start to be paid, the fund will grow as collections increase. This could pose some risk for years 3 and 4, but that will be outlined in the next section.
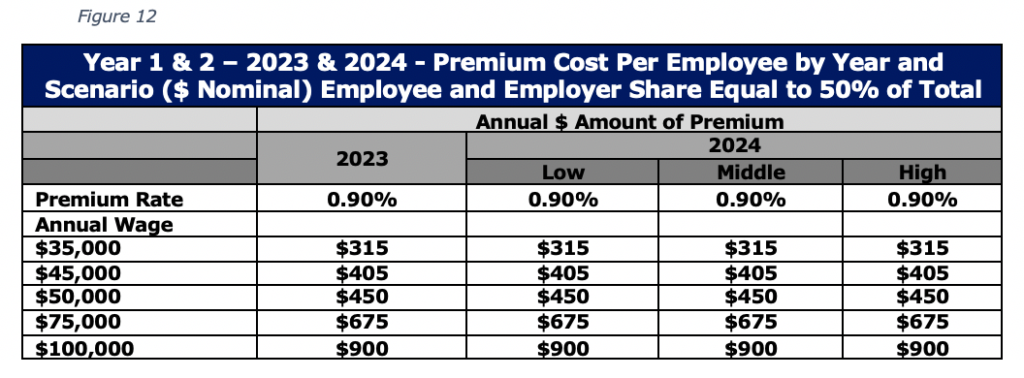
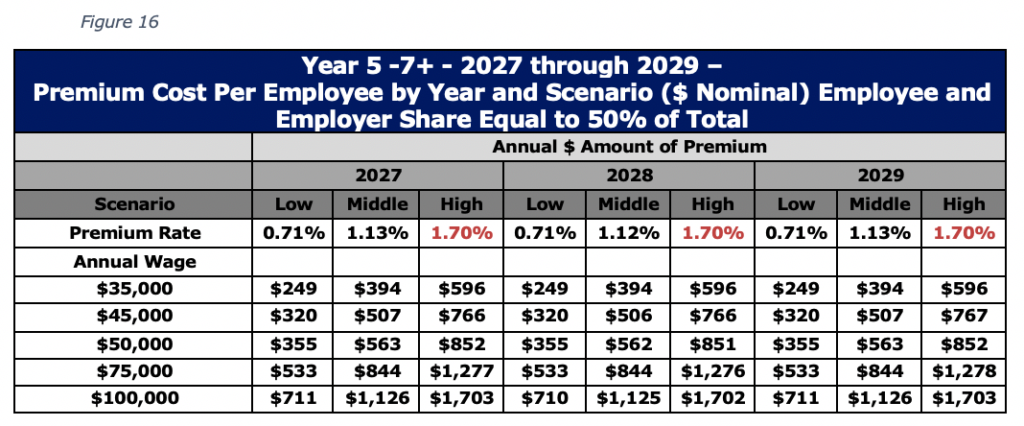
Based on the program results above, below are the costs per employee across a range of wages. These reflect the total costs and as the legislation is currently written, the employee and most employers would split the annual premium 50/50.
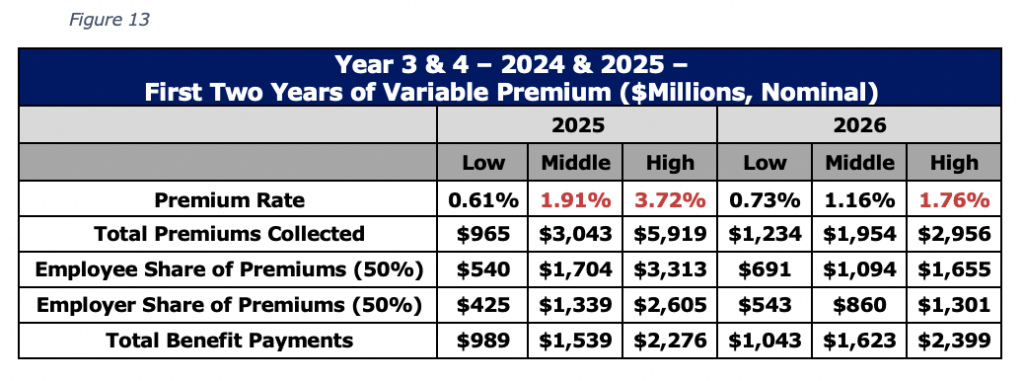
Years 3 and 4 – The first two years of a variable premium
Following the first year of benefit payments in 2024, the payroll premium contribution rate is set directly by the Department Administrator based upon a formula established in Proposition 118. The formula specifies that the premium rate that is to be used to will be set to a level that collects 135% of the current year benefits plus administrative costs minus “net assets.”
The model shows that depending on the level of utilization in the first year, and whether or not, the original .9% payroll premium is sufficiently high enough, year 3 and 4 have the most potential to see the largest swings. If .9% is too low, then in year 3, the premium must overcompensate, and rise much more quickly to replenish the surplus and have funds available for year 4.
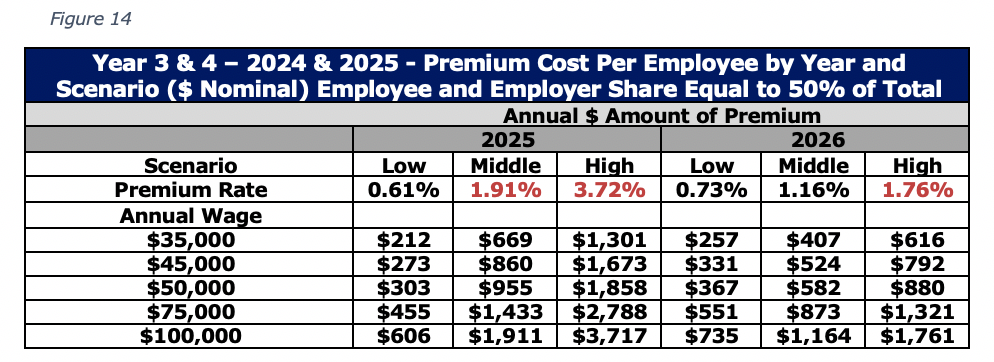
Based on the program results above, Figure 14 shows the costs per employee across a range of wages for years 3 and 4.
Years 5 through 7+ – Stabilized Premium
By year 5, or 2027, the annual volatility in the premium rate will be more stable. Therefore, these years reflect what may be closer to the true premium rate required to fund the level benefits at the time, as the rate no longer needs to fluctuate to account for the fixed rate in the first two years.
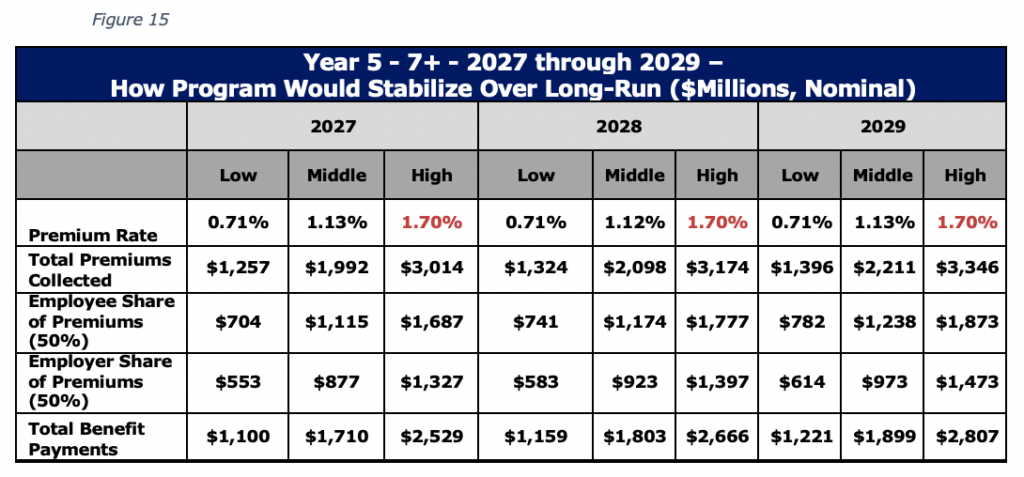
Based on the program results above, Figure 16 shows the cost per employee across a range of wages for years 5 through 7.
Costs to the State of Colorado
The fiscal note accompanying Proposition 118 includes an expenditure estimate across three years, FY2022 through FY2024 which encompasses several facets of the program.
- Administrative costs
- Benefit payments
- State government employer costs
The program administrative costs will be covered by the premium collections which are set to start in 2023. However, those contributions won’t begin to accrue until that year and can’t be used to fund 2023 related expenses. There are also anticipated expenses in 2021 and 2022 that will likely need to be covered by revenue bonds issued by the new government enterprise.
The program benefit payments similarly are expected to be covered by the annual contributions.
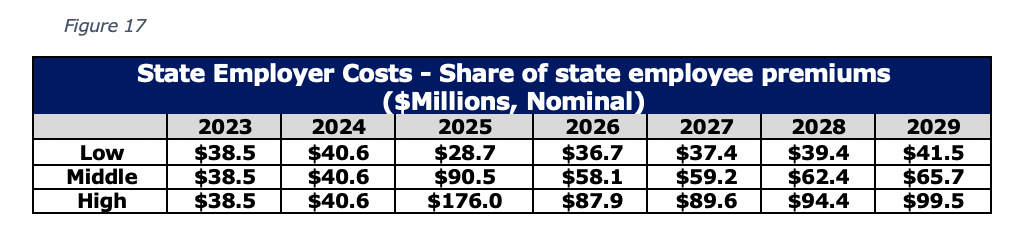
The final cost to the state is related to its role as an employer. Similar to private sector employers, the state will be responsible for covering the wage premium for their eligible state workers. Figure 17 shows the estimated increases in state expenses across the three modeling scenarios described in the earlier sections of the paper.
 Observations on Indirect Economic Impacts Related to a One-Size-Fits-All Paid Leave Program
One of the concerns among opponents of paid family leave is the costs imposed on businesses and employers. Employers could face indirect costs from the need to hire replacement workers, reassign work tasks or coordinate employee schedules. Employers could also experience cost savings if workers who would have otherwise quit instead return to their jobs and reduce turnover rates.[vi]
Benefits
Proponents of paid family leave have cited numerous benefits including ensuring the economic security of workers, their families, and their employers through improved labor market attachment and higher wages; increased long-term labor force participation for caregivers; improved job retention for both low- and high-paid workers, higher employee morale, and reduced employee stress; and decreased need for public assistance programs. Several studies have cited that offering paid family leave improves business productivity by boosting employee morale and making it easier for businesses to retain skilled workers.[vii]
Progressive wage replacement schemes (wherein lower-paid workers have a higher replacement rate than higher-paid workers) and wage replacement caps are tools that can help ensure that low-paid workers receive sufficient wage replacement while containing program costs. Higher-paid workers are also more likely to have savings to help finance periods of leave compared to lower-paid workers. Sufficient wage replacement can improve take-up rates—especially for low-paid workers.
Disproportionate Impacts
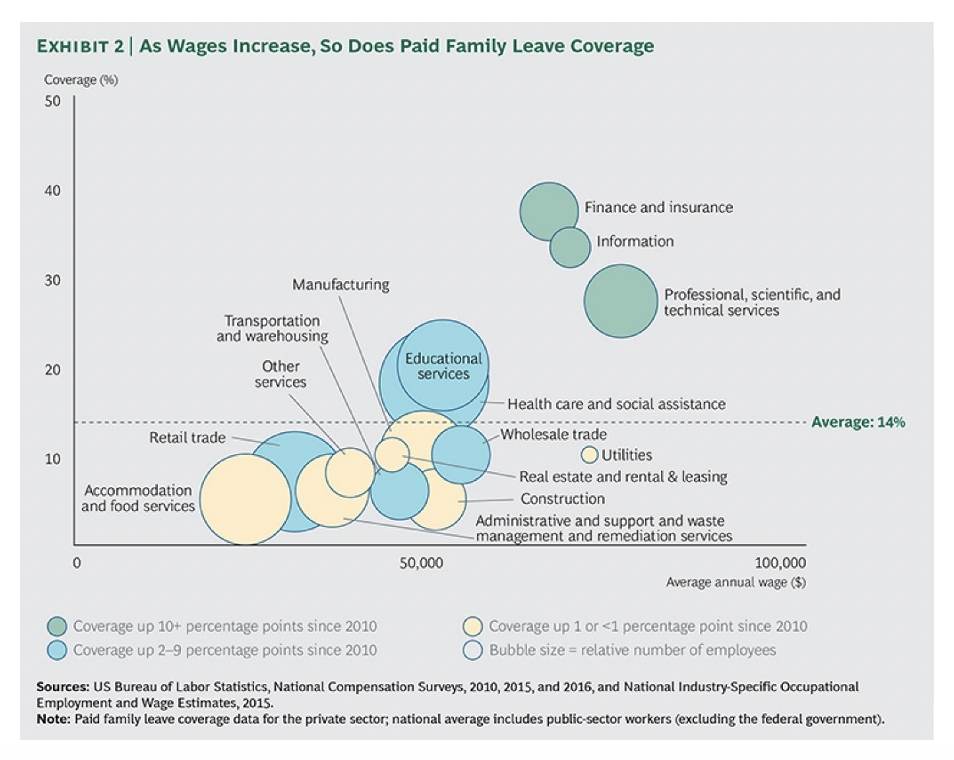
Access to paid family leave also varies considerably by industry and by size and type of the employer. According to the National Compensation Survey, access to paid family leave is most prevalent among professional and technical occupations and industries, high-paying occupations, full-time workers, and workers in large companies. More than 40% of workers in the information supersector have access to the benefit, followed by finance and insurance (38%), and professional and technical services (32%). By contrast, workers in the leisure and hospitality and construction supersectors have among the lowest rates of access to paid family leave among the supersectors, 8% and 6%, respectively.[viii] Therefore, costs are greater for those companies where labor costs are more and most likely face larger consequences.
Several indirect costs from a one-size-fits-all paid leave program to employers include:
- Firms face higher costs if they want to cover 100% of employees’ wages
- While workers at the lower wage scales will have 90% or near 90% of their wages replaced, roughly 18% of workers would have 60% of less of their wages replaced. While employers will save the money that is paid to their employees through the state paid leave benefit while on leave, they may still prefer to cover a higher share of their employees’ wages. The net costs will depend on several factors, but in some cases, firms will face increased net costs from if they just 100% self -funded the benefit. This may be justification for an employer to opt-out of the program. Given this dynamic would likely occur from higher wage firms, it would put more pressure on the premium rate to increase given a larger share of lower wage jobs, which receive a larger wage replacement, would remain in the program.
- Firms face higher costs if they need to replace hours of employees on leave.
- The largest indirect cost for many firms could be the extent to which they need to replace the worker who is on leave. This could take the form of more overtime for current workers or as the temporary replacement of the worker on leave. While paid leave programs may prevent some level of lower turnover overall, the costs associated with hiring and training a temporary worker, along with their direct pay present higher burdens for some industries such as restaurants, while presenting less of a burden for other such as professional services.
- Pressure faced by many companies will mean that employees will likely pay a higher share of premium through reduced wages
- A concern among businesses are their ability to remain profitable while replacing employee wages. Opponents of paid family leave argue that costs could be high for businesses operating on thin profit margins. Firms that have thin profit margins and higher labor costs will most likely experience a larger impact on their bottom lines than firms that have wider profit margins.
- The one-size-fits-all policy could disproportionally impact small businesses since they have smaller profit margins compared with large firms. Some could lay off employees or cut hours, wages or other benefits. Some firms may be forced to close entirely, unable to afford the expenses that accompany government mandates.
These indirect costs will play out different for every company in Colorado. Some will see their costs actually go down, as employees take on a large direct role in funding the benefit. Others will see their costs go up, as the nature of their business require that 100% of the time employees are on leave be replaced by another worker.
The 2019 corporate income tax net collections on businesses was $655 million.[ix] In 2025, the total premiums to be paid by employers could total over $1.34 billion. This would be an effective increase of the corporate income tax of 204%.
Creating broad outlines for different types of firms, the differing impacts between a hypothetical restaurant compared to a hypothetical biotech firm can be better understood.
For a restaurant paying the average industry wage across 30 employees, with a margin of 3%, that must replace 100% of the workers who take time off, would see a net cost increase of $4,771 or $159 per employee. That would represent a 10% decrease in their already low margin.
On the other hand, a higher wage biotech company with 200 employees and only needing to replace 50% of their employees that take leave, they would see a $148,970 direct cost reducing their 15% margin by 2.4%.
While these two examples do not represent any specific company, they provide some valuable insights into how a single one-size-fits all program will have different impacts across companies throughout the state.
Self Employed & Contractors
Many self-employed workers and independent contractors are excluded from paid family leave programs. These exclusions can impact restaurants, construction, transportation drivers, etc. who are often misclassified as contractors. Workers in many of these industries face added barriers to access paid family leave. Recently, Colorado’s gig workers and contractors can now apply for UI benefits due to COVID-19.
Self-employed workers, independent contractors, and consultants typically have to make both employer and employee contributions to access benefits. This contribution requirement could be cost-prohibitive for these workers if they are required to pay more than traditional employees to access paid leave. However, some states such as Washington have devised contribution plans that allow self-employed workers and independent contractors to pay the full cost (employer-employee) for certain provisions like paid family leave but only pay the employee portion for other benefits like medical leave. These provisions can serve to reduce contribution costs for independent contractors and self-employed workers. A mandated and state-funded benefit could cause employers to hire more workers who are not typically eligible for the benefits including part-time or contract workers.
Conclusion
Paid leave benefits provide a critical compensation element for many employers and employees across Colorado. While Proposition 118 proposes to create a statewide paid family and medical leave program, that could be accessed by most employees across the state, voters should be aware of the program’s potential costs.
The modeling results show that for $50,000 in wages, workers could pay $178 to $425 in direct premiums, representing an 8% to 18% increase in state personal income related taxes on those wages.
On top of the direct costs, employees could pay up to 50% of their employers share of the premium in the form of a wage cut. Depending on each firm’s specific circumstance, the pressure to cut costs elsewhere, or reduce wages could be felt not just by the direct cost of the program, but also by the indirect costs.
Ultimately, Coloradans have a choice if establishing this new universal benefit is worth the cost.
Appendix A – Model of Proposed Paid Family and Medical Leave Insurance Program
The COPFML model used the estimate the results shown in this report was constructed to reflect the details of the policy prescribed in the statutory changes written in Proposition 118. The model framework is largely based on a model developed by the Colorado Department of Labor and Employment (CDLE) and shared during the 2019 legislative session during the debate surrounding the 2019 FAMLI Family Medical Leave Insurance Program (SB19-188). However, while the framework is similar, the model has been updated with more recent data, and included many changes to reflect the difference in Proposition 118. CDLE staff had no involvement in the process of updating and calibrating the model assumptions, variables or linkages described below.
Baselines and Input Data
To develop the figures for future years’ premium rates and collections, benefit payments, and year-end fund balances, our first step was to gather inputs and estimate variables relevant to the structure of the proposed program as it’s outlined in the measure’s legal text. These inputs and estimations are as follows:
Social Security Cap
Per the final draft of Proposition 118, employee premiums can only be collected on wages earned at and below the Social Security cap. Annual reports by the Board of Trustees of the Federal Old-age and Survivors Insurance and Federal Disability Insurance Trust Funds project Social Security cap levels in current and future years; the values we use in the model come directly from the most recent of these reports (2020).
Premium Rates for Years 1 and 2
The total wage premium rate for 2023 and 2024 is fixed at .9% of wages earned below the Social Security cap. The employer share and the employee share of the total premium are exactly half in all program years.
Weekly Wages
Since benefit payments vary by the wage levels of their recipients, the model’s results depend upon Colorado’s average weekly wage. The FY2020 average weekly wage, as reported by the director of the Colorado Division of Workers’ Compensation is $1,123.71; to project the levels in future years, we grew this baseline value at yearly rates matching those we developed which reflect Social Security cap growth (delineated above).
Wage Distribution
The CDLE, in its projections which inspired CSI’s model, reported a contemporary estimate of the share of workers earning different portions of Colorado’s annual weekly wage from the Colorado LMI Gateway. We retained the CDLE’s wage distribution numbers and did not alter them for any of the model’s years.
Employment
Proposition 118’s premiums are assessed to employers differently based upon their employee counts and sectors of operation. To capture the extent of the variability, the model required estimates of the numbers of workers at firms with 10 employees or more, workers at firms with between two and nine employees, state government employees, local government employees, and self-employed[x] people in each year it examines. These were developed by comparing under-inclusive (absent sole proprietorships) 2019 industry and size-class data from the U.S. Bureau of Labor Statistics against over-inclusive (inclusive of part-time and dual employment) similar 2019 data from the U.S. Bureau of Economic Analysis as reported by the Colorado Demographer’s Office. The shares of total employment estimated for each firm category were held constant across the length of the projection, and the raw values were adjusted year-to-year by the Colorado Demographer’s Office’s projected rates of state employment growth.
Model Process
The model calculates each future years’ premium rate, by first quantifying the estimated benefit payments that would be required in the following year. To achieve this, the model calculates the following processes:
Calculation of Total Premiums Collected
The two broad components of total premium collection are the employee share, which all eligible employees pay, and the employer share for eligible firms with 10 or more employees and state government. Employers who employ fewer than 10 workers and those self-employed do not pay employer premiums.
The number of eligible employees is the sum of all employment estimates after adjustment by the assumed opt-out rates for local governments, the self-employed and standard employers with their own qualifying family leave schemes. These two totals are dispersed according to the model’s wage distribution numbers among levels of Colorado’s average weekly wage between 0% and 230%+ separated by 10% intervals (230%+ is represented by a proxy value of 300%). Actual weekly wage numbers are then reported on each of these strata, maximized at the Social Security cap, and multiplied by 52 and the employee shares of each year’s premium rate, then again by the numbers of employees at each wage level, to produce sum totals of premiums charged to employees.
The total employer contribution to each year’s total premium collections is calculated in the same manner save that its primary input is instead the number of employees working at firms with 10 or more employees without their own qualifying plans plus the number of employees working in state government. This total is finally added to the total employee contribution, and the model reports the resulting sum as the total value of annual premiums collected.
Calculation of Total Benefits Paid
The total yearly benefit payment is calculated by distributing the total number of eligible employees by wage as in the premiums calculations, multiplying their weekly wages by the average number of weeks of leave taken, the corresponding wage replacement rates (informed by the Proposition text’s regulations about wage replacement rates compared to average weekly wage and the weekly benefit cap, which adjusts each year after 2024 to 90% of the average weekly wage), the assumed claims rate, then by summing those totals for each wage level. The model reports this sum as the total value of annual benefits paid by the insurance fund.
Calculation of Fund Net Assets
“Net assets,” appears in the text of Proposition 118 as the part of the equation for determining the premium rate. In the model, it is estimated to be the fund’s year-end balance minus its projected next-year liabilities/benefit payments. The fund balance after each year is its previous-year balance plus total current-year premiums collected less current-year benefits paid less current-year administrative costs. The program’s projected liabilities total is 1.35 times current-year benefits paid plus current-year administrative costs.
Calculation of Subsequent-year Premium Rates
The total premium rate in each year after 2024 is set at such a value that it will cause the state to collect exactly 135% of previous-year total premiums plus previous-year administrative costs less previous-year net assets, as prescribed in the text of Proposition 118. The premium rates are calculated by dividing each year’s required total premiums figure by the corresponding value of total wages earned, then multiplying the result by a multiplier which reflects the condition that some wages are subject only to half of each year’s total premium rate. Each year’s total wages estimate is developed by multiplying weekly wages at each income level by 52 and the number of interested employees at each income level, then summing the resulting values. The results are premium rates which collect the exact required values in the un-capped model, and which cannot exceed 1.2% in the capped model.
Assumptions
Share of Employers Operating Approved Plans
The model assumes that 10% of private-sector employees will be covered by approved employer leave plans. This value was informed by a 2017 Pew Research Center survey which concluded that about 14% of civilian workers in the United States have access to paid family leave and does not change between years. According to the U.S. Bureau of Labor Statistics National Compensation Survey, 18% of private industry workers have access to paid family leave. Our assumption is somewhat lower to reflect the high standards which Proposition 118 sets for private plans and the lack of clear data on not just existing access to benefits, but on exactly what the levels of those benefits are.
Local Government Opt-out Rate
The model assumes that 50% of local government employees will not be counted eligible for Proposition 118’s paid leave program due to local government opt-outs permitted by the letter of the proposition. This number comes from the CDLE 2019 model (the 2019 FAMLI Family Medical Leave Insurance Program bill included similar opt-out language concerning local governments).
Self-employed Opt-out Rate
Following the example of the local government opt-out figure, we assume in the model that half of Colorado’s self-employed people will choose not to participate in the program.
Claims Rates and Average Lengths of Leave
The various claims rates and average weeks of leave estimates in our scenarios are informed by studies and actuarial analyses of the 2019 FAMLI Family Medical Leave Insurance Program and from paid leave program experiences in California, New Jersey and Rhode Island. We used several different claims rates and weeks of leave averages in our scenarios to reflect the ranges of estimates others have supposed and the differences between Proposition 118’s program and those in other states.
Administrative Costs
The program’s administrative costs are set by the assumptions in each scenario for the years 2024 – 2029. The administrative costs for 2023 are set at $40,000,000. A 2016 memo on the fiscal impact of establishing a paid family and medical leave program in Washington D.C. estimated the IT startup costs to be $40,000,000.[xi] The 2019 Washington State Comprehensive Annual Financial Report from the state’s Office of Financial Management, indicated that the administrative expense related to Paid Family and Medical Leave was $19M in FY 2019, the year prior to collecting contributions.[xii]
As an aside, if the 2023 costs were $60M instead of $40M, for the middle scenario, it would add an additional .01% to the 2025 premium.
Administrative costs for the years 2024 through 2029 are set as a percent of the annual benefit payments. This is a convention often used in describing the administrative costs of state benefit programs as it partially reflects the costs of scaling the state’s administrative tasks with the level of claims volume. The description of the range for administrative costs for 2024 through 2029 are provided in the scenario results section of the report.
[i] https://equitablegrowth.org/the-economic-imperative-of-enacting-paid-family-leave-across-the-united-states/#footnote-5
[ii] https://sites.google.com/state.co.us/famli/expert-reports-analysis?authuser=0
[iii] https://www.edd.ca.gov/about_edd/Quick_Statistics.htm
[iv] https://drive.google.com/file/d/1xjuRW3p6Iq0oaCP2j15lFEAMX7F9kA9F/view
[v] https://drive.google.com/file/d/1nHrayv2WBJqJxauaoWMUnhL-iKJgz5r8/view
[vi] https://equitablegrowth.org/the-economic-imperative-of-enacting-paid-family-leave-across-the-united-states/#footnote-5
[vii] https://www.jec.senate.gov/public/_cache/files/646d2340-dcd4-4614-ada9-be5b1c3f445c/jec-fact-sheet—economic-benefits-of-paid-leave.pdf
[viii] https://www.bls.gov/ncs/ebs/benefits/2018/ownership/private/table32a.htm
[ix] https://www.colorado.gov/pacific/revenue/annual-report
[x] https://www.bls.gov/spotlight/2016/self-employment-in-the-united-states/pdf/self-employment-in-the-united-states.pdf
[xi] 2016 Memorandum from Jeffrey S. DeWitt, CFO, Subject: Fiscal Impact Statement – “Universal Paid Leave Amendment Act of 2016”
[xii] https://www.ofm.wa.gov/sites/default/files/public/accounting/report/CAFR/2019/13stats.pdf