

Authors: Ben Stein and Henry Sobanet
ABOUT THE AUTHORS
Terry J. Stevinson Fellows
Ben Stein
Spending a better part of a decade serving as Budget Director and Chief Financial Officer for the Colorado Department of Transportation, Ben’s career in finance stretches over 16 years. In 2014, Ben retired from Colorado Department of Transportation (CDOT) and became the Chief of Staff to U.S. Representative Mike Coffman until 2019. Currently, Ben continues to work in the transportation field as a consultant.
Henry Sobanet
Henry’s career in economics, budgeting, and finance has spanned over 25 years. He spent five years as an economist at the Colorado Legislative Council and served as the Director of the Governor’s Office of State Planning and Budgeting under Governors Bill Owens and John Hickenlooper. Henry has also served on the Colorado Transportation Commission. Currently, Henry serves as the CFO of the Colorado State University System.
ABOUT COMMON SENSE INSTITUTE
Common Sense Institute is a non-partisan research organization dedicated to the protection and promotion of Colorado’s economy. CSI is at the forefront of important discussions concerning the future of free enterprise in Colorado and aims to have an impact on the issues that matter most to Coloradans.
CSI’s mission is to examine the fiscal impacts of policies, initiatives, and proposed laws so that Coloradans are educated and informed on issues impacting their lives. CSI employs rigorous research techniques and dynamic modeling to evaluate the potential impact of these measures on the Colorado economy and individual opportunity.
Common Sense Institute was founded in 2010 originally as Common Sense Policy Roundtable. CSI’s founders were a concerned group of business and community leaders who observed that divisive partisanship was overwhelming policymaking and believed that sound economic analysis could help Coloradans make fact-based and common sense decisions.
Executive Summary
Colorado’s surface transportation infrastructure (highways, roads, bridges, transit, and heavy and light rail) and their underlying systems of finance are in need of attention and reform. The focus of this paper is on state highways, roads and bridges. A combination of factors ranging from strong employment growth, to the declining purchasing power of the primary revenue stream, the per-gallon motor fuel tax, increasing construction costs, better fuel efficiency, and the harsh Colorado climate, culminate in a slowly developing crisis. Though Colorado’s economic performance for the last several years has outperformed most other states’, its transportation system is barely keeping up, and the limited prospects for expansion of the system will likely place the state at a disadvantage going forward unless addressed.
From 2010 to 2020, 31 states reformed or augmented their transportation financial resources. Colorado’s primary source of transportation revenue, the per-gallon tax on motor fuels, has not seen a rate change since 1991. The resulting loss of purchasing power from higher fuel efficiency and construction inflation has been only slightly offset by inconsistent state General Fund dollars (income and sales taxes) and higher registration fees. The chart below illustrates the last 15 years of this eroding purchasing power.
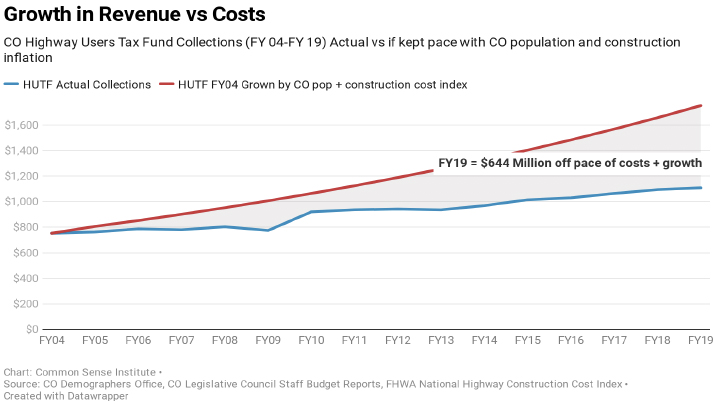
Chart Source: CO Demographers Office, CO Legislative Council Staff Reports, USDOT FHWA National Highway Construction Cost Indexi
For its surface transportation infrastructure for cars, trucks and busses, Colorado faces a significant maintenance backlog and even keeping the system at current condition levels will require new revenue equal to $300 million annually to address deficiencies on the state- maintained portions of the system. This is roughly half of the Colorado Department of Transportation’s (CDOT) current revenue from its primary state sources.
Colorado also faces a capacity backlog. Although before the current economic recession, CDOT estimated a $9 billion shortfall in transportation projects. There is no realistic chance of more that 25% of them being completed in the next 10 years with the current funding structure. What is possible, however, is to identify and address the most critical 25-30% of that list and prioritize those projects. CDOT has recently compiled a $3.2 billion list of projects all of which could be completed by 2030…if only the money were actually available.
To change the trajectory of our transportation system’s future, Colorado needs an infusion of sustainable, earmarked dollars for both system maintenance and infrastructure improvements. Expecting large infusions from the federal government to address this backlog is wishful at best and looking for more dollars in the state’s General Fund above those expected to fund existing and growing Certificate of Participation transportation financing is even less likely.
New technologies, ranging from smarter roads to smarter and more efficient cars, have great potential to move people, goods, and services more safely and efficiently than the status quo. However, Colorado’s system for transportation finance is not ready for the transition to a new transportation model. We need to start planning now, to deal with disruptive innovations like ridesharing, which appears to have affected demand for transit prior to the recent drops due to the pandemic. Further still, the extent to which commuting patterns are permanently altered is still not certain. New traffic patterns may affect the prioritization of capacity expansion.
The recent economic shock is so severe, and with the timing and strength of the recovery are yet uncertain, we recommend a plan that involves three general phases.
Phase 1: Stabilization
Assess the permanency of the economic recession on transportation revenue sources. As the current recession will affect both travel demand and revenue sources, a recalibration of the forecasts of revenue and needs is necessary.
Phase 2: Rehabilitation
The top priority following the first phase should be to maintain the system we have. Right now, current estimates are that the state highway, road, and bridge budget annual shortfall on just maintenance projects is $300 million annually.
Phase 3: Transformation
Most of the state’s surface transportation system has aged beyond its designed capacity and therefore long-delayed expansions would provide meaningful benefits. CDOT’s new 10-year project priority list totals $3.2 billion yet is unfunded under current law. Also following the first phase, and possibly even simultaneous with the second phase, a new source of funding should be agreed upon to increase the capacity of the system.
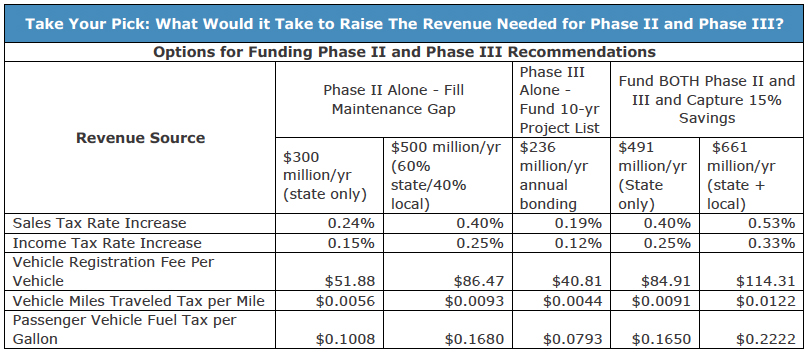
A summary of the possible ways to achieve Phases 2 and 3 is captured in the table below.
A Comment Before We Begin
The Common Sense Institute, formerly the Common Sense Policy Roundtable, engaged us for this paper in late 2019. Shortly after our work began, the COVID-19 crisis hit. While much of this paper, and the thinking that preceded its writing, was completed prior to March 2020, we have included relevant context that outlines the basic new challenges that COVID-19 appears to cause on the economy broadly and on transportation specifically. For the moment, we believe this paper at least captures the nature of the things that are most uncertain, yet could have a large impact on this policy area.
We recognize the difficulty in considering the long-term needs of a single policy area while in a recession. Those things that were problems prior to the pandemic will remain problems, but perhaps their contexts will have changed. So while the impacts of COVID-19 and the response to contain it are currently ongoing, we believe we have established that the transportation issues that preceded the pandemic remain important to address, given it remains more likely than not that transportation investments will serve the future economic needs of our state but also contribute to its near-term recovery.
Though transportation demand is currently lower, we must remember that the scale of the problem we are facing in Colorado—a $9 billion shortfall to meet our transportation goals over 15 years — is massive. It is unlikely that Colorado’s population growth trajectory will change, so the significance of the transportation shortfall remains high.
However, the timing of a return to pre-pandemic economic activity is uncertain and the impact on households and business is still being assessed. Thus, we have tailored our recommendations to account for the urgency of attention to other matters in this situation.
This paper’s goals are:
- to review the current state of our surface transportation system,
- to identify the root causes of why it is deteriorating,
- to consider the potential consequences of continued neglect of the transportation system.
- to review past efforts to address this significant issue, and
- to suggest some potential short and long term means to move forward.
We are grateful and deeply appreciative to Mr. Terry J. Stevinson for his creation of this fellowship and we also extend our warm thanks to the Board of Directors of the Common Sense Institute and notably to President & Chief Executive Officer Kristin Strohm and Director of Policy and Research Chris Brown. This project has been enjoyable and even more interesting than we planned given the events during its development.
Ben Stein and Henry Sobanet,
2020 Common Sense Institute Terry J. Stevinson Fellows
The Current State of the Colorado Surface Transportation System
Today, Colorado is in the midst of a slowly unfolding, unquiet crisis. This is an unquiet crisis because there have been many efforts over the past two decades, some more successful than others, that have attempted to improve the system or to educate the people of Colorado on the deficient condition of the state’s transportation system; yet a long-term sustainable fix remains elusive. Over this period, surface transportation infrastructure has been aging and the use of the system, both for heavy freight and personal mobility, continues to expand. As a result, Colorado is experiencing increases in congestion and further roadway degradation.
Akin to a slow-motion train wreck (pun intended), the status quo trajectory of our state’s surface transportation system will eventually lead to a crisis. The increased mobility that our system affords people, goods and services is a key ingredient in the glue that holds our quality of life and our economy together. With a transportation system becoming less and less effective, the costs of the goods we purchase will increase, access to jobs will decreases, and our quality of life will worsen by limiting access to the amazing outdoor activities that make Colorado special.
Colorado’s highway, mass transit, and rail systems were not built in a day. They are the result of decades of planning, construction, and investment. Maintaining these systems is a complex and expensive process; sustained investment is required to maintain their functionality. Unfortunately, since the beginning of the 21st Century, Colorado has not invested adequately in maintaining its highway system in particular. Other problems are emerging that are causing challenges for the Regional Transportation District’s (RTD) mass transit system, Colorado’s largest. Colorado can’t fix these long-emerging problems in a day, but the longer the deterioration continues unaddressed it only adds to future costs.
For now, there remains an unmet goal of persuading a majority of Coloradans to agree on a path to making additional meaningful improvements to the system. Though the focus of much of this paper is on state highways, roads, and bridges, we also provide an overview of other surface transportation systems in Colorado such as transit, and both heavy and light rail. For now, and as we look ahead, it is unlikely that any component of the surface transportation systems in Colorado is prepared to increase the efficient and effective mobility of goods, people, and services that are central to economic activity and to increase quality of life.
Highways, roads, and bridges
At present, the Colorado Department of Transportation (CDOT) is responsible for a state highway system that encompasses 9,077 centerline miles (22,970 total lane miles) and includes 3,451 major structures and bridges. This system handles roughly 32 billion vehicle miles of travel each year.ii
In addition to these state-maintained roads, Colorado’s counties maintain over 58,000 miles of roads and about 3,000 additional bridges. Colorado municipalities also maintain many of the roadways and bridges within their boundaries.iii Clearly, there is an expansive system of roads and structures here in Colorado to maintain.
The system is under pressure from growing usage, age, antiquated financing, Colorado’s climate, and expensive inputs.
System Usage. Since 2000, Colorado’s population has increased by about 30%: an additional 1.4 million people. Over the same period, vehicle miles traveled (VMT) has increased under 25%. While usage of the system has increased substantially the system’s capacity of lane miles has not materially increased.
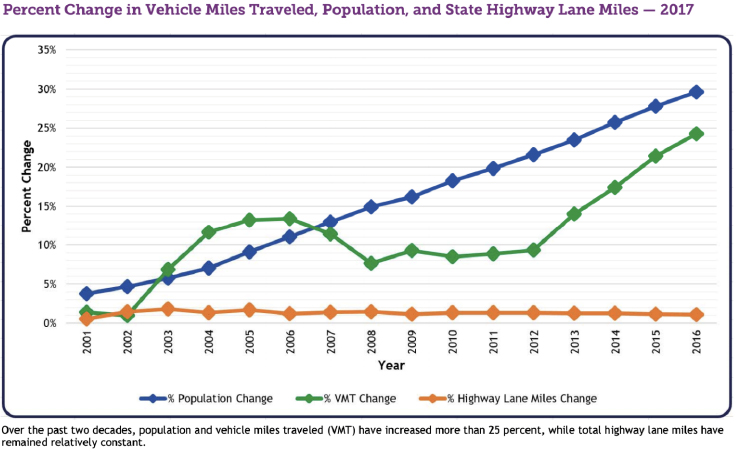
Chart Source: CDOT Performance Plan, Fiscal Year 2020
Though these pressures are straining the system, there have been some changes to driving preferences and behavior in recent years that deserve some discussion. Specifically, we note the interesting national trend whereby, on a per-capita basis, people are driving fewer miles today than they did in 2004. Key elements that underly this trend include increased work from home, online shopping, and a tendency for today’s millennials and generation Z to live in denser urban environments rather than the suburbs.iv
Though these factors point in the long term to some relief from increased demand, other trends to countervail them exist. These trends include declines in mass transit ridership on a national basis, the increased use of the roads for package delivery services and an increasing national population. This indicates that while per capita road usage is down, overall road usage is not. In the case of ride sharing, once hailed as a potential source of demand reduction, a recent study indicates that they actually increase congestion as they currently operate.v
While there is some positive movement on the demand side of the transportation problem, the countervailing trends and current state of the system indicate that whatever reductions in demand occur over the next decade or so, at best they will only contribute to slowing the growth of the demands on the system rather than actually reaching the point where demands will decline.vi
Not only is the total number of passenger vehicle miles driven on Colorado’s roads rapidly increasing, so is truck traffic. Truck traffic is of special significance because a fully loaded 80,000-pound truck places as much wear and tear on a roadway in a single pass as do 9,600 automobiles.vii
Many roads, especially those identified as freight corridors, cost far more to construct and maintain due to increases in heavy vehicle traffic. The Congressional Budget Office has estimated the costs of freight traffic to the highways of the US to exceed the taxes paid by trucks as a figure between $58 to $128 billion per year.viii
According to CDOT’s 2019 freight plan,ix approximately 201 million tons of freight traveled on Colorado’s state highway system. While the rapid and effective movement of goods is essential to our economic wellbeing, the movement of all these goods directly impacts the conditions of our roads. Freight vehicles also have an impact upon congestion. The top ten identified congestion bottle necks in the state have a freight truck volume of at least 15%.
System Age. As roads, bridges, and other structures age, they simply require more maintenance. A key example of this is Interstate Highway 25 (I-25), which runs north to south along the Colorado front range. The first segment of this 299-mile interstate began construction in 1948 and was completed in 1958. The entire project was completed in 1969, over 50 years ago.x In the years since it was completed much has changed in how the interstate highways are designed, the volumes of traffic using them, and the types of vehicles and trucks whose weight they bear. Consequently, since 1999 I-25 has almost continuously had locations where large sections are under construction, not only within major cities (ex. the T-REX in Denver and COSMIX project in Colorado Springs) but between urban areas to address higher freight and passenger traffic volume and to replace aging infrastructure.
Antiquated Financing. There are many ways to capture the fact that Colorado’s motor fuels taxes and registration fees (the majority of CDOT’s budget) have lost pace against rising fuel efficiency and the costs of constructing transportation infrastructure. Consider that since 1991, when the current unleaded gasoline tax was set at 22 cents per gallon, the Colorado consumer price index (CPI) has increased by a cumulative 113 percent. Keeping in mind the CPI is on average a bit lower than construction costs, just adjusting for CPI (1991 to 2019) would add nearly 25 cents per gallon, which would have generated just under $600 million for transportation in calendar 2019.
The chart below captures this trend over just the last 15 years. Though collections in the Highway Users Tax Fund (mostly motor fuel taxes and registration fees) have modestly grown, their purchasing power, when adjusted for construction costs and population has been dropping. Even with the growth in collections from 2009’s FASTER registration fee increase, the gap has continued to grow. Had revenue kept pace with population and construction costs over this period, by FY 2018-19, there would have been $644 million additional collected in the HUTF.
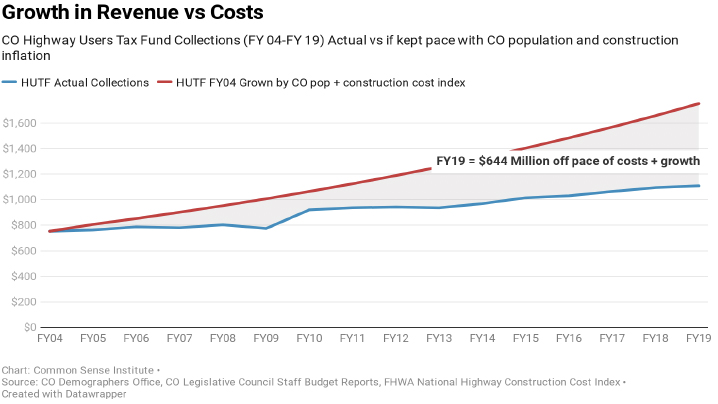
Chart Source: CO Demographers Office, CO Legislative Council Staff Reports, USDOT FHWA National Highway Construction Cost Indexxi
Colorado’s varied and harsh climate. The job of maintaining Colorado’s transportation system challenge is made harder by the freeze-thaw cycle and snow removal. Colorado’s weather from late autumn through the spring includes many days when the temperature swings below freezing and above freezing. The freeze-thaw cycle can wreak havoc on pavement by causing potholes, aggravating and expanding pavement cracks, and impacting bridge expansion joints and bearings.xiixiii CDOT reports that in the past year in the Denver metro area alone, it had to repair 153,000 potholes.
Snow removal is another major natural factor affecting Colorado’s roads. Not only does CDOT expend $69 million annually on snow removal, snow removal has its own impacts on the roads. Using de-icing material expands the number of days when a freeze-thaw occurs, and plow blades can and do cause pavement damage.xiv
Expensive inputs. There are many reasons why highway and fixed rail mass transit systems are so expensive to construct. However, we can generally identify construction costs via three categories: materials, labor, and regulations.
CDOT recently completed repaving approximately 3.5 miles of I-225 on the southeastern side of Denver. This relatively simple maintenance project cost $9.7m.xv Other projects, particularly the construction or reconstruction of bridges, cost far more. The replacement of the Grand Avenue bridge on SH-82 in Glenwood Springs, cost about $125 million. As expensive as ongoing maintenance is, such as the repaving of I-225, the cost of not maintaining structures and roadways is much greater. As an example, full depth roadway reconstruction or the replacement of bridges is far more costly, than the annual maintenance required to ensure those infrastructures never reaches the level of deficiency that would prompt the reconstruction or replacement in the first place.
Bridge maintenance and construction brings many aspects of this issue to light. CDOT’s current largest project, I-70 Central reconstruction in Denver and Aurora, has a total budget of about $1.7 billion. This project’s first phase, which will improve about 10 miles of the interstate, is currently funded with $1.2b.xvi What makes this so notable is that if you do not count one-time annual General Fund transfers to CDOT, $1.2b is about the size of the department’s entire annual budget.
The materials used to construct roads are expensive because they must withstand the wear and tear of weather and heavy vehicle passage, and ideally last for many years. To address these concerns, the Federal Highway Administration and the American Association of State Highway and Transportation Officials have developed extensive guidelines for the materials to use and the design standard for roads. In one particularly notable instance here in Colorado, a specific decision was made to not follow these standards for the construction of C-470 in the southwestern portion of the Denver Metropolitan area. Rather than build it to interstate standards (this is why it is C-470 not I-470) it was built at a lower cost with a lower set of standards. Now a significant portion of C-470 is in the final stages of a major reconstruction not only to accommodate the huge increases in volume it now experiences, but also because of the stresses of its use and the substandard design used to build it. The cost of this reconstruction is currently estimated at $276m.xvii
The labor costs to construct highways and transit ways are also substantial. The designs of these surface infrastructures requires the efforts of highly trained professional engineers. Planners are needed to determine where and in what configurations new roads should be built and to help address community concerns as to how and when roads are updated or reconfigured. Actual construction requires large numbers of workers, supervisors, and inspectors, all paid competitive wages (by law prevailing wages). Modern technology has, to a degree, moderated these costs by enhancing worker productivity through a combination of automating the design process and enabling the use of more sophisticated and powerful construction equipment on job sites yet labor still remains a costly portion of the process.
Regulation is another driver of the costs to the system. As noted above, roads have a significant impact upon the environment, the economy, and our neighborhoods. To ensure these impacts are fully thought-through and appropriately mitigated, an extensive environmental impact process has evolved. Depending upon the project location, extent, and other potentially controversial aspects of a proposed project, this process can either go very quickly, or as the now under construction Central I-70 project in Denver demonstrates can take decades and millions of dollars to complete.xviii Although the environmental clearance process is the most well-known regulatory requirement placed upon the transportation system, it is by no means the only one. Other regulations permeate the process, ranging from prevailing wage mandates to “buy American” policies on material procurement.
When you compile all these factors, the net result is that, according to the Reason Foundation’s 2019 Annual Highway Report:xix
Colorado’s highway system ranks 36th in the nation in overall cost-effectiveness and condition. This is a five-spot decrease from the previous report, where Colorado ranked 31st overall. In safety and performance categories, Colorado ranks 23rd in overall fatality rate, 13th in structurally deficient bridges, 37th in traffic congestion, 28th in urban Interstate pavement condition and 47th in rural Interstate pavement condition.
At the same time Colorado’s national ranking of the condition of its highway system is falling, Colorado’s national ranking as an overall great place to live is moving up. In fact, Colorado is the eighth fastest growing state in the union. In 2018, Colorado added 77,000 people to its population and with a current population around 5.8 million people, Colorado ranks 21st in total population.xx
Increasing traffic volumes over the next 10 years will exceed the capacity for many State Highway and Local Roadway systems, especially along Colorado’s Front Range. This anticipated congestion will only be exacerbated with increased population growth and the aging of Coloradans. Front Range counties are experiencing significant population growth.xxi
Other Surface Transportation Modes
In addition to highways, roads, and bridges, we provide a brief scan of these other important aspects of our surface transportation system: mass transit and passenger rail along with passenger and freight railroads.
Mass Transit and Passenger Rail. Mass transit is primarily (but certainly not exclusively) a factor to consider in large urban areas and in particular within the Denver Metropolitan area. Within this area, the RTD presently operates an extensive combination of buses, light rail, and commuter rail. The RTD serves all of Boulder, Broomfield, Denver, and Jefferson counties, parts of Adams, Arapahoe, and Douglas Counties, and a small portion of Weld County. The total service area is more than 2,300 square miles. RTD also provides shuttles, paratransit services, demand-responsive services like FlexRide, special event services, and vanpools.xxii
RTD currently operates a fleet of more than 1,000 buses, 172 light rail vehicles, and 66 commuter rail cars. Since 2004 RTD has greatly expanded its service network, primarily through the expansion of its light rail and commuter rail systems through its “FastTracks” program.xxiii RTD has relied heavily on forms of debt financing to fuel this expansion. While this is an often-used strategy to invest in a system, it means that a significant portion of RTD’s annual revenue streams are committed long into the future to pay off its debts.
While RTD’s budget and commuter/light rail systems have expanded substantially over the past several years, ridership has steadily declined. In fact, annual boardings as recently as 2015 totaled 103.4 million; in 2018 the total was 97.6 million. In the same time frame, RTD’s annual total revenues, mainly derived from a regional sales tax, have increased but service levels and ridership have not. Not only are boardings decreasing, but recent news reports indicate further problems at RTD including a driver shortagexxiv that is causing it to significantly reduce service levels provided.
The ridership declines impacting the RTD system started before the driver shortages began to impact service level. This trend is continuing despite the City of Denver’s active efforts to discourage the use of automobiles. Denver has as a stated goal to “Reduce single-occupant vehicle commuters to 50%, and increase the percentage of bicycle and pedestrian commuters to 15% and transit commuters to 15%.”xxv The two elements to which these ridership declines are attributed are the introduction of ride sharing services (mainly Uber and Lyft) and low motor fuel prices.xxvi
These factors, combined with the rapid population increase and road usage numbers noted above, indicate that, despite the region’s significant investment, mass transit is not meaningfully reducing Denver metropolitan area congestion to date. Exacerbating this issue is RTD’s extensive use of various forms of long-term debt (bonds, certificates of participation, concession agreements) to finance the construction of its system. While the use of long-term debt has allowed RTD to greatly accelerate the system’s construction, the annual payments now consume about 20% of its annual budget, limiting its financial flexibility to adapt to changes in ridership patterns.xxvii Even with these issues noted, transit must continue to play an important role in our transportation system because it is a key resource for many who would otherwise not have an affordable or available mobility option.
Intercity passenger rail does not currently play a meaningful role in Colorado’s surface transportation system. The state has, however, in recent years made several efforts to evaluate the potential of high-speed intercity rail to become a more significant element of the system. Specifically, CDOT has examined the potential implementation of high-speed rail along two potential routes; one along the front range, spanning the Ft. Collins to Pueblo I-25 corridor and another from Denver to the mountain ski resorts along the I-70 corridor terminating at the Eagle County Airport. The thought is that passenger rail in these two corridors may significantly improve mobility and reduce congestion. In March 2010, the Rocky Mountain Rail Authority (RMRA) published a very extensive High-Speed Rail Feasibility Study looking at this issue.xxviii
Since then interest in intercity rail has persisted and in 2018, the Colorado General Assembly appropriated $2.5 million to the Southwest Chief and Front Range Passenger Rail Commission to update and further evaluate high speed passenger rail on the front range. The report, “Front Range Passenger Rail Service Development Plan and Project Specific NEPA Engineering” is currently in progress. As that study is not yet complete, the RMRA final report is the best available source document.
The RMRA study did conclude that high speed rail is feasible in both the front range and the mountain corridor. The RMRA report defined feasibility as;
- the system was technologically viable,
- the fares could cover their operating costs but not their capital costs and,
- the system would provide an overall economic benefit greater than the cost to construct it.
While the study did generate ridership estimates for the rail lines, it did not address to what extent rail ridership might alleviate the congestion on I-25 or I-70. The study split the overall project into four phases and estimated the length of time and cost to construct each phase. The study estimated five to nine years for each of the four project development and environmental phases and another five to nine years to complete each of the design and construction phases. The cost estimate to complete the full build-out of a very high-speed electric train route from Ft. Collins to Pueblo (with access to DEN) amounted to an approximate $5.96 billion with the east/west mountain corridor estimated to cost $13.0 billion. The costs for the locomotives and cars to operate in these corridors was estimated at about $2.0 billion. These costs are all in 2008 dollars.
Passenger and Freight Railroads. The other element of the Colorado surface transportation system is railroads. Passenger rail in Colorado at present is extremely limited with Amtrak running just two daily trains through the state. Colorado’s freight rail system is much more extensive; it “extends over 2,684 miles and is operated by 14 privately owned railroads. Together, these freight railroads moved more than 154.7 million tons of products into, out of, within, and through Colorado in 2014.”xxix Since freight rail is privately owned and operated, unlike the other elements of the surface transportation system, this paper does not address that aspect of the system.
What will future technologies hold for transportation?
“If I had asked people what they wanted, they would have said faster horses.”
-Attributed to Henry Ford
A look back before we look ahead
The Henry Ford quote harkens back to the 19th century, when urban America faced a public health crisis of a different kind than COVID-19. The cause of that crisis was also, however, the prime mover of our surface transportation system: the horse. In the late 1800s, the United States was rapidly urbanizing as its population and economy shifted from an agricultural basis to an industrial one. While urban areas grew at a dramatic rate, so did the density of people and of the horses to transport people and goods. Unfortunately, while the horse did a reasonably good job of moving people and freight, its use came with some dire for public health ramifications.
In New York City, for example, there were approximately 150,000 horses. These horses generated an average of 22 pounds of manure and a quart of urine per day. In addition to their waste, an estimated 15,000 horses died each year and then either rotted in place or had to be carted off. Between the carcasses and the waste, one estimate is that the flies and other maladies associated with horses resulted in the deaths of up to 20,000 people per year.xxx
While the horse was essential to the functioning of these rapidly growing cities, clearly its continued presence had to be addressed in one way or another to solve this problem. The solution was a technological breakthrough: the automobile. Yes, about a century ago, the car (and freight hauling trucks) successfully addressed a major threat to public health and the capacity of urban areas to grow. Admittedly, motor vehicles come with their own set of issues but at the dawn of the 20th century, the advantages motor vehicles offered for mobility, capacity, affordability, and public health clearly outweighed the disadvantages that accompany their use.
Adopting motor vehicles of course also led to a number of significant changes in our transportation infrastructure as well as to improved public health. These included the decision to develop extended road networks, which in turn led to the adoption of state and federal schemes of taxation for the design and construction of intercity and interstate networks. Extensive networks of “farm to market” roads in rural areas also came into being, and significant changes in urban and suburban areas as metropolitan areas also occurred.
Perhaps the most important change in urban areas is that the automobile resolved the so-called “last mile” issue for commuters in a manner far different than how it was previously addressed. Prior to the advent of the car, workers either needed to live within walking distance of their place of work or from a train or trolley that could drop them off nearby.
The car eliminated this limitation and the result is a dramatic change in how cities and suburbs are laid out. Land use planning since the advent of the car has led to far more dispersion of the urban population and, essentially, to the creation of large suburban areas. People now routinely live in areas far removed from where they work, and places of employment are frequently not located in dense clusters easily accessible by mass transit. As an example, Amazon recently opened a major fulfillment center in Aurora near the intersection of E-470 and I-70.xxxi This center not only employs several hundred workers, the volume of freight and delivery vehicles going to and coming from the center is large. Any significant technological change to the transportation system, must consider such factors to prove viable.
Over the next 10 years, the odds are reasonably good that the surface transportation system will largely resemble the system we have in place today. Just as the horse was not replaced overnight, neither will the privately-owned and -driven internal combustion powered vehicle. But in the longer term it is quite possible that, just as when the automobile replaced the horse, technology will offer additional alternatives to transform the surface transportation system and address some, and maybe a majority, of the challenges with which Colorado is currently grappling.
We note that though the future developments we discuss are encouraging, Colorado’s baseline road conditions and capacity are not so well maintained that these prospects alleviate the need to address them. Even autonomous and electric cars need a sufficiently maintained and available system on which to travel.
Admittedly, predicting just what the future may bring is a process prone to error and misjudgment, but that does not make the task any less important. Setting aside the current disruption of the pandemic, generally accepted elements of what the future will bring include the following:
Vehicles will become even more fuel efficient and emit fewer emissions
Gasoline and diesel-powered vehicles have become considerably more fuel efficient in the 45 years since the federal government first introduced fuel economy standards. Illustrative of this trend is the fact that between the years 2000 and 2018 the average annual use of gasoline per vehicle has declined from 700 to 653 gallons per year.xxxii In the same time frame, the number of motor vehicles has increased by about 50 million, significantly increasing the wear and congestion on our roads.xxxiii
The current administration may relax the rate at which motor vehicle fuel efficiency must rise in the upcoming years. Nonetheless, the cost of fuel, the concern about motor vehicle related emissions, improved vehicle design, and the advent of alternatively powered vehicles make it highly unlikely that fuel efficiency will cease to improve. Clearly this is good for the environment as decreased combustion of fuels means fewer emissions. If electrically powered vehicles are the future of surface transportation, presumably this will have an even more significant impact because these vehicles do not emit anything. For electrically powered vehicles, their emissions vary depending upon the type of power plant that produces the electricity to charge them. Also, since they do not have transmissions, their transfer of energy into vehicular motion is more efficient than it is with internal combustion.
These improvements in efficiency do, ironically, have a downside, which in part inspired the crafting of this report. Better efficiency reduces the collection of motor fuel taxes which are calculated on a cents per gallon of fuel sold basis. According to the Institute on Taxation and Economic policy, from 2010 to 2019, 31 states reformed their tax policies for highways, roads and bridges. Colorado is not among them.xxxiv
Another issue related to technological transformation is transportation’s impact on the environment and the changing attitudes on the subject among the general public. Quite simply, a transportation system largely powered by fossil fuels is a significant detractor from our environment. The internal combustion engines that power our current vehicle fleet emit a variety of chemicals that impact air quality and affect health outcomes for people. Although significant progress has occurred over the past 50 years to reduce these emissions, problems remain. Currently, the most notable of these is the emission by vehicles of greenhouse gases (carbon dioxide, or CO2).
A recent Wall Street Journal articles states:
In the U.S., roughly 17% of the carbon dioxide and other so-called greenhouse gases that most scientists link to global warming comes from cars and light trucks, according to 2017 data, the latest available. In Europe, their share is almost 20%. The U.S. is set to implement in 2021 new fuel-efficiency rules for heavy-duty trucks first promulgated in the Obama era…At present, there is no clear technological roadmap for reaching that green destination. Lighter trucks that transport goods around cities are likely to use the same battery technology now transforming the car industry, but lithium-ion batteries are not suitable for the long-range haulers that account for the bulk of emissions.xxxv)
Our “smart” vehicles will keep getting smarter, as will our roads.
One of the most intriguing developments of the past decade is the increased use of technology in vehicles. Of particular interest are technologies to assist drivers and that may lead to self- driving, or autonomous vehicles. Over the past decade many major automobile manufactures, Google, and others have made large investments in this technology.xxxvi Although much progress has occurred, autonomous vehicles are not yet a reality. Nonetheless the odds are good that within a decade, self-driving cars will become a reality.
In the most favorable case, autonomous/connected vehicles may dramatically decrease the space each car needs, exponentially increase throughput on roads, make traffic signals obsolete, and make accidents, essentially, a thing of the past. If successful, these developments may also significantly decrease the cost of highway infrastructure. Technology may allow for a three-dimensional system allowing some portion of traffic to move above ground. Doing so may eliminate the need to build physical structures (roadways) for vehicular movement. Amazon’s experimentation with the use of drones to make deliveries may represent a significant first step in this direction. In addition, a number of automobile makers, including Porsche and Toyota are making significant investments in the development of electrically powered “aeromobiles” to transport people.xxxvii
At the same time another interesting technological advance is occurring: our roads are becoming smarter. For years now, departments of transportation have deployed cameras and other sensors to obtain real time understanding of road conditions. CDOT, for example has deployed sensors for more than a decade. To date these sensors have largely gathered existing information to allow CDOT to monitor and react to accidents or traffic conditions and to provide travelers with real time updates on traffic conditions. While this data and approach is useful, the long-term opportunity is to use this information to significantly improve the actual operation of highways. The generic term for this is “managed motorways” and exactly how they are managed and with what specific goals in mind varies. At present, probably the most advanced example of managed motorways is in Melbourne Australia where they:
- use coordinated ramp metering signals as the primary control
- ramp signals to regulate and space out vehicles entering the motorway – this improves merging and downstream motorway operation
- overhead lane signs to control traffic flow, particularly in an incident
- on-road message signs displaying real time travel times and incident information
- CCTV cameras and vehicle sensors to manage traffic as well as monitor breakdowns and accidents.
The main purpose of metering traffic entering a motorway is to prevent flow breakdown and congestion. The secondary purpose is to assist in recovery from congestion if it occurs, limiting the spread of queues upstream. Travel times are best when there is no congestion and traffic is moving at a consistent speed. Motorists may see ramp signals operating, even if the motorway appears to be moving at a reasonable speed.xxxviii
At its current level of technology, Victoria Roads (the highway authority in Melbourne) estimates that the use of these technologies increases throughput in its main arterials by 25-30% limiting the need to construct additional lanes.
The most intriguing future scenario is one where these two technology trends are combined. Rather than autonomous, self-driving vehicles, you have “connected” vehicles that are in communication not only with all the other vehicles on the road but also with the infrastructure.xxxix Although significant challenges exist to the full development and implementation of this type of technology, if it ultimately is developed it will dramatically transform traffic operations. Not only may we have self-driving vehicles, we may no longer need traffic signals as they currently exist. When all the vehicles and the infrastructure are aware of each other and the correct programming is in place, the system can prioritize vehicles entering and exiting an intersection far more efficiently than can a traffic signal. In a fully connected environment, traffic operation and signals as we know them today may simply disappear with signals existing, if at all, to accommodate pedestrians.
Initially installing the requisite sensors and modifying roads and highways to accommodate a fully connected system is not inexpensive but will certainly cost far less, significantly improve safety, and improve through put far more than simply building more through lanes.
Ridesharing and the possible elimination of human drivers may transform driving and vehicle ownership patterns
Currently Uber, Lyft, and other ride sharing services are not especially profitable, but that does not lessen the impact they have on how people in the US (and other countries where similar services operate) get from one location to another. Ride sharing services are still, essentially in their infancy and exactly how and to what extent they may transform the shape of surface transportation in the US remains a work in progress. The rapid growth of existing ride sharing services which address the “last mile” problem by dropping passengers much closer to their destination, combined with the declines in mass transit ridership nationally, and locally, indicate that as they mature consumer preferences for these services will grow.xl One of the potentially most significant outcomes of their evolution may be the end of the personally owned automobile and its replacement with a “transportation as a service” model.
Transportation as a service may not only transform vehicle ownership and ridership patterns, it may make our present mass transit systems (particularly those running on fixed guideways) and other elements of the surface transportation infrastructure obsolete. If transportation as a service evolves, it is also likely to have a favorable impact on traffic patterns and congestion. We also note that the current development of increased remote work and delivery of services may interact with these developments, possibly accelerating them.
Owning an automobile is a significant annual expense with the average cost weighing in at about $9,500 per year.xli Many vehicle sharing programs have the potential to provide people with all the utility of automobile ownership with substantially lower costs and responsibilities. If autonomous or connected vehicle technology fully develops there is the potential that people will no longer drive cars. Logically if a car is simply a form of conveyance, the current patterns of ownership will also shift with vehicles becoming more utilitarian rather than delivering performance or other characteristics that presently make the ownership of various types of cars (high-performance cars for example) desirable.
The possible end of internal combustion powered vehicles will significantly alter major sections the economy
In the early years of the automobile era, the internal combustion engine was not the only power source considered. Electric cars and trucks were tried out but ultimately the low cost of petroleum, the inconvenience of charging and the limited range of that era’s batteries lead to the adoption of internal combustion engines as the standard.xlii Today we are apparently in the midst of a revival of the electrically powered vehicle. The genesis of this increased interest in electrically powered vehicles derives from a combination of factors. These factors include significant improvements in battery storage technology, the environmental advantages of electric vehicles (they do not directly discharge any emissions), their lower cost of time and labor to produce,xliii lower maintenance, and their performance characteristics. This likely will have a major impact on the complex chain of manufacturers, suppliers and facilities that currently service vehicles. This will also impact employment patterns, as at present about 1 million people are employed in the US as automobile or truck mechanics.xliv
The magnitude to date of the shift is noteworthy. Tesla, the leading maker of such vehicles, just announced that it sold 367,000 cars in 2019,xlv and Amazon recently announced an order for 100,000 electric delivery vans.xlvi Virtually every car manufacturing firm in the world is planning to build, or has already in production a suite of electrically powered vehicles.xlvii
Although these changes will likely take place gradually (the average car lasts for about 20 years prior to becoming scrap), in addition to the changes noted above there are other impacts that merit consideration. Among the most obvious, and one directly related to our roads and infrastructure stems from the simple fact that electric cars do not run on refined petroleum. Currently there are approximately 110,000 gas stations in the USA. All of them are adjacent to roads with egress and ingress points. Essentially all of them are supplied with fuel by thousands of tanker trucks that deliver over the course of a year about 143 billion gallons of fuel to these stations from the refineries.xlviii
Because electric vehicles do not need to fill up at gas stations, they can recharge in a home owner’s garage or essentially anywhere they can access a 220-volt circuit or some other means for a relatively quick charge. If electric cars do become dominant, then the number of fuel stations will likely decrease, as will the need to transport nearly so much fuel from refineries to the stations.
In rural areas, a declining demand for petroleum may have another impact. Currently it takes about 2,000-3,000 truck trips to complete a hydraulically fractured well site.xlix This places significant wear and tear on rural roads that rarely were constructed to deal with this volume of heavy trucks. So, in those parts of the country where drilling is a major industry, like Colorado, the growth of electric vehicles may lessen the impact of trucks on the state’s roadways, the decline in the number of fuel stations may somewhat ease congestion due to vehicles entering and exiting them, and may have other yet-to-be-determined impacts on traffic and congestion patterns.l
The current transportation infrastructure (roads, parking, mass transit, intersection configurations) may not support the transportation systems of the future.
Since the early years of the 20th Century, all levels of government and the private sector have spent significant time, money, and effort as a nation to build out the present surface transportation network. The bulk of those expenditures have focused on making intracity/intrastate, rural to urban and, suburban to urban destinations accessible by car or truck. Most of this infrastructure is also designed to support individually owned and operated automobiles and fleets of industry owned trucks and vans. This infrastructure does not only include roads. Parking structures and parking lots have also become significant features and consume significant amounts of urban and suburban land. All these facilities are very different from the infrastructure that existed prior to the adoption of the motor vehicle.
The infrastructure best suited to support future transportation systems may not present quite so stark a contrast as the changes that were needed to accommodate motor vehicles as opposed to horses, but they may nonetheless prove quite significant and costly. As an example, if transportation shifts from the model of privately owned and operated vehicles to one of transportation as a service where vehicles drop you off and then move to serve another customer, the vast areas dedicated to parking lots at suburban malls or downtown parking structures may become a thing of the past. At the present time, many airports are feeling the impacts of the huge growth in ride sharing services in the form of reduce parking revenues, which next to landing fees, are their largest revenue source. The investments they have made in parking may not prove as lucrative as once envisioned.li Transportation as a service will likely need staging/storage yards for vehicles, but their configuration and locations may vary significantly from today’s parking infrastructure.
So, given all of the impending changes, the implications on future planning force the question:
How much time and tax dollars should we invest on the presumption that the types of surface transportation infrastructure built in the past century will continue as the right investments for the next century?
This creates a dilemma for transportation planners. On the one hand they try to use current technology to make the investments needed to address our deteriorating systems, while also recognizing that these investments may become obsolete prior to the end of their design lives.
A related consideration is how these changes may impact land use limits and zoning. As noted earlier, the widespread adoption of the automobile in the 20th century dramatically altered land use patterns as people no longer needed to live in walking distance to their place of work. Currently, many cities, Denver included, are investing in specific alterations to their road networks, such as dedicated bike and bus lanes, to encourage these modes of transportation. It is quite possible that these changes will not prove compatible with a transformed transportation network.
Based on just this brief overview of technology’s potential impact on transportation, it is now essential for policy making and network planning that building for the future should be integrated as much as possible into that process. For example, although the exact structure of it may not be perfect, the existing Colorado and federal tax credits for the purchase of all electric vehicles are good illustrations of incentivizing a different future that has implications for revenue streams as it materializes.lii Both Colorado and the Federal government need to thoughtfully consider how best to encourage the development of these potential technological advances and the extent to which they should, or should not, provide incentives to accelerate their development.
The yet-to-be-imagined development
And as with all looks to the future, it is quite possible that someone will come up with an idea that none of us can even foresee today that multiplies the improvements we are currently expecting. Though that is impossible to account for, the prospects for innovations are a bright spot in the transportation sector. Just one such item is the Hyperloop system promoted by Elon Musk. Significantly, the draft transportation authorization bill just passed by the US House of Representatives includes direction to US DOT to begin the development of a regulatory framework to accommodate the deployment of intercity hyperloop systems. Certainly, considerably more work is necessary before we will see the widespread introduction of hyperloops for intercity transportation, but this action by the House of Representatives, clearly demonstrates the development of transformative alternative means to move people and goods is not just idle conversation.liii
Given the discussion above, we outline a plan to improve Colorado’s roads and bridges in the following section.
A Plan to Move Forward
Clearly our surface transportation system here in Colorado is deteriorating under the continued pressure of increased use, limited capacity growth, and finite or dwindling resources to operate and maintain it. The extra challenge now is making recommendations in the context of a sharp recession.
The simple answer is to hope someone else will pay to repair and expand our transportation infrastructure, specifically the federal government. Admittedly the federal government dramatically expanded its role in transportation with the Interstate system and the taxes it imposed to construct it starting in the 1950s, but as noted earlier the federal government has not raised its motor fuel tax since 1993, and as the saying goes, “hope is not a plan.” So, Colorado must devise its own solutions to maintain the quality of life and economic prospects its residents expect. We note that there remains a possibility of an infrastructure infusion as part of stimulus packages in Summer of 2020 but at present most of the discussion centers on immediate support for businesses and individuals, not infrastructure. As time progresses without real progress for an infrastructure stimulus bill the probability that one will pass diminishes. Even if a federal stimulus bill is enacted only a limited portion of the funds will address roads and bridges.liv
Unfortunately, another simple answer, increase funding for transportation needs out of current Colorado General Fund revenues, is as unrealistic as the expectation of a federal bailout. For the reasons noted below and amplified in the appendices, and especially in the aftermath of the pandemic, additional General Fund dollars for transportation are unlikely at best.
First, the current recession is every bit as severe as the Great Recession and even with the scenario of a strong recovery, priority spending will be on backfilling the use of one-time dollars and restoring cuts in education and health care.
Second, the interplay of three major provisions in the State Constitution (1982’s Gallagher Amendment, 1992’s Taxpayer’s Bill of Rights, and 2000’s Amendment 23) has made budgeting in the General Fund intricate and constrained in the best of times and keeps major legislative solutions off the table. For example, K-12 funding requirements under Amendment 23 and the loss of local share property taxes under the Gallagher Amendment have been so dramatic that the share of funding for local schools has gone from approximately 2/3 from local sources to now about that amount from State sources. With this shift expected to continue, out of elected officials’ control, adding transportation into the general fund budget would necessarily come from reductions in other state spending, including education, dollar for dollar.
Third, a significant, but probably the least discussed or understood, issue is that the last 20-plus years of tax policy in the General Fund has been dominated by tax rate reductions or tax credits for targeted areas. The combined value of the four largest changes to Colorado tax policy that resulted in lower revenues, including an income tax rate cut to 4.63% from 5.0%, a state sales tax rate cut to 2.9% from 3.0%, the creation of the Senior Homestead Exemption, and the Earned Income Tax Credit, exceeded $1 billion in FY 18-19 alone, or an amount equal to roughly eight percent of total State General Fund revenue (in some years, these measures simply reduced what would have been rebates under TABOR anyway).
Fourth, in recent years policymakers carved out room in the General Fund for most of the annual payments for the COP financing in SB 17-267. These annual payments will be necessary for more than 20 years.
Voters have been skeptical too. Since the Taxpayer’s Bill of Rights was enacted in Colorado, no statewide general income or sales tax increase has received voter approval, including those proposing a tax increase for transportation. The politics of fee increases are equally fraught. Though Colorado had not increased its motor fuel taxes since 1991, when the State raised vehicle registration fees in 2009’s FASTER legislation, one of the state legislators who carried the bill in the House of Representatives was not reelected in the subsequent election. Still, over the long run, even if there were the political will to raise fees, unless a new enterprise structure is created, there will not be sufficient room under the State’s TABOR revenue limit to allow both a recovery in the General Fund and fee increases to solve the funding gap in transportation.
These factors take the “easy button” off the table and leave us with harder, yet unsurprising propositions to serve as potential solutions. Keeping all these myriad factors in mind, we are recommending a three-phase strategy to consider.
Phase One: Stabilization
The initial drafts of this paper were prepared prior to the emergence of COVID-19 and its extensive impact upon the world. At the time of this publication, it is more likely than not that the world is still in the first stage of the pandemic, an economic recession is officially underway, and most forecasters acknowledge the absurdly high levels of uncertainty.
Certainly, the most obvious impact of COVID-19 on surface transportation was the shock it applied to travel demand. The pictures of an empty Times Square in New York City and of airport concourses with no one in them were simply remarkable. The impact on mass transit was similarly dramatic with RTD reporting a 70% drop off in ridership and moving the entire system onto its weekend schedule.lv
Clearly during the duration of the mandatory stay at home orders, travel demand in the United States essentially evaporated and suddenly, we found ourselves not with a congested and overburdened system but one with excess capacity. The question, of course, is as the crisis recedes will travel patterns return to their prior levels or will some of the behavioral changes we saw in the shutdown endure?
The most notable impacts of the shutdown were:
- The forced shift of thousands of individuals places of work from an office to which they physically commuted to working from their homes,
- A massive shift from going out of one’s home to shop or dine to staying at home,
- Effectively no leisure or business travel, and
- Mass layoffs and furloughs for employees whose businesses were deemed non-essential: mainly retailers and dining establishments other than food and pharmacies.
We also saw…
- The number of deliveries significantly increase with people turning to online retailers and home food delivery. Overall, the streets and interstates were suddenly wide open.
- Thousands of people were suddenly introduced to the wide range of tools available for many office workers to effectively and efficiently work from home. Many who had never even thought before of working from home now have the experience of working rather efficiently and effectively from home. Online meeting tools, in particular have advanced to make meetings surprisingly successful.
- People also now have vastly more experience with online retailing and the convenience of rapid home delivery.
- Education for millions was delivered through online systems rather than in person. This may portend a revolution in the nation’s education system, particularly in higher education where online education has the potential to completely alter the manner and cost of obtaining a college degree.
- Many adapted to utilizing online services to attend church or have social events.
Even recognizing the value and importance of in-person human interaction, there still are reasons here to anticipate some permanent and possibly significant changes in travel demand.
The other notable impact of the stay at home orders, was their impact on the economy and governmental revenues. This is for the moment countered by the possibility of a sharp recovery. During the months of April and May 2020, we saw unprecedented unemployment claims, oil prices plummeted due to a combination of lessened demand and the Saudis’ decision in the midst of the COVID-19 outbreak to launch a price war. Retail sales activity was severely hampered. For Colorado and its local governments, especially in a time of increasing demand for services, this was all bad news. At the moment, revenue losses matching those of the Great Recession or possibly worse are the baseline scenario.
For transportation, the most significant revenue loss is the decrease in state HUTF revenues, primarily due to lower motor fuel tax receipts, this change is simply without precedent. CDOT’s current revenue projections, for example, feature a statewide revenue shortfall over the next four years of almost $7 billion: $3.2 billion for FY 20 and FY 21, $2.5 billion for FY 22, and $1 billion for FY 23 with additional emergency response and recession-related cost increases on top of the shortfall.
State gas tax (HUTF) is expected to fall dramatically over the next few years, with the steepest drop occurring during the strict social distancing period when people are driving much less. The most recent forecast calls for a loss of $50 million in HUTF revenue to CDOT, although more recent data suggests the impact could be higher.lvi
With these projections in mind, CDOT is also assuming that the annual $50 million in General Fund transfers they were anticipating will no longer occur with an aggregate decrease of about $250 million in the next three years. This may well prove an optimistic forecast.
Thus, our recommendation for the immediate short term, which we define as the remaining period before reliable treatments and/or vaccines for COVID-19 are available and the recession is over, is to assess a new reliable status quo for both revenue availability and systematic needs. This would include assessing:
- the permanency of the recession on transportation revenue sources, especially the gas tax,
- if there are significant changes in travel patterns that could affect project ranking or urgency,
- any measurable decline in wear and tear on the system, and
- appropriate steps to reform hybrid, electric, and autonomous vehicle registration fees and taxation to ensure fairness with traditional vehicles.
Phase Two: Rehabilitation
Beyond the immediate short term, which must be accounted for given these extraordinary circumstances, is revisiting where transportation needs were in early 2020. We call this the “pressing short term.” Based on the assessments in Phase 1, new calculations of the maintenance deficit should be recompiled. We consulted with CDOT to confirm the current thinking on the estimates of the annual need to keep the system largely in the conditions it currently is in now. Based on these discussions, a reasonable pre-pandemic estimate is $300 million annually.
Prioritizing the maintenance of the existing infrastructure is essential. Although maintenance is expensive, as noted earlier in the paper, the cost of neglecting it is even greater and does have some significant short-term consequences as CDOT notes:
Maintenance and operations expenses are largely fixed, since those activities (e.g. snow and ice removal and avalanche and rockfall control) are required to maintain basic road functionality. Thus, cuts would need to be absorbed by reducing the state’s construction program. Since we can’t cut projects that are under way or encumbered by contracts, we have to look at projects that are not yet awarded.lvii
Further complicating matters, maintenance is not just filling potholes and sweeping and replacing the bulbs in streetlights. Maintenance is also repaving existing roads or rehabilitating bridges. Many of the long-term major construction projects CDOT currently performs are not the construction of new items but the rehabilitation, replacement, or major repairs to the existing system.
Because maintenance spending has fallen so far behind, we recommend this as the “must do” step for Colorado to take. In addition to the benefits to motorists from avoided repairs and increased safety, properly maintaining what we have is invariably far less expensive than either the reconstruction of highway segments or the construction of new ones.
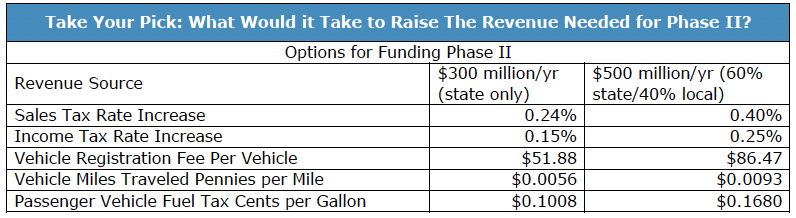
We have provided a menu of options for achieving new maintenance spending of $300 million annually. These are:
- Statewide Sales Tax Increase. In the tables below, the values would be added to the current 2.9% sales tax rate, so in the table on page 30, the 0.24 percentage point increase would make the new sales tax rate 3.14%. We used FY 18-19 data to calculate the increase.
- Statewide Income Tax Increase. In the tables below, the values would be added to the current 4.63% income tax rate, so in the table on page 30, the 0.15 percentage point increase would make the new income tax rate 4.78%. We used FY 18-19 data to calculate the increase.
- An increase in average registration fees. Because registration fees like the Road Safety Surcharge, depend on vehicle weight, individual impact will vary from the average. This is the dollar increase for passenger cars weighing between 2001 and 5000 pounds.
- Vehicle Miles Traveled Fee. Using the U.S. Department of Transportation, Federal Highway Administration data for Colorado in calendar year 2019, we calculated the cents per vehicle mile traveled statewide required to generate the amount noted.
- Higher per gallon fuel tax. We used the calendar 2019 gasoline, gasohol, and highway diesel volumes from the Colorado Department of Revenue to compute the increase in cents per gallon of tax that would generate the amount noted.
Though each of the options comes with advantages and disadvantages (ease of collection, regressivity/progressivity, ties to vehicle use, insulation from fuel efficiency, etc.), we chose not to recommend a specific one. Rather, we felt it was more important to show the increment required of each. Further, we have shown the required increases if new dollars are planned to be shared with counties and cities. This is the case now for nearly all state-generated transportation dollars and it takes the total amount raised to $500 million annually.
Phase Three: Transformation
Colorado’s road and bridge transportation system faces both a maintenance backlog and a capacity deficit. For the capacity deficit, the state is halfway through the plan outlined in SB 17-267 which allows for $1.88 billion in certificate of participation (COP) financing for road and bridge projects. Under current law, there will be additional infusions of $500 million in FY 2021-22 and FY 2022-23. At the present time, this means progress against the unfunded capacity needs in the remaining backlog will stop when the last of the projects funded via this program is completed.
During the early months of our fellowship, CDOT published the results of its statewide review of project priorities. The result of the process is a list of projects totaling $3.2 billion, with a proposed timeline of completion by 2030. The funds to complete the list are currently not available under current Colorado law or expected federal funding.
As one looks at the list (please see APPENDIX VI), it is clear how many key corridors require expansions and improvements, not just routine maintenance. Achieving this entire list of projects would alleviate some of the shortfall that contributes to the dollars required in Phase 2. If all of the $3.2 billion list were achieved, we roughly estimate a 15% reduction for a period of time in the Phase 2 annual costs. Eventually, the newly expanded system will require sustainable maintenance dollars as well.
As we emerge from this recession, it is possible that travel demand patterns may change substantively. If so, it is essential to recognize these changes proactively and reconsider where and what is built accordingly. Though Colorado’s planning process is cumbersome, it is not something we recommend overhauling and parts of it are required federally. Its best feature is that it allows for statewide conversations and buy-in. We would however recommend prioritizing the list through two lenses 1) changes in travel demand and 2) understanding that key freight corridors are prioritized if the shifts to more deliveries and a dispersed workforce are more permanent than not.
Thus, given the recommendation in Phase 1 regarding planning and reassessment time, and the incremental progress being made through COP financing through fiscal year 2022-23, there remains ample time for policy makers and stakeholders to work on plan to achieve some portion or alternative phasing of what we have called Phases 2 and 3.
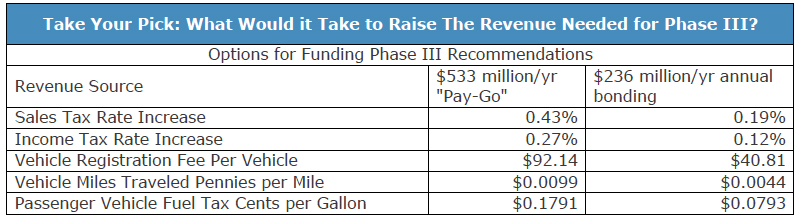
If begun in 2024 (after the SB 17-267 projects are funded) funding all of the $3.2 billion would require an additional $533 million per year to complete all projects by 2030. Alternatively, if financed, we estimate the annual payment would be $234 million for 20 years (assuming a 4% annual interest rate). The table below shows the incremental changes to the various taxes or fees that would achieve either a “pay-go” or bond-financed plan.
As noted earlier, we have deliberately not chosen the exact combination of fees/taxes/bonding to achieve the recommendations above. Our goal was to outline the pressing case for new dollars and a strategic path forward with particular sensitivity to the current economic upheaval.
The table below gives a sense of the total magnitude of both Phases 2 and 3. The combined costs of the phases include the cost savings (15%) noted above since some of the Phase 3 projects would improve the overall maintenance of the system.
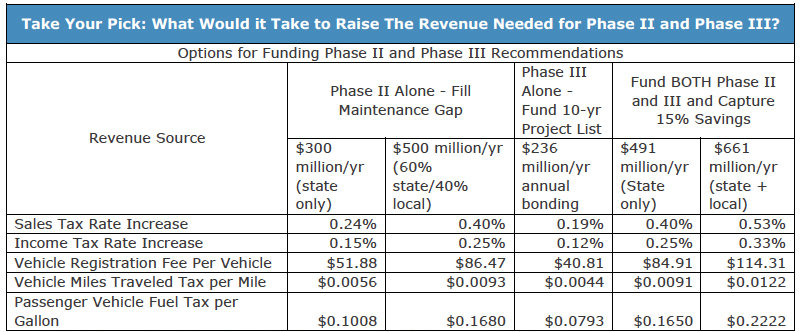
Chart Note: The combined Phase 2 and 3 columns reflect 15% of the costs for Phase 2 and the annual bonding plan for Phase 3. Other permutations of combined Phase 2 and 3 costs can be imputed from the other charts.
With the combined cost of Phases 2 and 3 ranging from $491 million to $661 million per year, we would note the following: 1) it has taken many decades to fall so far behind, 2) as a share of the economy, the all-in state-only Phase 2 and 3 cost is 0.13 percent of Colorado’s 2019 Gross Domestic Product and the all-in cost for the state and local plan is 0.17 percent—both plans cost less than two cents for every $10 of economic output.
We don’t take the potential impact of these costs on household and business budgets lightly, but there are also costs to doing nothing in the form or more expensive repairs to the system later, safety issues, damage to vehicles, and delayed travel time. We discuss these further in the next section.
The Potential Consequences of Continued Neglect of the Transportation System
The current state of Colorado’s surface transportation system is poor and from all indicators gradually deteriorating further. The ongoing deterioration of the system matters, as noted in the CDOT “Statewide Economic Benefits of Transportation Investment.”lviii
The quality of life and economic successes that Colorado residents enjoy are made possible by an affordable, safe and efficient transportation network. Manufacturers rely on this network to access markets and receive supplies. Businesses rely on it to conduct face-to-face meetings with customers and business associates. Residents rely on it to reach jobs, shopping destinations, schools, health care facilities, and leisure travelers to reach recreational and tourist sites. Colorado’s economic health and its ability to remain competitive with other states depend on the efficient transport of people and goods.
The counter argument is that since this passage was written in 2007 the state’s population has continued to grow and so has its economy. Given these two apparently contradictory indicators, the question to ask is why does maintaining or upgrading our transportation system matter. This is not a foolish question but there are two counter points to it. The first is that arguably the state could and would do even better if it had adequately invested in its transportation system. The second is that some select investments have occurred to allow Colorado to keep growing despite continued inadequate investment in surface transportation.
Probably the best example of this is to illustrate the difference that sufficient funding can make on Colorado’s economy is from Colorado’s aviation transportation system. In the1980s, Denver decided to replace Stapleton Airport because gate space was severely limited and its runways were unable to deal efficiently with Denver’s weather and wind patterns, causing nationwide travel disruption. The cost of replacing Stapleton was about $4.8 billion dollars and many questioned Denver’s decision to take on such a “megaproject,” but the results have proven it as a wise investment. According to the preliminary results of CDOT’s 2020 aviation economic impact study:
Denver International Airport’s (DEN) contribution to the state of Colorado’s economy increased by nearly 30 percent from 2013 to 2018. This is according to the Division of Aeronautics’2020 Statewide Aviation Economic Impact Study. DEN has grown to become a $33.5 billion economic engine for the state and a driver for increased business and travel.lix
The study also attributes more than 259,000 jobs to the Denver airport. Quite simply, this major investment in transportation infrastructure has proven a major boon to Colorado and is a significant factor in why Colorado’s economy continues to grow.
The key point here is that so far, the Colorado Front Range has continued to thrive and grow despite the continuing deterioration of its surface transportation system due to other important factors but to presume this will remain the case is not realistic in the long run. Colorado has continued to grow in spite of its surface transportation deficiencies largely because of other factors such as strong energy and technology-based business activity, the lure of its mountains and climate, the Denver airport. As CDOT notes:
Colorado’s businesses expect reliable service and dependable delivery. Grocery stores, hospitals, manufacturers, restaurants, and retail stores, all rely on our multimodal freight systems to deliver inventory critical and essential products. Imagine if hospitals ran out of bandages, if grocery stores ran out of milk, or if a birthday present ordered online didn’t arrive on time. The need for reliability and redundancy across Colorado’s multimodal freight system has never been greater.lx
Summary Thoughts and Observations
The challenges facing Colorado today are very real and no simple or easy answer exists. If such an answer existed, it would already be in place. The existing motor fuel tax system for financing transportation is not viable (as this recession’s impact on motor fuel taxes and as future technology demonstrate).
In no way should anyone take away that we think accomplishing the various possible tasks is simple. Rather, they are daunting: a balancing act between seeking to implement short to medium-term improvements based upon the current structures, physical and financial, in place today while at the same time accelerating efforts to implement technological solutions. And all at a cost people are willing to pay.
We believe that those leading any future reform can learn from the recent unsuccessful campaigns to raise revenue. They can take this intervening time to craft another effort that includes a compelling set of tangible improvements with a combination of revenues the voters will view as fair and reasonable. Though recent approaches did not resonate with a majority of voters, the public’s prioritization (pre-pandemic) of transportation has never been higher. Future efforts should shore up any concerns about accountability and/or prioritization of existing budgets, by pointing to the now 10-year track record of FASTER registration fees and the long-term commitment of existing revenue in the SB 17-267 Certificate of Participation financing in the General Fund.
But, we have to say it, and sorry, we are not sorry….It is time to stop kicking the proverbial can down the road. We must devise and agree upon a long-term solution to transportation funding that relies on sustainable revenue sources and achieves a better maintained and expanded system. We are still optimistic enough that we believe the sweet spot of a good plan with moderate costs, and visible, accountable outcomes is within the capabilities of the political and civic circles in Colorado. Though the nuts and bolts of the plans outlined here (or any competing ones) are important, they are not sufficient. Success will require those leading this effort to put aside preconceived notions or advocacy for a particular mode of transportation, a particular mode of finance, or preference for a particular region. The key is to work together in ways that have not occurred to date and to consider that some progress is vastly more useful than none.
Appendix I – Additional Funding Reform Options
Earlier in the paper, we presented information about several options to raise revenue for transportation improvements. Those would be most appropriate for multi-year maintenance or bonding programs. There are other mechanisms also in use in Colorado and around the country that deserve mention.
Tolling
Converting some major highways, (interstates for example) to toll roads is another option to raise money but the Federal government, at present precludes the conversion of the existing interstate lanes to toll roads, and Coloradans have struggled to accept the presence of tolled express lanes let alone all lane tolling.
If significantly more funding for its statewide transportation system is unlikely, then Colorado will have to pursue other alternatives to successfully serve its citizens and maintain its economy. Three possible alternatives, none of which are mutually exclusive, are:
- significant changes in the demand for transportation services,
- fundamental changes in the ways, transportation is funded in Colorado, and
- reinventing some aspects of the technologies that provide us with our transportation.
Local or regional taxes for transportation
Another possibility is to alter the way in which we fund surface transportation in Colorado. Our basic system of raising revenue to pay for transportation really has not changed much since the advent of the interstate system by the Federal Government in the 1950s. We still essentially rely upon state vehicle registration fees, state and federal motor fuel taxes (which currently do not cover electric vehicles by the way) and a very limited use of highway tolls. Excepting highway tolls, taxes and fees are collected on either a statewide or federal basis and then allocated to the state transportation authorities to serve their statewide systems or sub allocated to municipalities and counties to pay for their roads. Historically local taxes have played a minor role in transportation funding.
On the other hand, since 2000, portions of Colorado have experienced some real success in successfully garnering voter approval for local tax increases. In 2018 the Roaring Fork Transit Authority on the western slope passed a property tax increase.lxi
In 2004, the Denver metropolitan region approved a .04% sales and use tax increase to fund its FasTracks program. In 2019 this local tax for mass transit is projected to generate $267m with $177m of that total presently allocated for the payment of debt.lxii
The most significant regional example, however, is found in El Paso County where the Pikes Peak Rural Transportation Authority (PPRTA) received voter approval to impose a 1% sales tax for ten years beginning in 2004. In 2012 its voters approved a further ten-year extension to the tax. This is particularly notable since historically the El Paso county portion of Colorado has consistently opposed any increases in statewide taxes. The PPRTA allocates 55% of the money the tax raises to capital construction, 35% to the maintenance of the region’s roadways, and the balance to support the Colorado Springs transit system.
These successes contrast sharply with the failure of statewide initiatives to secure additional revenues for Colorado’s surface transportation system so considering a regional approach to transportation funding merits consideration. The primary concern with switching to a regional model for transportation funding, is the essential imbalance between where transportation infrastructure exists and regional capacity to pay for its improvement or maintenance. Quite simply, much of Colorado’s highway system is located in rural portions of the state while most of its tax revenue is collected in the major metropolitan areas along the front range. The reason for this imbalance is simple, roads do not exist simply to facilitate movement within a metropolitan area. They also exist to facilitate the movement of goods, people, and services between metropolitan areas, between rural areas and metropolitan areas, and interstate. This means significant critical stretches of Colorado’s roadways are in rural Colorado. As is noted in the CDOT Freight Plan:
When measured as a percent of all traffic, truck volumes are greatest along U.S. routes and state highways in rural regions of the state due to overall lower total traffic volumes. U.S. 287 south of Lamar, U.S. 40 between Lamar and Limon, U.S. 36 east of I-70, S.H. 59 north and south of I-70, and S.H. 71 north of Fort Morgan have some of the highest proportional truck traffic in the state. As a percent of all traffic, trucks account for 40 to 60 percent of all travel along these routes with 300 to 1,700 trucks per day along some segments. In western Colorado, U.S. 40 west of Craig and S.H. 141 also experience higher truck volumes relative to all traffic. These routes provide critical connections for manufacturers, growers, ranchers, and producers across the state to domestic markets and international trade gateways. Ensuring that these connections are maintained in good condition, that capacity constraints such as restricted bridges are eliminated, and that safety issues including truck parking, adequate shoulders, and passing lanes are addressed are critical to maintaining safe and efficient travel options for commercial vehicles.lxiii
Although there are benefits to all of us from a well maintained rural transportation system, the taxation capacity issue remains. Looking at property taxes, for example, the differences in assessed value varies dramatically. As an extreme, one can look at two counties in alphabetical sequence, Denver and Dolores. In Denver total valuation is $23.072 billion while in Dolores it is $.131 billion.[lxiv] While this is an extreme example, it does illustrate the inability of the rural counties of Colorado to generate via either sales or property taxes, the dollars necessary to maintain the state highways and interstates located within their jurisdictions. El Paso County, which as noted above has voted for increased regional taxes to support its local transportation system voted overwhelming (69,776 yes and 199,212 no) against Proposition 110.lxv
Realistically, the conclusion here is simple; regional proposals to increase sales or property tax rates (the income tax and motor fuel tax are exclusively state controlled and not subject to local imposition in Colorado) may well prove viable at the ballot box and make available significant funds to improve the road networks and transit systems within their jurisdiction. They will, however, leave significant gaps in Colorado’s capacity to sufficiently fund the operational maintenance and capital improvements for the large portions of the system located in the rural part of the state. Given the lack of success of statewide measures, perhaps a partial solution, such as this may prove itself a viable option.
Road Usage Charges
Though we discussed a simplistic VMT approach in the “Path Forward” section, the idea has had some real-world analysis and pilot experiments. A VMT based tax is sometimes called the Road Usage Charge (RUC). In December 2017 CDOT published a comprehensive report on the RUC pilot program it conducted.lxvi Basically, a RUC replaces the motor fuel tax with a per-actual-mile-traveled charge. For the pilot program, the rate was set at $0.012 per mile and participants had the options of self-reporting manually their odometer readings, using an automated reporting system without any location data, and an automated reporting system with location data reported. The key difference between these last two options is that if location data was reported then you were not charged for miles driven out of state.
The RUC’s primary attraction is that it charges all vehicles for their use of the road unlike the motor fuel tax which penalizes a low fuel efficiency vehicle and presently does not charge an electric vehicle at all. The RUC’s primary disadvantages are that to the extent it is calculated manually it is very expensive and difficult to administer, the public will have privacy concerns that the government will use this data to track their exact location and the potential to use it as something other than a means to raise revenue. Examples of this potential alternative use are altering the RUC charge by time of day to discourage driving at times of peak congestion, or charging differing rates based upon your location. To date these concerns, particularly the ones related to privacy, have prevented the adoption of RUCs even though various states have experimented with them for more than a decade. Then length of time RUCs have remained under discussion without their adoption, indicates that the ability of states to fully implement one is problematic.
Appendix II – How the Transportation Planning Process and Statewide Transportation Needs Are Set
Whether or not the problems with our current statewide surface transportation system constitute a full-blown crisis or not, the system is clearly deteriorating and not providing the level of service that best meets the needs of our citizens or our economy. So, the next question is how to address these problems and materially improve the system’s performance. The obvious, and standard answer, of course, is that we need to increase our spending on the system. Along with that presumption though, comes a second, equally important point: no one could or should approve additional spending without a reasonable assurance that the funds are spent in the most efficient and effective manner possible.
The good news in that regard is that Colorado has in place a system to develop priorities and identify projects to move forward. Certainly, no system is perfect, and one can easily find some examples of projects that arguably should not have moved forward but, overall the process is designed to ensure citizens, their communities, their elected leaders, transportation planners and professionals, and, yes, interest groups have an opportunity to have their voices heard.
The key elements of this system are the designated Transportation Planning Regions (TPRs) for the rural portions of the state and the Metropolitan Planning Organizations (MPOs) for the state’s urban areas. Other important inputs to the process are municipalities, counties, other governmental organizations such as Club 20, private organizations such as the Colorado Chamber of Commerce, and industry representatives such as the Colorado Contractors Association. The other important element of the planning effort is CDOT itself. CDOT’s personnel have an intimate familiarity with the condition of the state’s highways and also provide data on road conditions, structure conditions, congestion, engineering feasibility and environmental concerns.
The planning process currently has as its primary elements, a long-term,about 30 years, and a relatively short-term, four-year, planning process. CDOT’s latest development is the creation of a 10-year as an additional a subset of this process. CDOT did this to improve transparency and to round out planning visibility. The main long-term output of the planning process is the Statewide Transportation Plan. The Statewide Transportation Plan:
…identifies the future needs for Colorado’s transportation system, establishes a transportation vision and goals for the state, and outlines the strategic direction necessary to achieve these goals. The Plan connects current and future funding realities with business practices and partnering efforts to deliver an effective and efficient transportation system that works for Colorado today and in the future….Throughout the development of the Statewide Transportation Plan (SWP), CDOT works closely with a number of planning partnerslxvii and key stakeholders in an effort to ensure that the final SWP reflects the priorities and addresses the needs of all Coloradans.lxviii
The SWP is updated once every five years. Ultimately it is approved by the CDOT’s Transportation Commission but not until it has survived a careful development process in which all interested parties have an opportunity to make their case.
Probably the most important element of the SWP process is that includes a long-range revenue forecast. This forecast includes a low, a most likely, and a high forecast. This allows for some flexibility in initial planning by the TPRs and MPOs on what level of transportation related expenditures and projects may prove feasible over the length of the planning horizon.
The shorter-term plan that lays out the potential capital spending plans is the Statewide Transportation Improvement Plan (STIP). A subset of the STIP is a document known as the Transportation Improvement Plan (TIP). TIPs are required for projects within the MPOs and a project must be incorporated in a TIP, if applicable, before it can be added to the STIP. CDOT cannot execute a project unless and until it is included in the STIP. Most importantly a project is not included in the STIP unless the funds necessary to complete that project are not reasonably expected to be available to construct it.
The STIP is the planning document that identifies the transportation projects CDOT intends to fund over a four year period. It is prepared in cooperation with local government entities throughout the State, including Transportation Planning Regions (TPRs) & Metropolitan Planning Organizations (MPOs). Projects included in the STIP must be consistent with corridor visions and strategies outlined in the long-range Regional and Statewide Transportation Plans.lxix
The development of these plans does more than simply aid in the prioritization of the state’s transportation projects and spending. It also is a methodical way to sum up where the system’s shortfalls are and to reasonably determine how great a short fall exists between available revenues and desired outcomes.
Appendix III – Past Efforts to Address the Surface Transportation Problem
Governor Ritter’s Transportation Finance and Implementation Panel
The opening sentence of this paper, referred to the current state of Colorado’s roads as an “unquiet” crisis. This is an unquiet crisis because the facts outlined above are no secret and discussions about what to do about the state of our roads has raged for years. In particular a bit more than a decade ago, then Governor Ritter commissioned a “Colorado Finance and Implementation Panel to consider the deficiencies in the system, evaluate those needs, and to then recommend some possible means to address them. Chief of among the issues identified by the panel was not a failed system of planning and constructing or maintaining infrastructure but a fundamental lack of the resources to maintain, let alone upgrade the system. As the panel noted in its final report.lxx
State motor fuel taxes – 22 cents per gallon on gasoline and 20.5 cents per gallon on diesel – are the primary funding source for Colorado’s roads, along with federal motor fuel taxes. A mid-size car (Toyota Camry or Ford Taurus) driven 15,000 miles annually pays about $132 in state gas taxes and $110 in federal gas taxes a year. Motor fuel tax revenue depends on the number of gallons sold, not the sale price. Despite the fact that Coloradans are driving more than ever, the increasing fuel efficiency of motor vehicles has led to a decline in the rate of growth of motor fuel tax collections, slowing the growth of transportation funding. Compounding this effect is the fact that the last gas tax increase in Colorado happened 17 years ago.
FASTER
Today, the fact is that not all that much has changed since the panel published its report in January 2008. The state motor fuel tax was last adjusted in 1991 and the Federal motor fuel tax in 1993. The one significant outcome for transportation revenue of the Transportation Finance Implementation Panel was the passage of the “FASTER” bill (SB09-108) which implemented a pair of annual fees collected as part of the annual vehicle registration process.
The first of these is the “FASTER Safety Fee and the second is the Bridge Safety Fee. Together these two fees have increased funding by about $200 million annually. Although this represents a material additional resource, it does not come close to fully compensating for the impact of inflation or improved vehicle fuel efficiency on the state’s transportation improvement purchasing power. The FASTER fees are partially shared with local governments but the majority flow to the Colorado Department of Transportation, while a significant portion of the state’s motor fuel tax revenue is also allocated to counties and municipalities to assist them in maintain their portions of the state’s roadways.
The figure below shows overall state transportation revenues from 2001-2017.lxxi Although the totals and sources can vary considerably from year to year, the section labeled for the state’s Highway User’s Tax Fund only shows a significant uptick starting with the 2009-10 bar when the FASTER fees were implemented, and the Federal one only in the 2008-09 bar when the state received American Recovery and Reinvestment Act dollars. In some other years, 2006-2008 and 2016-2018 and 2019, the department has received some significant additional funds via the appropriation of state General Fund revenues, but these transfers have frequently changed in size and in some instances are cancelled which makes long term planning or reliance upon their receipt difficult. Even if these annual transfers were less variable, they are insufficient to make up the loss in purchasing power that has occurred since the last tax increases were implemented in the early 1990s.
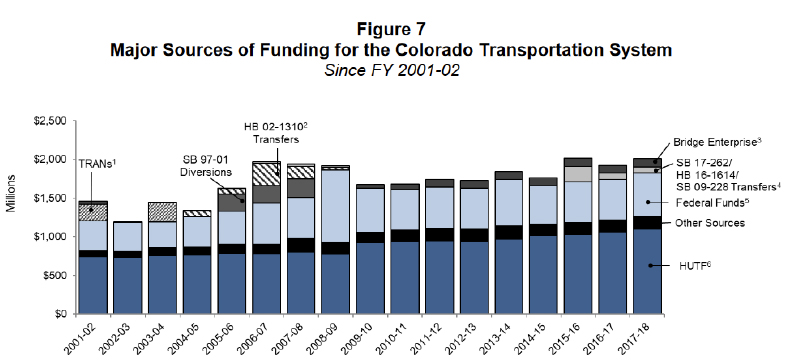
Appendix IV – The General Assembly’s Efforts to Address Transportation Funding since FASTER
Since the passage of FASTER, the General Assembly has considered numerous bills to appropriate General Fund dollars for transportation. The most notable bills enacted to do so are.
SB09-228
This bill, enacted during the Great Recession, repealed the limit on annual growth in General Fund appropriations to allow programmatic expenditures to rebound from recession-era cuts. SB 09-228 eliminated the budget architecture in which the two older funding mechanisms had been established. SB 97-1 and HB 02-1310 diverted and transferred, respectively, General Fund revenue only when economic growth was sufficient to fund the maximum permitted amount of General Fund expenditures. When the limit was removed, the General Assembly chose to increase appropriations at a level that would have otherwise exceeded the growth limit.
SB 09-228 also included a five-year block of General Fund transfers to transportation and capital construction, scheduled to occur when economic indicators showed a recovering economy, as measured by at least 5 percent growth in personal income earned by Colorado residents. The growth trigger was satisfied in 2014, and transfers occurred in FY 2015-16, FY 2016-17, and FY 2017-18 under House Bill 16-1416 and Senate Bill 17-262. The final two years of transfers were repealed under Senate Bill 17-267.
SB 17-267
This bill requires the execution of lease-purchase agreements on state buildings over four fiscal years beginning in FY 2018-19 and ending in FY 2021-22. In each year, the State Treasurer is required to identify and sell buildings with a value of $500 million, for a total of $2 billion over the four-year period. Under the terms of the lease-purchase agreement, the purchaser of the buildings agrees to lease the buildings back to the state for a 20-year period. Provided that the state makes annual lease payments, the state resumes ownership of the buildings upon completion of the 20-year term.
SB 17-267 is expected to generate $1.88 billion for transportation projects over the four-year execution period, including $380 million in FY 2018-19 and $500 million in each of the subsequent fiscal years. These amounts are credited to the SHF and available for expenditure on construction projects in the Strategic Transportation Project Investment Program as selected by the Transportation Commission, with the requirement that 25 percent of revenue be spent in counties with populations of less than 50,000. The remaining $120 million in FY 2018-19 is dedicated for non-transportation capital construction and controlled maintenance projects.
Lease payments are expected to be $37.5 million per tranche per year, or $3 billion for all four tranches over the terms of all leases. When lease-purchase agreements have been executed on all four tranches, the annual lease payment is expected to total $150 million.
Lease payments are made as follows:
- first, $9 million from the General Fund, corresponding to the capital construction share;
- next, $50 million from the SHF; and
- any remaining amount, expected to be $91 million, from the General Fund.
As originally written, the $91 million annual General Fund contribution will appear in budget documents as an expenditure in the Department of the Treasury for lease payments. This cost is for the payment of leases on state assets that were sold in order to generate transportation project funding during the four-year period. In the recent legislative session, the costs that would have been borne by the General Fund were shifted to CDOT for two fiscal years.
Senate Bill 18-001
SB 18-001 authorized two years of General Fund transfers for transportation. In FY 2018-19, a total of $495 million was transferred as follows:
- $346.5 million to the SHF;
- $74.25 million to the HUTF, for allocation in equal shares to counties and municipalities; and
- $74.25 million to the Multimodal Transportation Options Fund, a newly created cash fund to support grants for local multimodal transportation projects.
In FY 2019-20, a total of $150 million is scheduled to be transferred as follows:
- $105.0 million to the SHF;
- $22.5 million to the HUTF, for allocation in equal shares to counties and municipalities; and
- $22.5 million to the Multimodal Transportation Options Fund.
SB 18-001 also referred a ballot measure to voters at the statewide election in November 2019, Proposition CC. Proposition CC was not approved by Colorado’s voters. Proposition CC would have replaced the last three years of lease-purchase agreements scheduled under SB 17-267. Since the ballot measure was not approved, the bill originally transfered $50 million annually from the General Fund to the SHF for 20 years beginning in FY 2019-20, such that the lease payment obligation under SB 17-267 is effectively paid entirely from General Fund revenue. In the recent legislative session, this transfer was paused. The table below prepared by the Colorado Legislative Council Staff shows General Fund contributions to transportation for most of the last three decades.lxxii
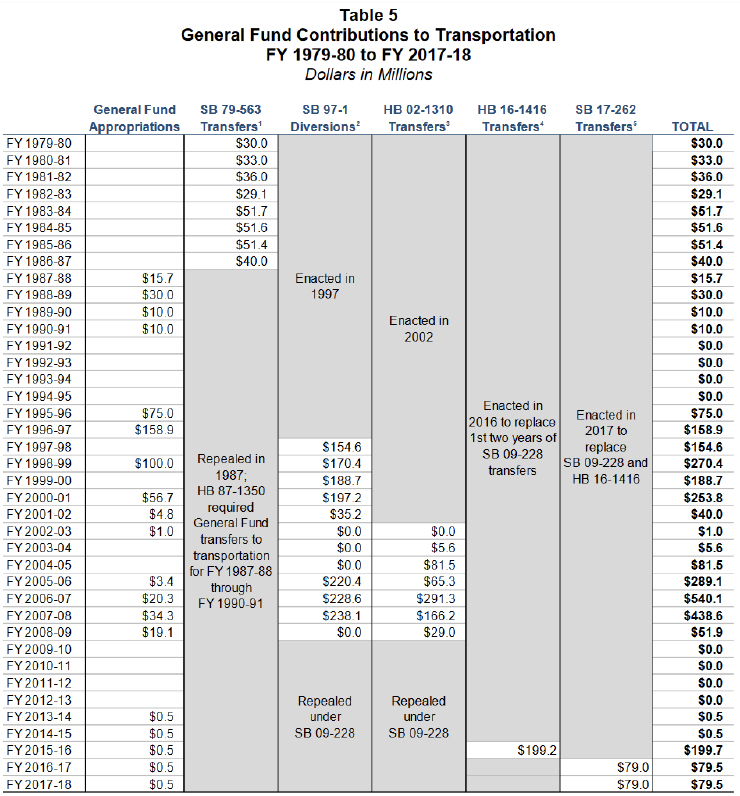
Chart Source: Colorado Legislative Council Staff
Appendix V – Transportation Funding Questions at the Ballot Box
During the 2018 election cycle, the project lists developed through the state’s planning processes became a prominent feature in the campaign for Proposition 110. Proposition 110 was a ballot measure to increase the statewide sales tax by .62% and to dedicate the use of those funds to addressing a specific list of projects and programs.lxxiii
Out of the total revenues this sales tax would have raised, 45% were dedicated to advancing the projects CDOT identified, with 20% going respectively to the state’s counties and cities and 15% to transit pedestrian, and bicycle projects. The voters of Colorado defeated Proposition 110 with the noes garnering about 59% of the votes cast.lxxiv
The 2018 ballot also included another potential transportation measure, Proposition 109. Unlike Proposition 110, Proposition 109 did not include any provision to increase overall transportation funding. Rather was to direct Colorado to issue $3.5 billion in bonds with the proceeds directed solely to CDOT for highway construction and reconstruction with repayment from existing state resources. Proposition 109 failed with almost 61% no ballots.lxxv These failed measures in 2018 when combined with the failure of Prop CC in 2019, the legislatively referred measure noted earlier, make it fairly safe to assume that existing trends will not change. This means that the near to mid-term prospects for a permanent resolution to the outdated and unsustainable funding structure for Colorado’s transportation system ranges from poor to grim. Increased demand and insufficient funds to fully maintain existing assets are not a recipe for success.
Appendix VI – $3.2 Billion Project list
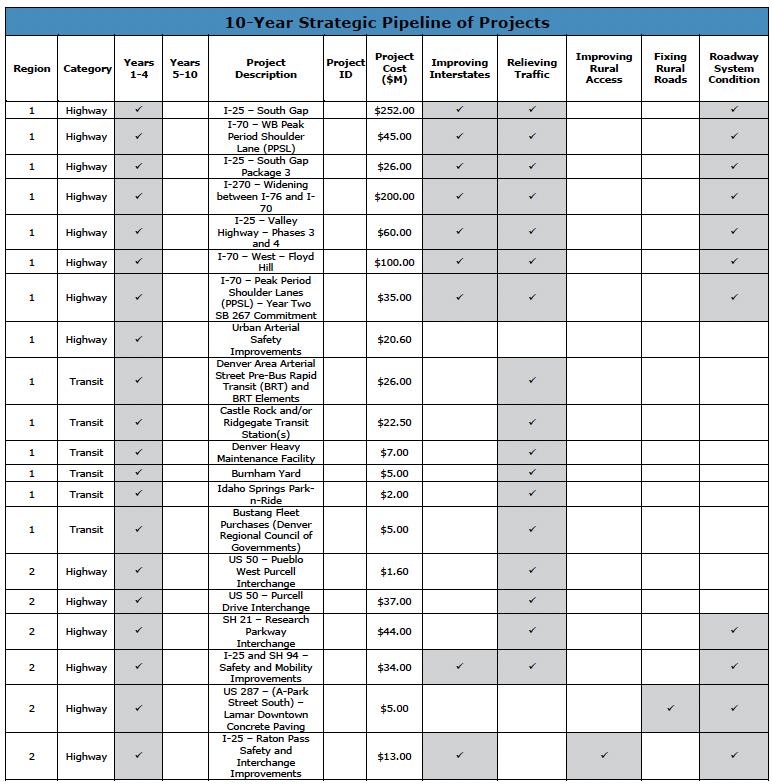
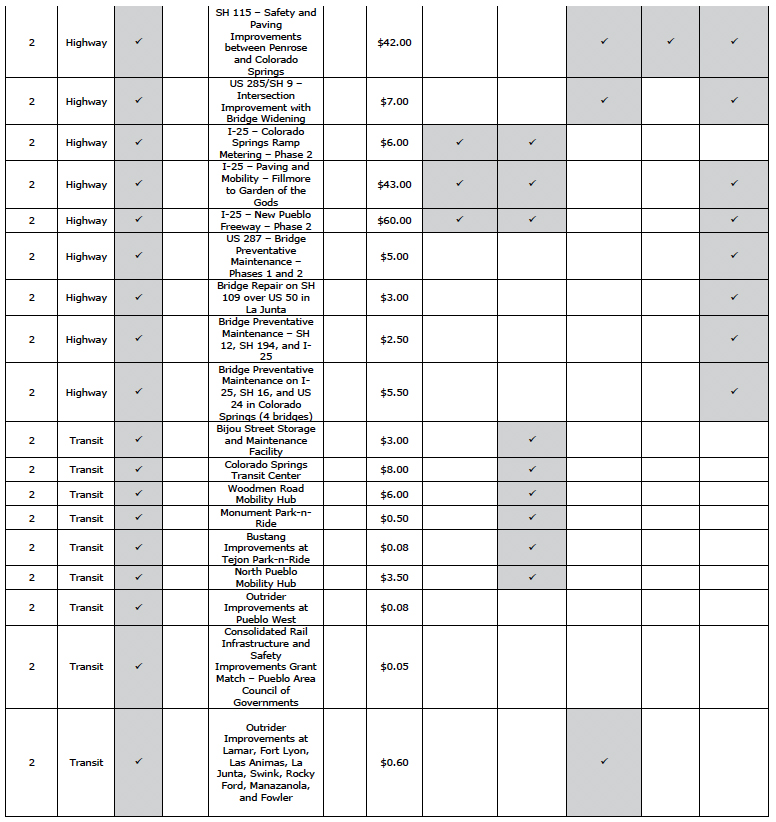
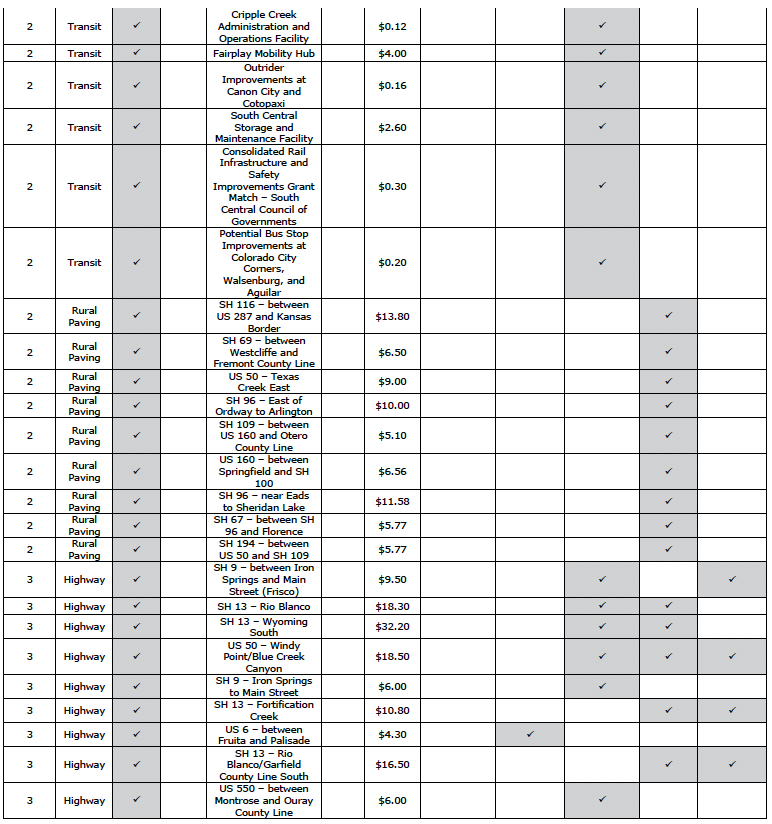
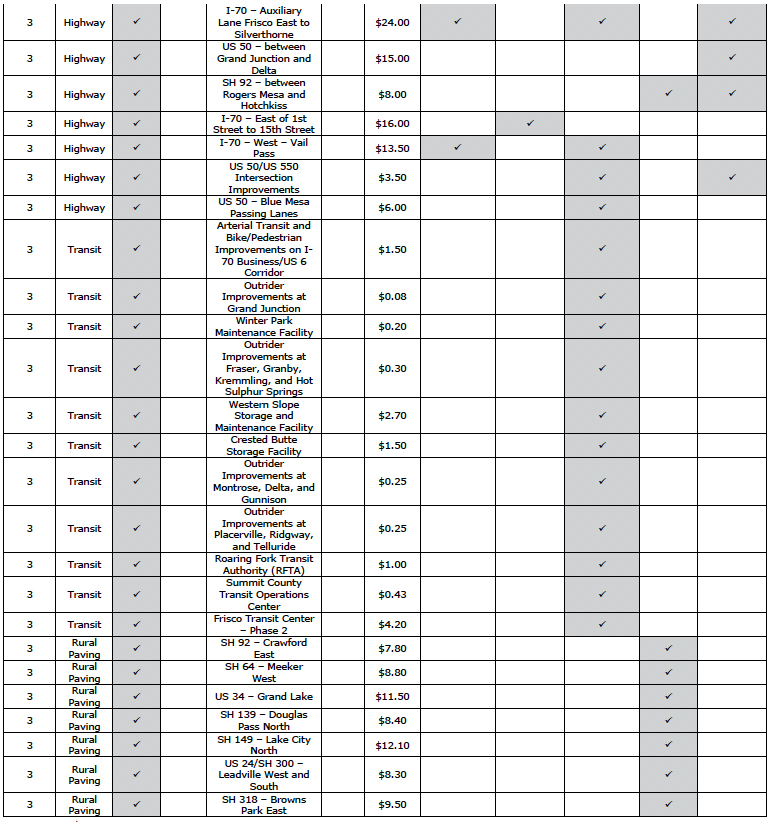
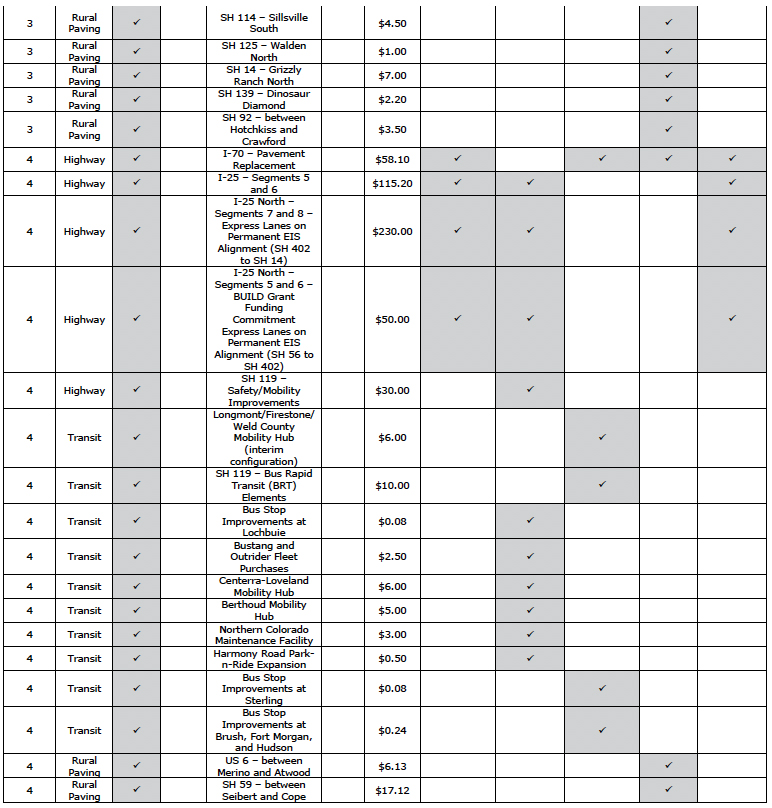
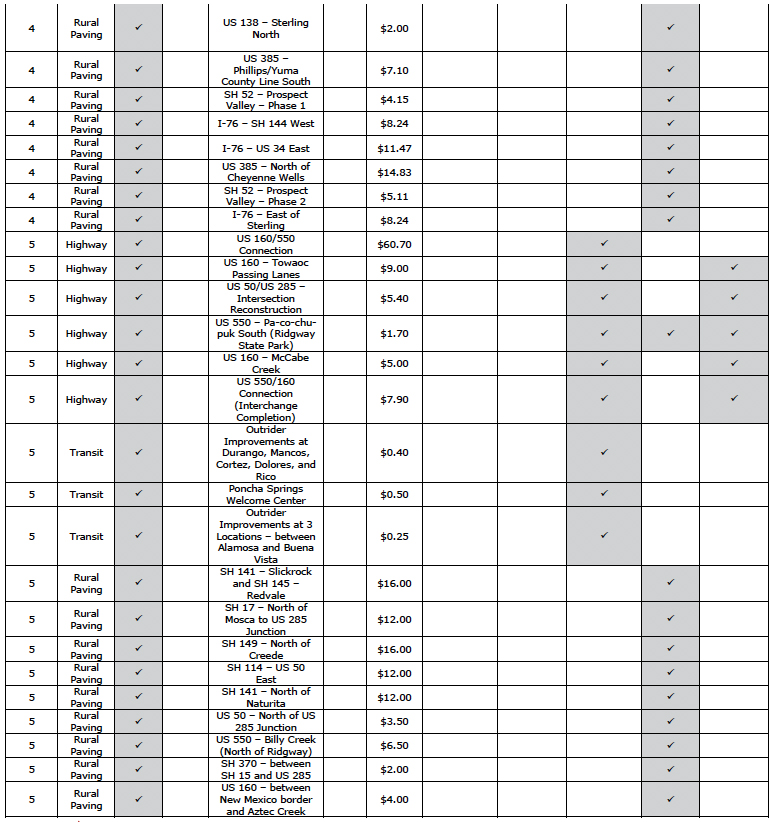
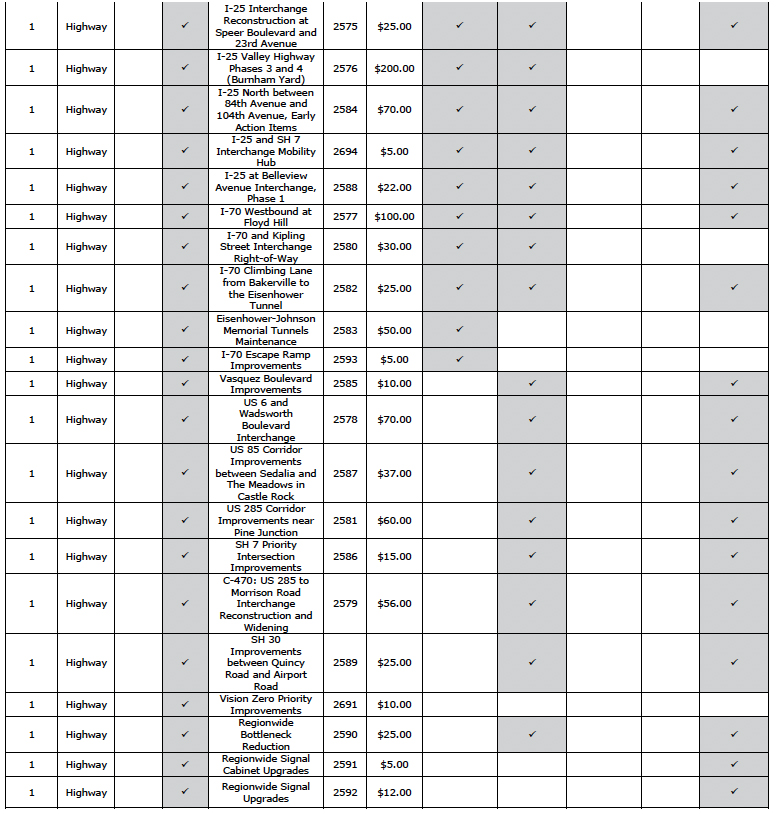
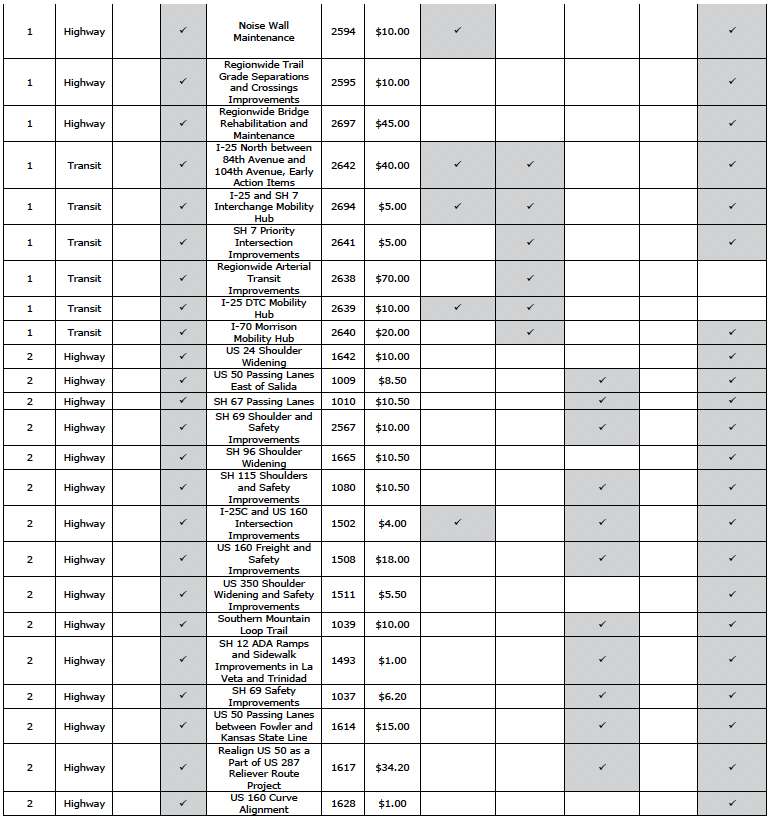
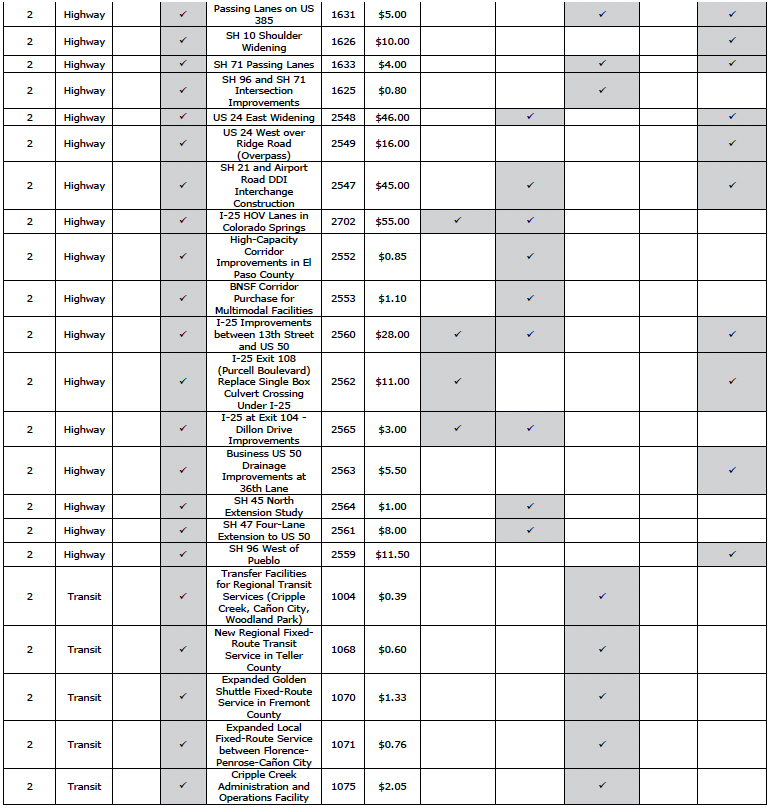
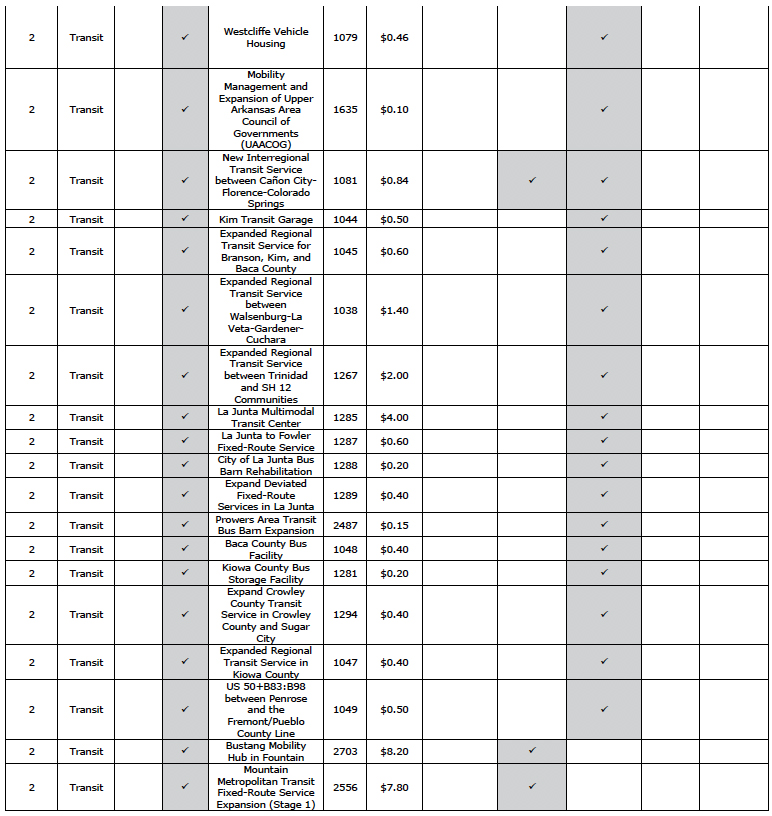
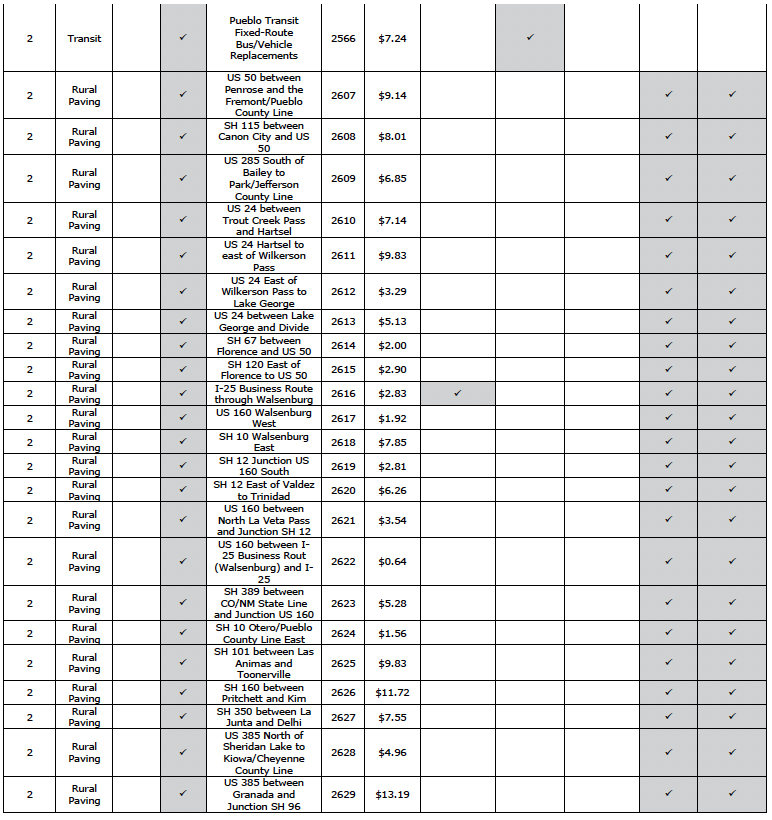
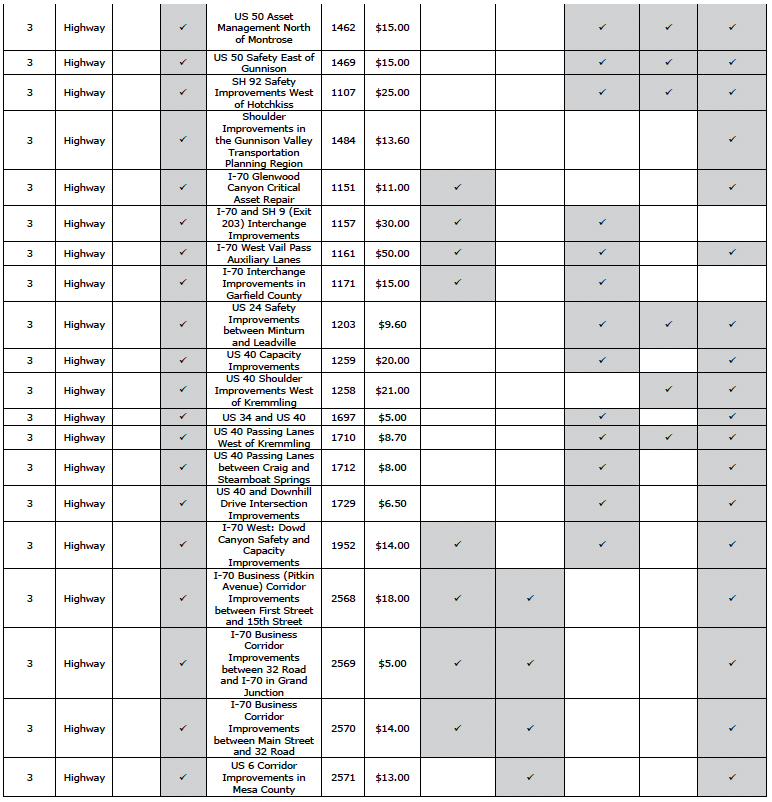
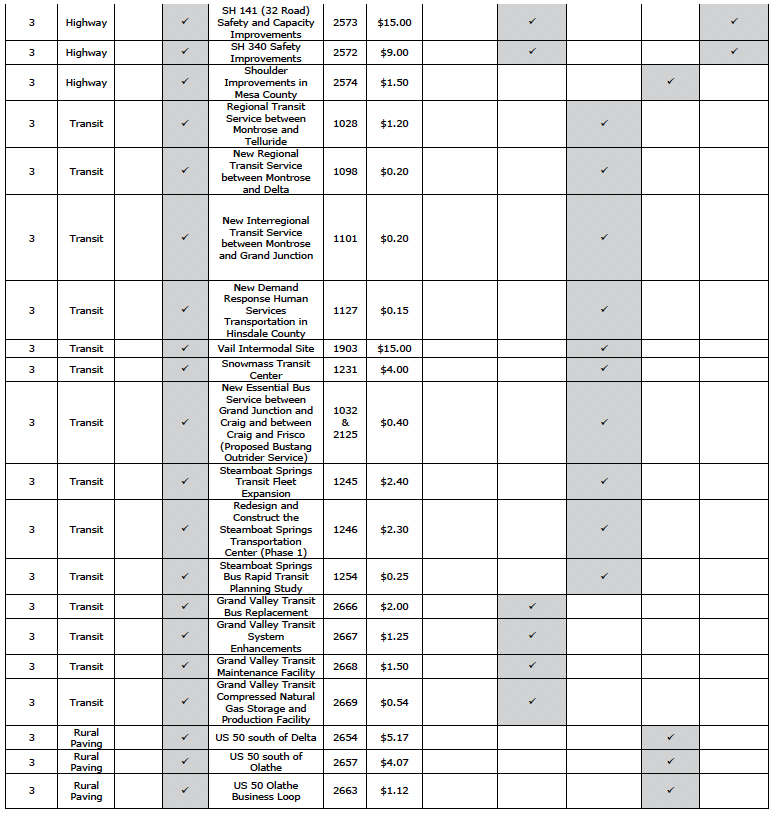
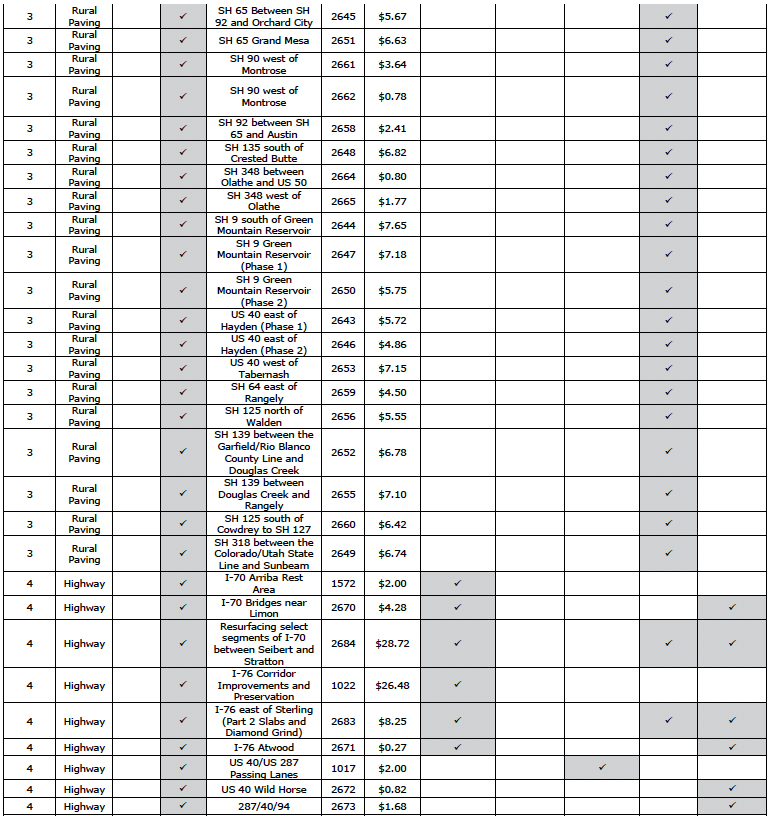
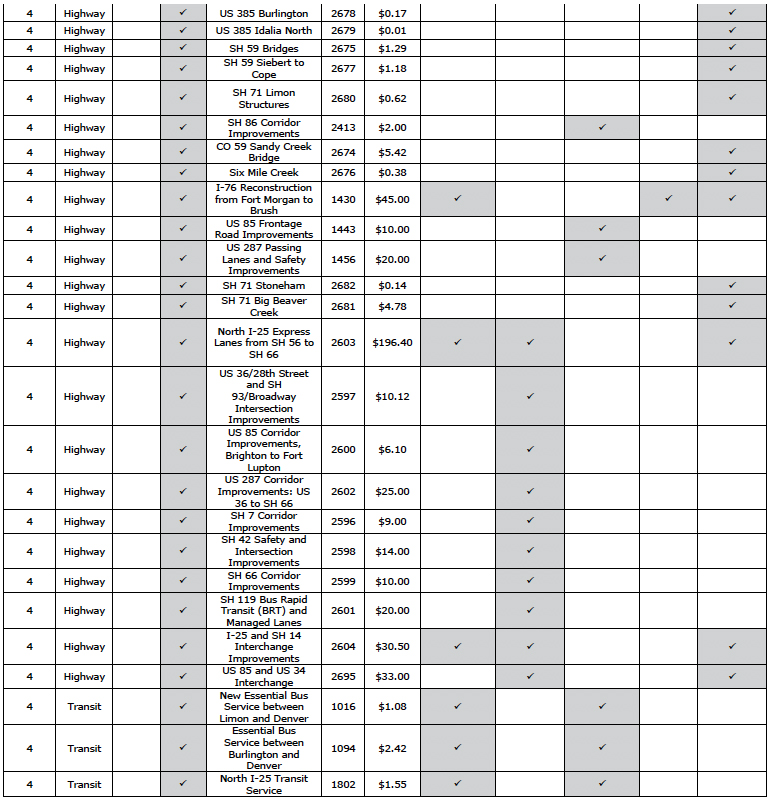
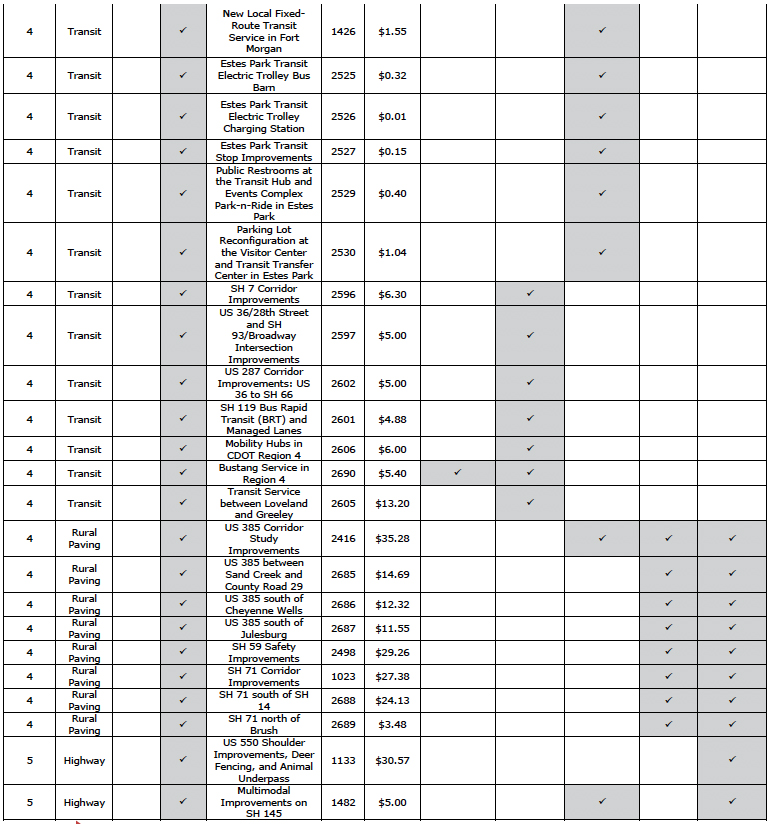
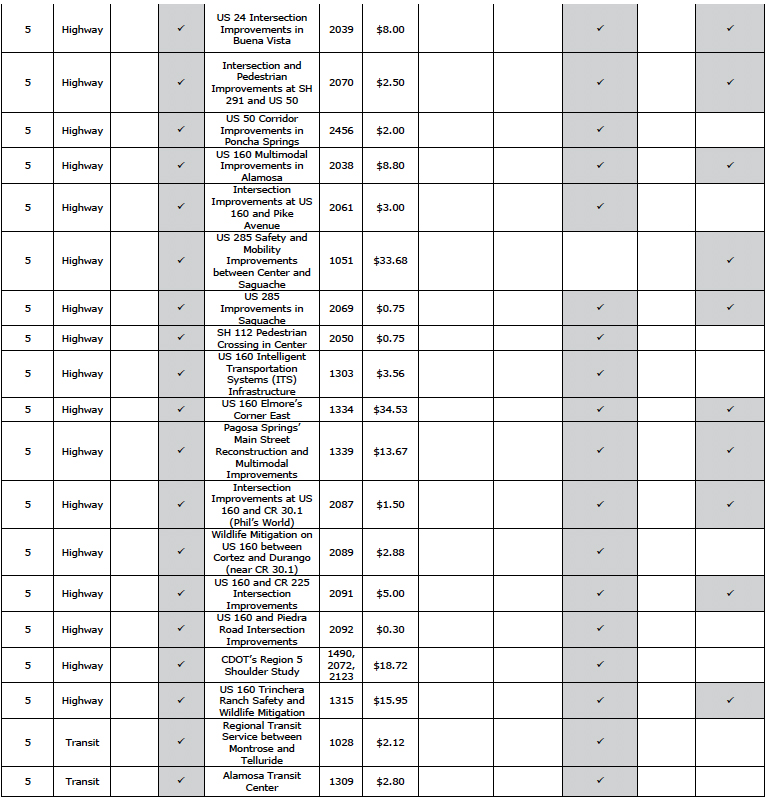
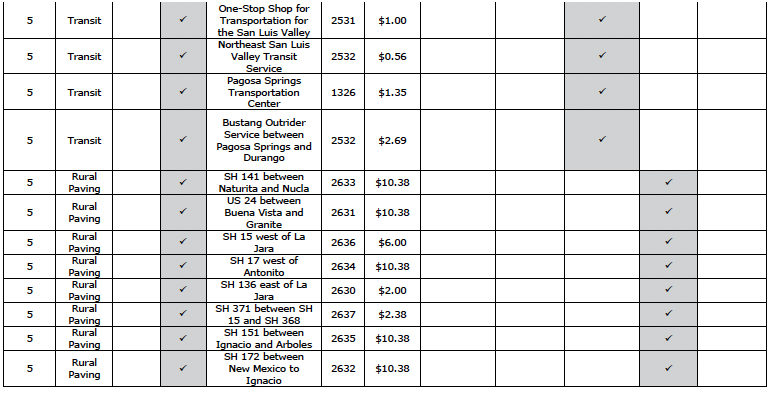
i U.S. Department of Transportation, Federal Highway Administration, National Highway Construction Cost Index, available at www.fhwa.dot.gov/policyinformation/nhcci.cfm as of April 2019
ii https://drive.google.com/file/d/18GVnYxRfpfIIKMmavlmJOPsQxA93sW6I/view
iii CLCS Issue Brief Jan 2017
iv https://www.wsj.com/articles/americas-love-affair-with-driving-takes-a-back-seat-11577183402?mod=hp_lead_pos5
v https://www.nbcnews.com/mach/science/ride-sharing-firms-say-they-help-ease-traffic-congestion-new-ncna1003051
vi https://www.nbcnews.com/mach/science/ride-sharing-firms-say-they-help-ease-traffic-congestion-new-ncna1003051
vii EXCESSIVE TRUCK WEIGHT: An Expensive Burden We Can No Longer Support: GAO 79-94
viii https://www.cbo.gov/publication/50049
ix https://www.codot.gov/programs/planning/transportation-plans-and-studies/documents/march-2019-colorado-freight-plan.pdf
x https://www.codot.gov/about/CDOTHistory/50th-anniversary/interstate-25
xi U.S. Department of Transportation, Federal Highway Administration, National Highway Construction Cost Index, available at www.fhwa.dot.gov/policyinformation/nhcci.cfm as of April 2019
xii https://www.pothole.info/2014/12/freeze-thaw-cycles-expansions-and-contractions-cause-potholes
xiii https://www.codot.gov/travel/winter-driving/faqs.html#potholes
xiv https://www.pothole.info/2017/01/do-salt-and-snowplows-cause-potholes/
xv https://www.codot.gov/projects/i-225-resurface-i-25-parker-road
xvi https://www.codot.gov/projects/i70east/updated-fact-sheets-2019/funding-fact-sheet-11-4-19-eng.pdf
xvii https://www.codot.gov/projects/C470ExpressLanes/overview
xviii https://www.5280.com/2019/06/navigating-central-70-what-you-need-to-know-about-the-1-3-billion-project/
xix https://reason.org/policy-study/24th-annual-highway-report/colorado/
xx https://www.usatoday.com/story/money/2019/01/31/population-growth-rate-fastest-growing-shrinking-states/38918791/
xxi https://www.codot.gov/programs/colorado-transportation-matters/your-transportation-plan/assets/congestion-and-modeling-6-11-19.pdf
xxiii https://www.rtd-denver.com/who-we-are
xxiii https://www.rtd-denver.com/reports-and-policies/facts-figures
xxiv https://www.denverpost.com/2019/11/27/rtd-general-manager-future
xxv https://www.denvergov.org/content/dam/denvergov/Portals/Denveright/documents/transit/Denver-Moves-Transit-Plan-2019.pdf
xxvi https://pagetwo.completecolorado.com/2017/11/18/metro-denvers-coming-transit-apocalypse/
xxvii https://www.rtd-denver.com/sites/default/files/files/2020-07/2019_RTD-Comprehensive-Annual-Financial-Report_12-31-2019.pdf
xxviii http://rockymountainrail.org/RMRA_Final_Report.html
xxix https://www.codot.gov/programs/transitandrail/plans-studies-reports/statewidetransitplan/2018-colorado-freight-and-passenger-rail-plan.pdf
xxx https://cityroom.blogs.nytimes.com/2008/06/09/when-horses-posed-a-public-health-hazard/
xxxi https://www.denverpost.com/2018/05/02/amazon-aurora-fulfillment-center
xxxii https://www.bts.gov/content/motor-vehicle-fuel-consumption-and-travel
xxxiii https://www.statista.com/statistics/183505/number-of-vehicles-in-the-united-states-since-1990/
xxxiv https://itep.org/most-states-have-raised-gas-taxes-in-recent-years-0419/
xxxv https://www.wsj.com/articles/greener-roads-spell-a-decade-of-disruption-11577624407?mod=hp_listb_pos3
xxxvi https://www.wsj.com/articles/self-driving-cars-roll-up-slowly-11576439387?mod=searchresults&page=1&pos=1
xxxvii https://www.inc.com/tess-townsend/amazon-drone-prime-air-commercial.html
https://www.wsj.com/articles/will-flying-cars-be-safer-than-helicopters-11580474166
xxxviii https://www.vicroads.vic.gov.au/traffic-and-road-use/traffic-management/managed-motorways/managed-motorways-operations
xxxix https://www.its.dot.gov/cv_basics/cv_basics_20qs.htm
xl https://www.wsj.com/articles/cities-waive-bus-fares-in-bid-to-boost-ridership-11579007895?mod=hp_lead_pos5
xli https://www.investopedia.com/articles/pf/08/cost-car-ownership.asp
xlii https://en.wikipedia.org/wiki/History_of_the_electric_vehicle
xliii https://www.wsj.com/articles/gms-electric-ambitions-rattle-below-the-surface-of-the-uaw-strike-11569582003?mod=article_inline
xliv https://www.economicmodeling.com/2012/08/31/occupation-report-mechanics-2009-2012/
xlv https://www.wsj.com/articles/tesla-cuts-price-of-china-made-model-3-cars-11578057829?mod=searchresults&page=1&pos=2
xlvi https://www.wsj.com/articles/todays-logistics-report-amazon-plugging-in-shipbuilding-gassing-up-resetting-oil-tankers-11569003729?mod=searchresults&page=1&pos=9
xlvii https://www.wsj.com/articles/power-shift-why-2020-is-the-turning-point-for-electric-cars-11577458791
xlviii https://www.eia.gov/tools/faqs/faq.php?id=23&t=10
lxi https://www.fractracker.org/2014/09/truck-counts/
l https://interestingengineering.com/7-ways-electric-vehicles-are-set-to-change-the-future
li https://www.nytimes.com/2017/12/11/business/airports-ride-hailing-services.html
lii https://www.forbes.com/sites/greggardner/2019/12/17/tesla-gm-lose-bid-to-raise-ceiling-for-federal-ev-tax-credit/#7f3e40e4616f
liii https://www.inverse.com/innovation/hyperloop-now-has-a-path-to-reality-in-america
liv https://www.wsj.com/articles/house-passes-1-5-trillion-infrastructure-bill-11593638962
lv https://www.9news.com/article/news/health/coronavirus/rtd-considers-coronavirus-cuts/73-4dbc8e2a-cc38-4769-bf63-ed757c97ebbd
lvi https://wp-cpr.s3.amazonaws.com/uploads/2020/04/cdot-covid-funding.pdf
lvii https://wp-cpr.s3.amazonaws.com/uploads/2020/04/cdot-covid-funding.pdf
lviii https://www.codot.gov/programs/planning/documents/resources/econbenefit2.pdf
lix 2020-02%20Economic%20Impact%20Report_0[1].pdf
lx https://www.codot.gov/programs/planning/documents/resources/freight/colorado-statewide-highway-freight-plan-october-2018/view
lxi https://www.aspentimes.com/news/rfta-tax-favored-with-608-vote-buffer-with-final-votes-to-tally/
lxii https://www.rtd-denver.com/sites/default/files/files/2019-07/rtd-adopted-budget-2019.pdf
lxiii https://www.codot.gov/programs/planning/documents/resources/freight/colorado-statewide-highway-freight-plan-october-2018/view
lxiv https://drive.google.com/file/d/1UW1QpouZa2eOmQcqS_kqFAz5qvuOfSu3/view
lxv https://www.sos.state.co.us/pubs/elections/Results/Archives.html
lxvi https://www.codot.gov/programs/ruc/documents/rucpp-final-report
lxvii https://www.codot.gov/programs/planning/planning-partners
lxviii https://www.codot.gov/programs/planning/transportation-plans-and-studies/statewide-transportation-plan
lxix https://www.codot.gov/business/budget/statewide-transportation-improvement-program-stip-reports-information
lxx https://www.yumpu.com/en/document/read/33916912/colorado-transportation-finance-and-implementation-panel.pdf
lxxi https://leg.colorado.gov/sites/default/files/colorado_transportation_handbook_11132018_1.pdf
lxxii https://leg.colorado.gov/sites/default/files/colorado_transportation_handbook_11132018_1.pdf
lxxiii https://www.codot.gov/programs/planning/documents/plans-projects-reports/projects/dev-prgm/project-list-for-new-revenue-sources2010-adopted-july-19-2018
lxxivhttps://ballotpedia.org/Colorado_Proposition_110,_%22Let%27s_Go_Colorado%22_Transportation_Bond_and_Sales_Tax_Increase_Initiative_(2018)
lxxvhttps://ballotpedia.org/Colorado_Proposition_109,_%22Fix_Our_Damn_Roads%22_Transportation_Bond_Initiative_(2018)