

Key Findings
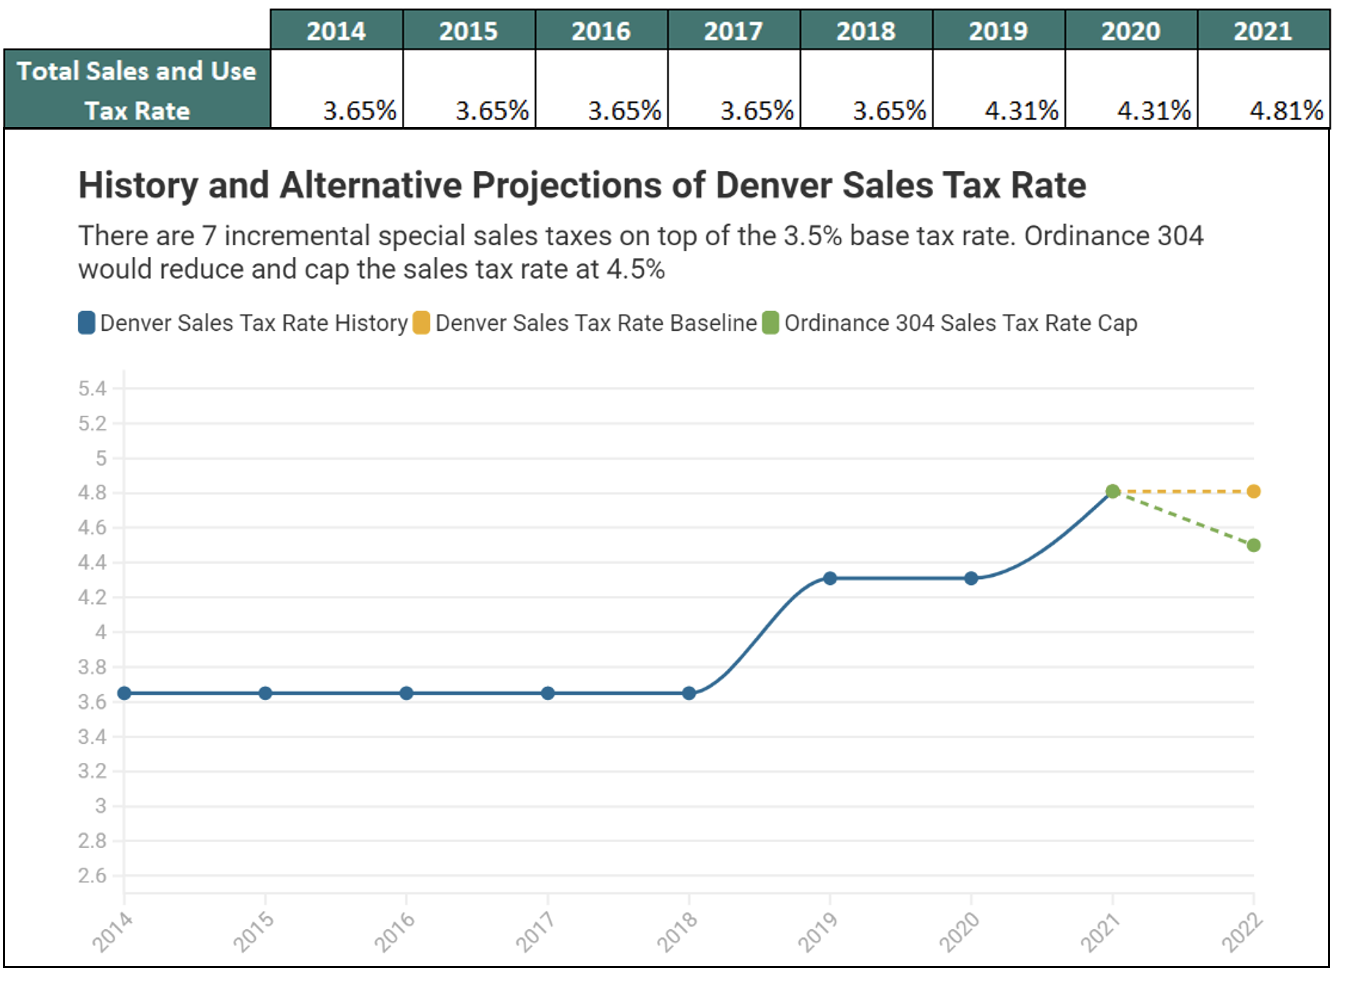
- Ordinance 304 or the “Enough Taxes Already” ballot initiative proposes to cut the city’s sales tax from 4.81% to 4.50% and impose a cap at the latter rate.
- Between 2019 and 2021 the city sales tax rate increased from 3.65% to 4.81% as a result of six new sales tax measures.
- Under a baseline scenario, if the sales and use tax rate were lowered from 4.81% to 4.50% in 2022, total collections would be cut $69.2 million or 6.4%. However, revenue would decline only 0.5% from 2021 to 2022 and still be 12.1% above the 2019 level.
- Actual household savings will vary but for every $10,000 in taxable sales, a household would save $31 under the lower 4.50% capped rate relative to current 4.81% rate. Assuming Colorado households pay 58% of all sales taxes, Denver households would save approximately $120 annually, on average.
Denver Has Significantly Expanded Sales Tax Programs Since 2018
 Last November, Denver voters approved two incremental city sales tax increases. Implemented in January 2021, both measures raised the local sales tax rate quarter of a percent each to fund the city’s Homelessness Resolution Fund and its Climate Protection Fund, increasing the local rate from 4.31% to 4.81%. This is the seventh sales and use tax rate increase approved by voters since 2011 – six having emerged since 2018 – raising the city sales tax rate by 1.31% on top of its 3.5% base. The 2.9% state sales tax and a 1% RTD tax are on top of this rate. The incremental rate components to Denver’s sales tax across most taxable items are shown in Figures 1 and 3.
Rather than face another sales tax rate increase this fall, Denver voters will face a new ballot initiative to address these hikes.
Ordinance 304, monikered “Enough Taxes Already,” asks voters if they want to reduce the sales and use tax rate from 4.81% to 4.5% and subsequently impose a cap at this rate. If voters approve another sales tax rate increase in the future, Denver city council would be required to reduce the other sales tax rates to remain under the overall cap[i].
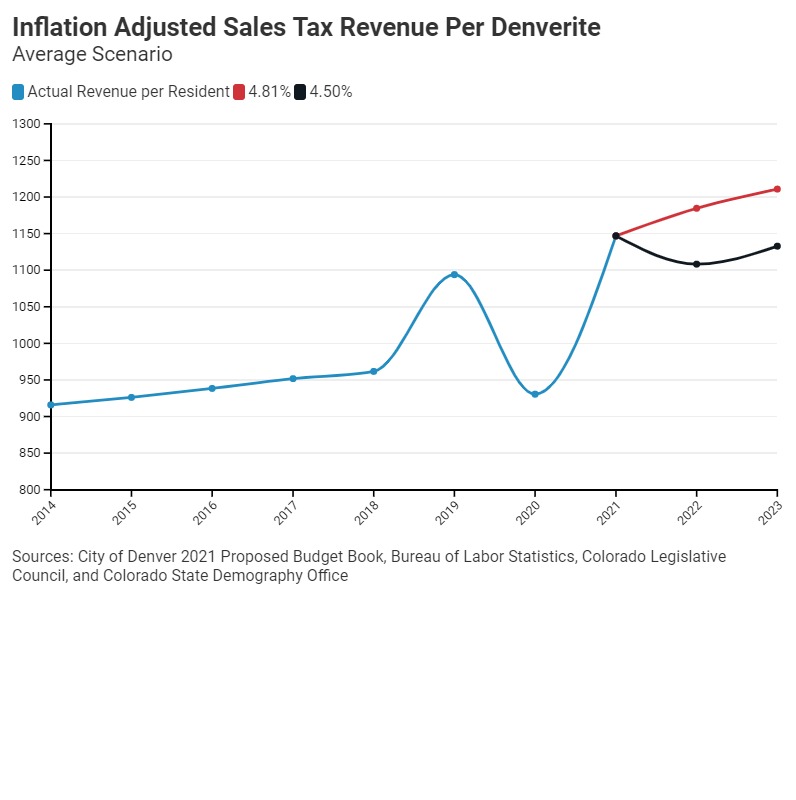
Total sales and use tax revenue to the City and County of Denver grew from $608 million in 2014 to $895.5 million in 2019, for a compound annual growth rate (CAGR) of 8% over 5 years. Year-over-year growth peaked in 2019 at 17.7%; the strong growth being primarily driven by the additional voter approved tax rate increases and expansion of new sales tax funded programs. However, this growth was halted by the COVID-19 pandemic in 2020 when collections fell by 12.3% to an estimated $785.8 million[ii]. In 2014, total sales and use tax revenue per Denverite was $915.90. That number grew to $1,093.94 by 2019 (adjusted for inflation), then sank dramatically by 14.9% to $950.53 in 2020. Looking ahead, under an average scenario and a sales tax rate of 4.81%, revenue per resident is forecasted to rebound to $1,146.89 in 2021. Under a sales tax rate of 4.5% the inflation adjusted revenue per resident drops to $1,133 by 2023.
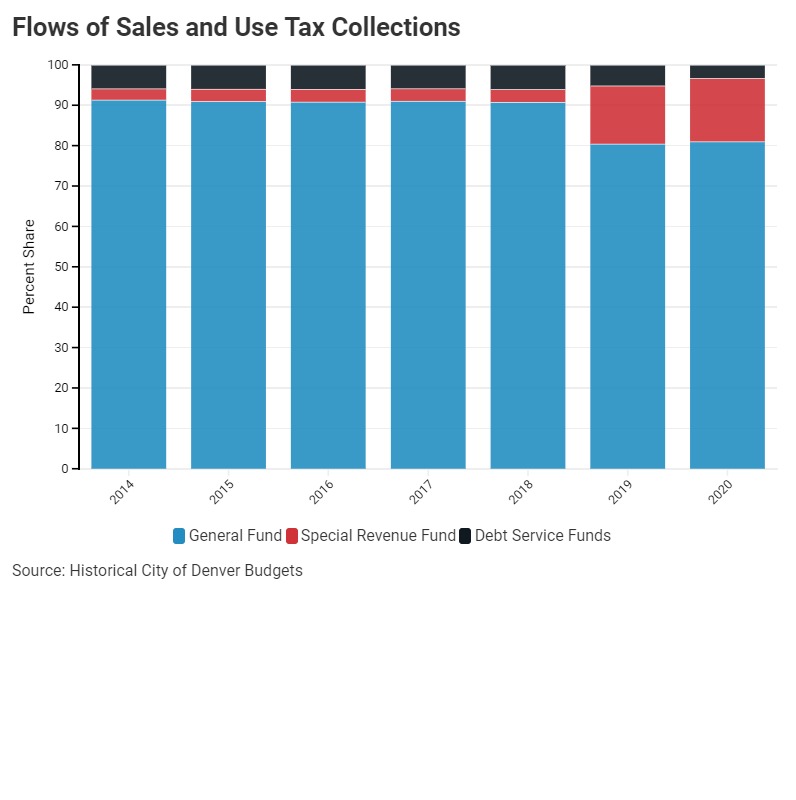
The General Fund is the largest share (37%) of the city budget and is the most flexible governmental fund, financing everything from public safety to infrastructure to parks and recreation. Around 80% of all sales tax collections flow to the General Fund. This constitutes the largest single revenue source and 55% of the City and County of Denver’s General Fund revenue.
Sales and use taxes also contribute to the Special Revenue Fund. This fund includes the voter approved programs backed by the incremental sales tax increases seen over the past few years. Before 2019, this fund accounted for roughly 3% of total sales and use tax collections, however the share increased to nearly 15% of total collections in 2020 after recent voter-approved measures, as seen in Figures 2 and 4.
Figure 2
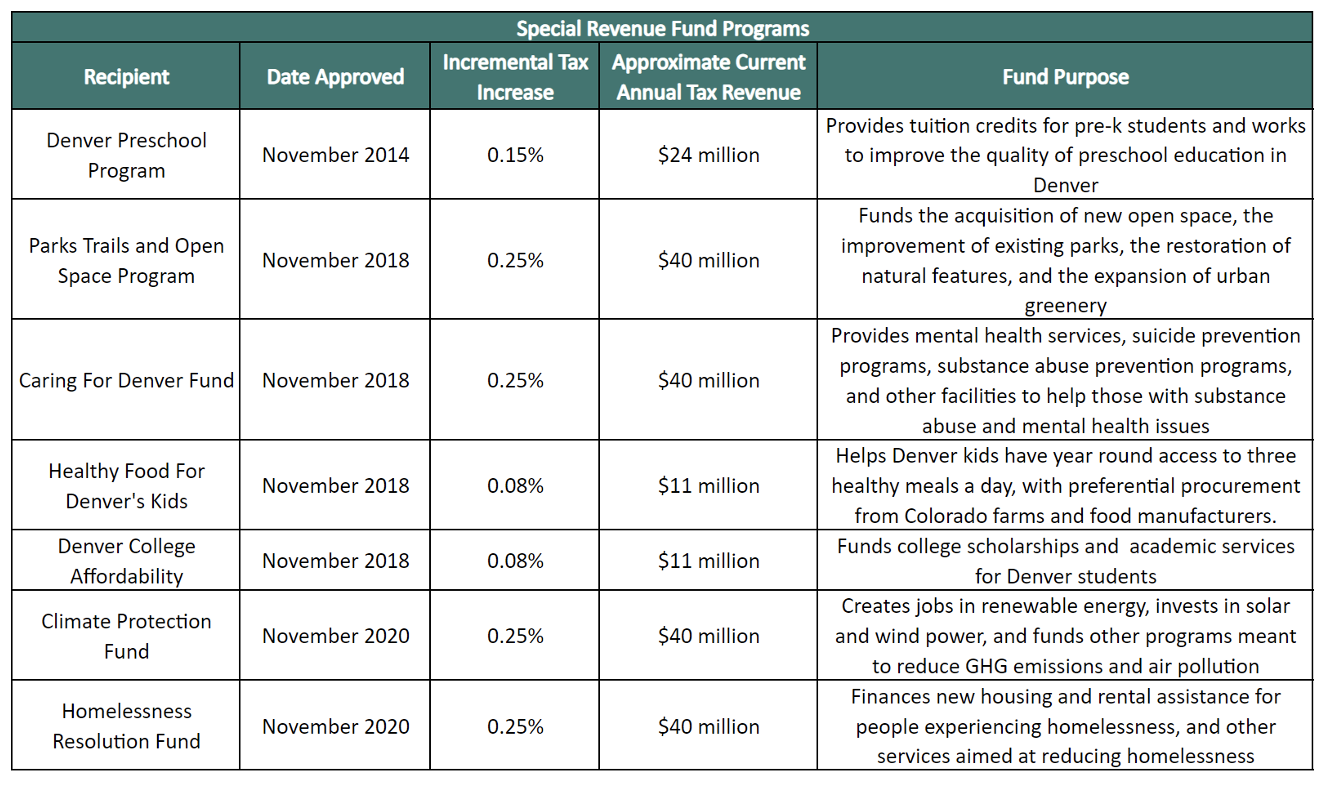
Figure 3
In addition, a marginal amount of sales tax collections goes to the Debt Service Funds. The sales and use tax is specifically used to back Excise Tax Revenue Bonds, which finance projects like the expansion improvements to the Colorado Convention Center and funding for the National Western Center. Debt Service revenue, however, is a relatively small chunk of sales tax collections, only accounting for approximately 5% of the total.
Figure 4
 A range of estimates of the impact to revenue can be derived from forecasted growth rates between 2021 to 2025 published in the City of Denver’s proposed 2021 budget[iii]. Under the 2022 average scenario, sales tax revenue would be $69.2 million lower if sales and use taxes are cut from 4.81% to 4.5%, or 6.44% below current projections. Across the three scenarios, pessimistic, average and optimistic, the average annual revenue reduction is between $74.1 million and $75.8 million.
It’s important to note that in all scenarios nominal sales tax revenue should rebound past pre-pandemic levels this year due to the economic recovery and the additional 0.5% increment flowing to the Special Revenue Fund. Furthermore, even if sales taxes are cut 0.31% next year, collections will decline only slightly for all scenarios in 2022 then return to projected growth rates, albeit at a lower revenue level. However, if you adjust for population and inflation, revenue per Denverite falls 3.4% from 2021 to 2022 under the average scenario.
In theory, sales tax should arguably only affect final goods sold to avoid taxing business inputs, however, evidence shows that business purchases of intermediate inputs are frequently not exempt. A 2017 Ernst & Young study found that 42% of state and local sales tax in Colorado is paid by businesses.[iv] If we assume Denver households make up 58% of the sales tax base it would mean the average Denver household would expect to save $120.03 annually[v]. However, actual savings will vary widely based on the actual amount of taxable spending of each household. For every $10,000 in taxable consumption, a household would save $31.
Figure 5
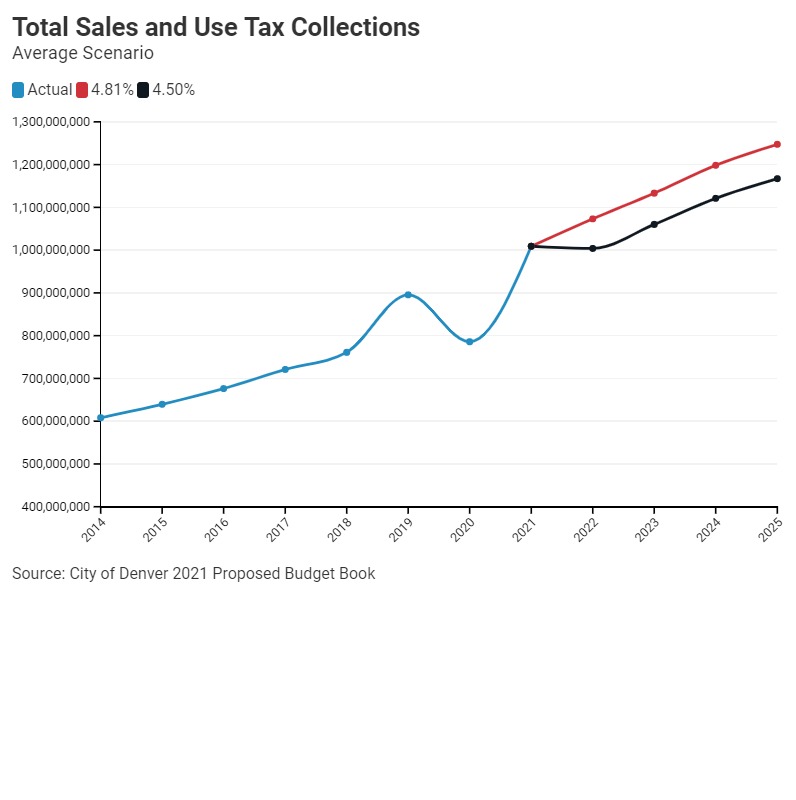
Figure 6
The Future of Voter-Backed Programs Would be in the Hands of the City Council
While “Enough Taxes Already” is partly a straightforward tax rate reduction, there are important nuances to consider if the Ordinance 304 passes, particularly in the event of a future tax increase. If voters were to approve a new sales tax in the future, then either another measure would have to also specify how to cut sales tax rates elsewhere in order to comply with the rate cap or Denver city councilmembers would have discretion over how to maintain the overall rate cap of 4.5%. The reason that tax rate cut would need to be specified in a separate ballot measure is due to the single subject requirements of ballot measures.
For example, if a new incremental sales tax increase of 0.25% is passed in 2023, similar to the climate or homelessness programs passed last year, and the means to reducing other taxes to remain under the 4.5% cap, Denver city council could likely do any of the following:
- Evenly cut each existing program by a dollar amount – which would be more punitive to smaller programs
- Proportionally cut each program by a given percentage
- Cut the base rate, thereby preserving the voter backed programs but reducing revenue to the General Fund
- Pick and choose programs to cut based on performance, which would require more thorough documentation on metrics that are not always measurable
- OR a combination of any of these strategies
Revenue Estimate Methodology
There were two major processes in forming the numbers behind this report: creating the scenario forecasts and estimating sales tax revenue per Denverite.
The first step in projecting the three scenarios was extracting Denver’s General, Special, and Debt Service fund revenue found in both the historic budgets documents and Comprehensive Annual Financial Reports (CAFRs). Not only does the city provide current estimates for these numbers, but they provide pessimistic and optimistic growth rates from 2021 through 2025 for sales tax revenue to the General Fund. An average scenario was calculated by taking the average growth rates of the pessimistic and optimistic forecasts. These growth rates were used to forecast General Fund revenue to 2025, using the assumption that the sum of special revenue and debt revenue, in proportion to general fund revenue would remain constant. The General Fund grew by that proportion to estimate total sales and use tax revenue. However, since the increase from 4.31% to 4.81% was passed just after the release of the proposed 2021 budget, it was necessary to revise these forecasts upwards by the percent increase in the tax rate (i.e., ). Finally, to estimate the potential 2022 tax cut, if the proposed “Enough Taxes Already” measure passes, the forecasts from 2022 – 2025 were multiplied by the percent decrease in the tax rate (i.e., ). The data produced from these calculations was then used to analyze the fiscal impacts of the tax cut.
In calculating the inflation adjusted revenue per Denverite, historic sales tax revenue was extracted from Denver’s budgets to estimate. To adjust for inflation, the Consumer Price Index (CPI) is used to convert nominal dollars into dollars that are “chained” to a chosen base year. In this case, the Denver-Aurora-Lakewood all items CPI was pulled from the Bureau of Labor Statistics. Then using 2014 as the base year, annual sales tax revenue numbers were multiplied by the percent increase in the CPI from the base, then divided by the Denver population. For the years 2021 – 2023, Denver CPI projections were provided by the Colorado Legislative Council’s June 2021 forecasts and population forecasts were extracted from the State Demography Office.
[i] https://denvergov.org/files/assets/public/elections/documents/campaigns/tracking/denver-tax-05_10_2021-fourth-submission.pdf
[ii] https://www.denvergov.org/Government/Agencies-Departments-Offices/Department-of-Finance/Our-Divisions/Budget-Management-Office-BMO/City-Budget
[iii] https://www.denvergov.org/files/assets/public/finance/documents/budget/2021-budget-v1_2_3.pdf
[iv] https://www.cost.org/globalassets/cost/state-tax-resources-pdf-pages/cost-studies-articles-reports/1903-3073001_cost-ey-sales-tax-on-business-inputs-study_final-5-16.pdf