

New Money for Schools, Roads and Public Services
Authors
Simon Lomax
Chris Brown
November 2019
ABOUT THE AUTHORS
Simon Lomax is the Common Sense Policy Roundtable’s Energy Resources Fellow.
Simon has spent more than 20 years working in journalism, government and public affairs in the United States and Australia. Mr. Lomax is a former congressional fellow with the American Political Science Association and a former energy and environmental reporter for Bloomberg News. Since 2012, he has worked with think tanks, trade associations and business groups to advocate for limited government and free-enterprise approaches to public policy.
Chris Brown is the Director of Policy and Research with the Common Sense Policy Roundtable.
ABOUT CSPR
We believe sound fiscal and economic research is essential to uphold Colorado’s economic vitality, future, and individual opportunity.
As a non-profit free-enterprise think tank dedicated to the protection and promotion of Colorado’s economy, our mission is to research and promote common sense solutions for the most pressing public policy issues facing Colorado. We examine the economic impact of policies, initiatives, and proposed laws by employing dynamic modeling that accurately measures the impact of each measure on the Colorado economy and individual opportunity. To fully achieve our mission, we actively promote these solutions through the education of policy experts, lawmakers, community leaders, and the general public.
We were founded in 2010 by a concerned group of business and civic leaders that saw divisive partisanship was overwhelming the issues, and objective economic analysis was not being presented to lawmakers and voters empowering them to make fact-based and common sense decisions.
EXECUTIVE SUMMARY
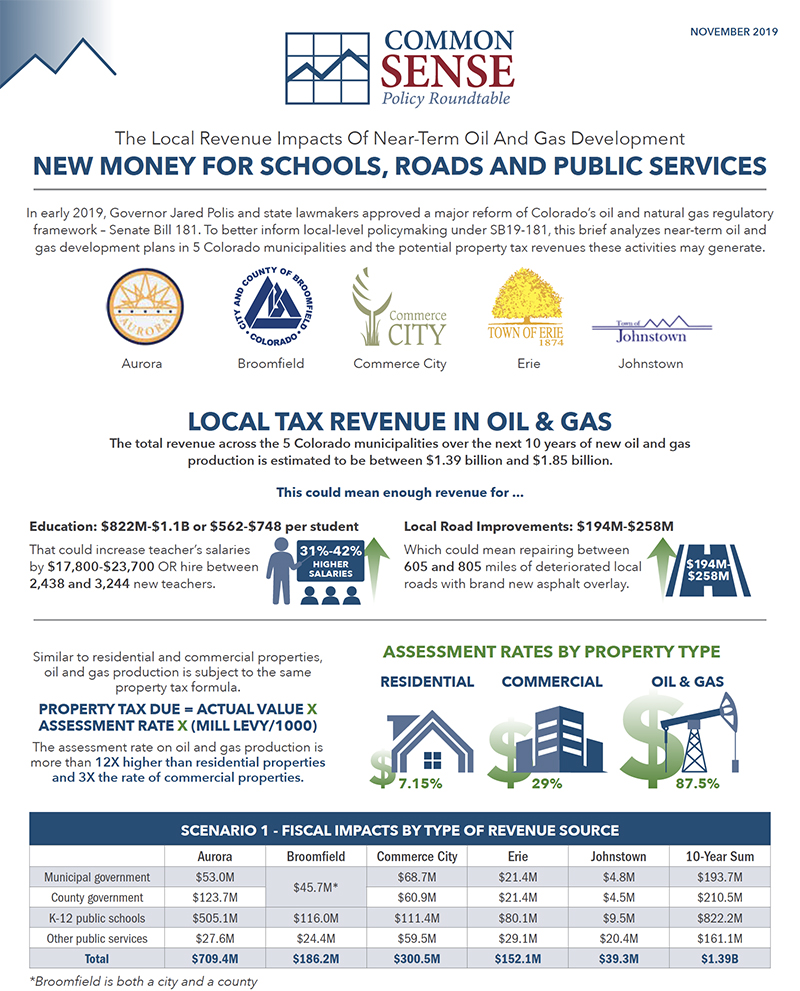
In early 2019, Governor Jared Polis and state lawmakers approved a major reform of Colorado’s oil and natural gas regulatory framework – Senate Bill 181. While the new law maintains a stateled permitting process, administered by the Colorado Oil and Gas Conservation Commission (COGCC), SB-181 also expands the role of local governments in the siting and regulation of new energy production facilities.
Both at the state and local level, the economic contributions of oil and gas development are a key factor for policymakers to consider as they implement SB-181. But today, most of the economic research on the oil and gas sector is statewide in nature. Local officials do not have similarly detailed information about the jobs, tax revenue and other economic value supported by oil and natural gas development at the community level. This is especially true when it comes to proposed new drilling projects.
In this analysis, we start to fill this void of information. Specifically, we explore the potential property tax revenues from proposed near-term oil and natural gas development, focusing on five cities and towns in Colorado’s Denver-Julesburg Basin.
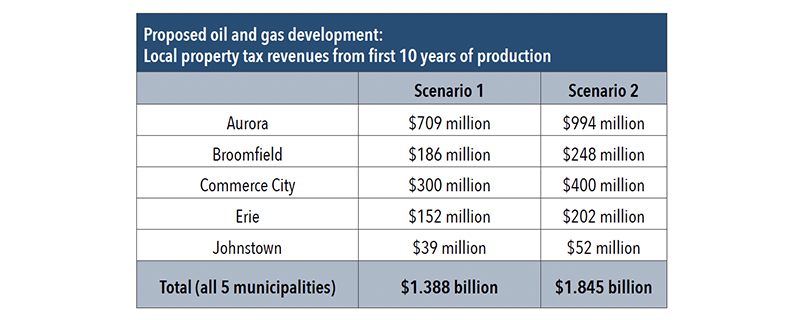
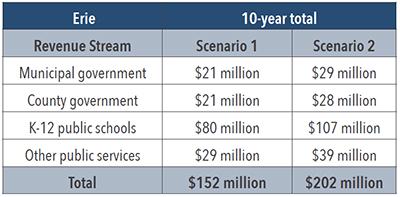
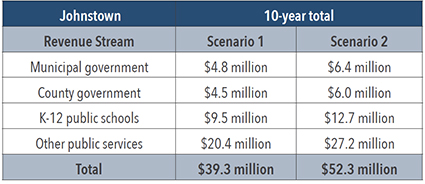
Using publicly available data – including sales volumes from recently completed wells in the DJ Basin, development plans submitted to state and local officials, and mill levy rates – we estimated property tax revenues across two different scenarios of near-term oil and gas development over 10 years. Our findings are summarized in the table below:
These revenues would support a wide range of local services, including K-12 public schools, road construction and maintenance, snow removal, police and fire departments, water and sanitation infrastructure and parks and recreation services. All state revenue sources including severance taxes, income taxes and other royalty fees are not included in this analysis. Therefore, the total fiscal impact across the state would be higher. The local funding identified in this analysis would also be distributed between municipalities, school districts, fire protection districts and other local government entities that serve the communities where this energy development takes place.
The biggest beneficiary, however, would be K-12 public schools, which could receive an additional $822 million to $1.1 billion from oil and gas production in these five municipalities over 10 years. To put this in perspective, in school districts that serve these communities, the annual average of new funding could increase funding by roughly $560 to $748 per-pupil. That could be enough revenue to raise average teacher salaries by between $17,800 and $23,700 or 31% to 42% or support the hiring of between 2,438 and 3,244 additional teachers.1
Revenues for individual municipalities would also see a significant boost. Taken together, the five cities examined in this analysis could receive an additional $194 million to $258 million over 10 years. That would be enough repair between 605 and 805 lane miles of deteriorated local roads with brand new asphalt overlay.2
In conclusion, this analysis does not provide the final word on the local economic contributions of oil and gas development in Colorado – far from it. We intended to revisit and expand upon this preliminary examination to include other economic indicators and other communities across the state of Colorado.
While the full local revenue impact across all Colorado municipalities has yet to be quantified, one thing is clear: The economic contributions of oil and gas development are very significant at the local level. But until now, these local economic contributions have been largely ignored in favor of statewide metrics. As a result, local officials have started to implement SB-181 with little to no information about the economic consequences of their decisions. This analysis represents a first step towards informing local communities of these economic matters.
INTRODUCTION
To better inform local-level policymaking under SB-181, the Common Sense Policy Roundtable has prepared an analysis of near-term oil and gas development plans in several Colorado municipalities and the potential property tax revenues these activities may generate.
Five cities and towns, located in the DJ Basin, were selected:
- Aurora
- Broomfield
- Commerce City
- Erie
- Johnstown
The variables considered in this analysis include: Existing property tax formulas, near-term development proposals from energy firms, production estimates for new oil and gas facilities, and commodity-price forecasts for the next 10 years.
This analysis does not attempt to predict oil and gas-related property taxes down to the last dollar and cent over the course of a decade. Rather, it has a more realistic goal: Communicating the potential size and scope of these revenue streams, which may not be immediately obvious to policymakers and the public in local discussions over oil and gas development.
BACKGROUND AND METHODOLOGY
1. Property taxes
 Local property taxes are a major source of public revenue across Colorado. These taxes generate revenue for municipalities, counties and school districts. Property taxes are also levied by special districts to support fire and rescue services, water and sanitation infrastructure, parks and recreation departments, hospitals, libraries and other public services across Colorado.3
The following formula is used to calculate the local taxes owed by property owners in Colorado:
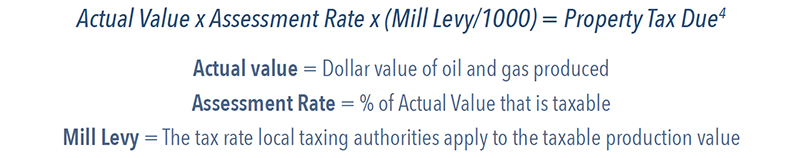
When examining the tax profile of the oil and gas industry in Colorado, the assessment rate plays a central role. The assessment rate is set at the state level and it effectively determines the percentage of a property’s value subject to local mill levies.
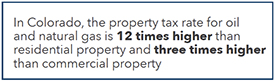
Currently in Colorado, the assessment rate for residential property is 7.15 percent and the assessment rate for commercial property is 29 percent. Oil and gas, however, has an assessment rate of 87.5 percent.5 This is more than 12 times higher than the assessment rate for residential property and three times higher than the assessment rate for commercial property.
For this reason, in areas where energy development is either planned or already taking place, oil and gas development can make a relatively large contribution to the local tax base, even with a much smaller presence compared to residential and commercial property classes.
2. Plans for near-term oil and gas development
Due to the way energy development is regulated in Colorado, energy firms must obtain a series of regulatory approvals for every single location they wish to develop. In practice, this means energy firms provide local and state officials with advance notice of their plans for future drilling long before any locations are actually developed and start producing oil and gas.
By reviewing these plans, it is possible to estimate the amount of near-term oil and gas development and production proposed for an area. To estimate near-term oil and gas development planned for the five cities and town in this analysis, we reviewed:
- Operator agreements between local governments and energy firms
- Location assessments (Form 2As) submitted by energy firms to the COGCC
- Use by Special Review applications submitted by energy firms to local governments
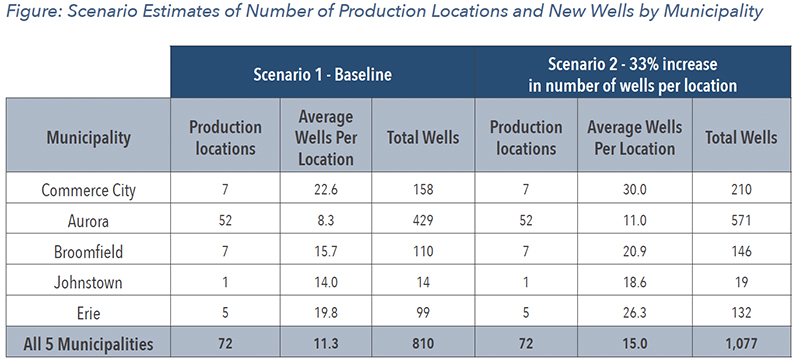
Using these documents, we identified 72 locations where new oil and gas production facilities are likely to be developed in the near term. Our baseline scenario – Scenario 1 – assumes 810 individual oil and gas wells will be developed and enter production across these 72 locations over a five-year period. In Scenario 2, the average number of oil and gas wells per location was raised from 11.3 to 15 – an increase of 33% – to examine how additional well approvals would impact future tax revenues. A full breakdown of the assumed well counts under Scenario 1 and Scenario 2 can be found in Appendix: Limitations, Assumptions and Endnotes.
To be clear, the regulatory documents reviewed for this analysis and the scenarios developed around them do not provide an upper or lower limit on future oil and gas development for any given area. Development plans can change as a result of negotiations between energy firms, state regulators, local officials and other stakeholders, for example. However, operator agreements and permit applications are a useful indicator of the amount of new oil and gas development and production that may come online in the near term in any given area.
3. Estimated value of oil and gas development
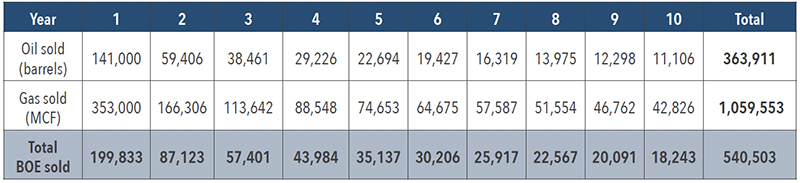
To assist our analysis, we developed a 10-year production estimate for newly developed oil and gas wells in the DJ Basin. This estimate was partially based on a review of state data from recently drilled wells in Adams, Arapahoe, Weld and Larimer counties and publicly reported production figures from major oil and gas operators in the DJ Basin.
In terms of state data, we reviewed a total of 20 wells across the DJ Basin which started production in 2017 and 2018. On average, they produced and sold approximately 188,000 barrels of oil and 471,000 cubic feet of gas in their first 12 months of operation.6 When converted to barrels of oil equivalent (BOE), these volumes represent an average of 267,000 BOE.7
We also reviewed public presentations from two DJ Basin oil and gas producers, who reported more conservative first-year production averages to investors and securities regulators. These averages ranged between 110,000 BOE and 220,000 BOE.
Based on these data, we developed the following 10-year profile for a “typical” newly developed DJ Basin well, which assumes first-year production and sales of approximately 200,000 BOE and applies an updated decline curve which was originally developed for previous studies conducted on Proposition 112 and SB-181.8
To be clear, this 10-year estimate is not intended to predict with absolute certainty the future production and sales from every new well in the DJ Basin. These levels are determined by a complex combination of factors, including the geology of the target formation, the length of the horizontal section of the well, the technologies used to complete the well, and the capacity of nearby transportation infrastructure to physically deliver oil and natural gas to market.
Therefore, this production profile represents a conservative estimate of what new DJ Basin wells are likely to produce, on average, during their first 10 years of operation. This average can then be applied to future drilling plans in order to estimate how much oil and gas will be produced – and how much property tax will be paid – in the five cities and towns selected for this analysis.
4. Commodity prices
Calculating the value of energy production over 10 years requires assuming price levels for oil and natural gas over this period. We reviewed CME Group futures data, Energy Information Administration reference cases and other public forecasts to develop the price assumptions for this analysis. We believe these assumptions to be conservative, both in terms of oil and natural gas commodity prices and because they do not include the additional value of natural gas liquids, which are separately sold across industrial, commercial, transportation and residential markets. Before assessment rates and mill levies were applied, transportation and other related expenses were deducted from these assumed oil and gas commodity prices.
MUNICIPAL LEVEL RESULTS
1. Aurora
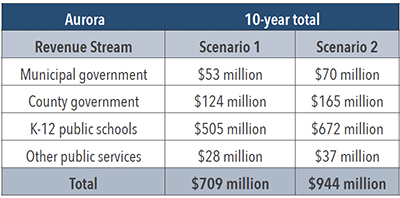
Near-term oil and gas development in Aurora is planned for the city’s eastern edge in parts of formerly unincorporated Arapahoe and Adams counties. According to 2018 production data, Adams and Arapahoe counties are Colorado’s fourth and fifth largest oil and gas producing counties respectively.9
Operator agreements approved by the City of Aurora and location assessments submitted to state regulators are focused primarily on areas to the east of E-470, a major toll road.10 These near-term oil and gas facilities, if developed, may generate an estimated $709 million to $944 million in local property tax revenues over 10 years.
2. Broomfield
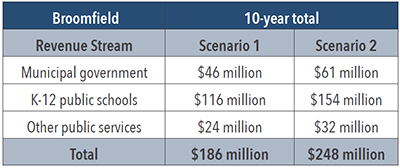
Near-term oil and gas development is planned for northeastern Broomfield, in the vicinity of Interstate 25 and the Northwest Parkway, a major toll road.11 Broomfield is both a city and a county, which gives it a somewhat different property tax profile than other municipalities examined in this analysis.
Near-term oil and gas facilities planned for Broomfield, if developed, may generate an estimated $186 million to $248 million in local property tax revenues over the course of a decade.
3. Commerce City
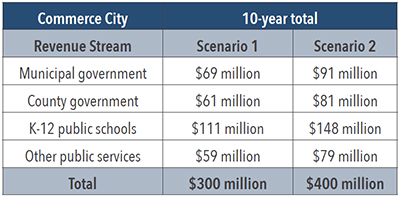
Commerce City is located in Adams County, the state’s fourth largest oil producing county, according to 2018 data.12 In Commerce City, near-term oil and gas development is planned for the municipality’s eastern edge. Oil and gas developers are primarily focused on locations in close proximity to E-470, a major toll road, and Interstate 76.13
Near-term oil and gas facilities planned for these locations, if developed, may generate an estimated $300 million to $400 million in local property tax revenues over 10 years.
4. Erie
The Town of Erie is located in Boulder and Weld counties. Weld County is Colorado’s largest oil and gas producing region, accounting for 88% of state oil production and 36% of state natural gas production.14 Near-term development plans from oil and gas operators are predominantly focused on the eastern side of Erie, between County Line Road and Interstate 25.15
If developed, these new oil and gas facilities may generate an estimated $152 million to $202 million in local property tax revenues over the course of a decade.
5. Johnstown
The Town of Johnstown is located in Weld and Larimer counties. Weld is the state’s top oil and natural gas producer, while Larimer County is the state’s third largest oil producer, according to 2018 data.16
According to regulatory filings with the COGCC, near-term oil and gas development is planned for northwest Johnstown.17 If developed, these new oil and gas facilities may generate an estimated $39.3 million to $52.3 million in local property tax revenues during their first 10 years of production.
CONCLUSION
The findings of this analysis show near-term oil and gas development has the potential to be a major source of new revenue for cities and towns in Colorado’s DJ Basin.
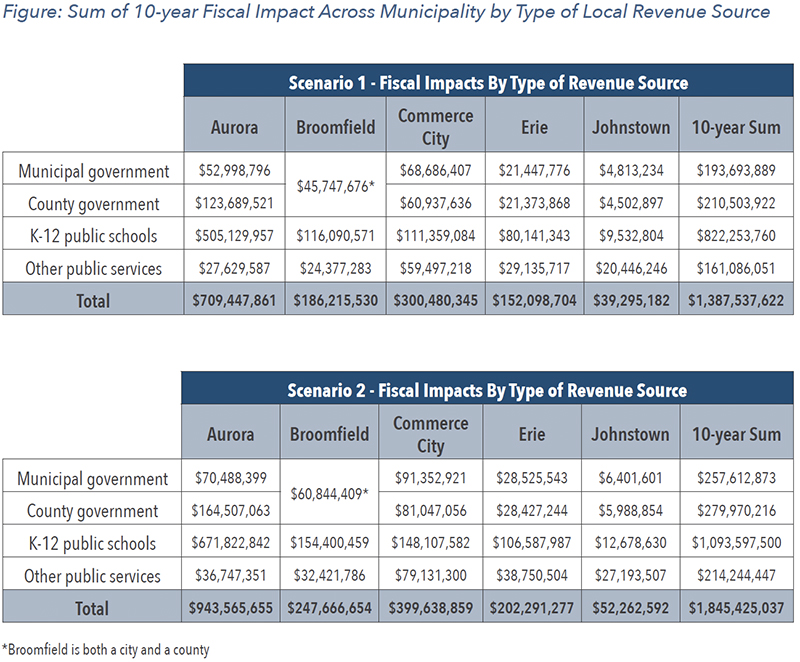
Across the five local jurisdictions examined, property tax revenues from the first 10 years of production may total between $1.39 billion and $1.85 billion. Municipal governments could receive an additional $194 million to $258 million over this period, which could be used to increase spending on a wide range of public services, including road construction and repair, law enforcement, snow removal and parks and recreation among others. Likewise, county governments may also receive a $211 million to $280 million boost to their budgets over 10 years under the near-term oil and gas development plans reviewed in this analysis.
Public schools could also see major benefits. Tax revenues from near-term oil and gas development in these five municipalities may generate $822 million to $1.1 billion for local K-12 districts. These revenues could be used to increase teacher pay, hire new teachers or add new instructional resources to classrooms, among other things. Given the ongoing debate over education funding in Colorado, this finding may be the most significant for local and state policymakers to consider as they implement SB-181.
In conclusion, this analysis is not intended to predict future tax revenues down to the last dollar and cent. However, by examining near-term plans for oil and gas development, the magnitude of the revenues from near-term oil and gas development can be better understood.
The size and scope of these potential revenue streams, which may not be immediately obvious to policymakers and the public in local discussions over oil and gas development, are an important factor in discussions concerning energy development. To date, however, these fiscal considerations at the local level have been largely overlooked. The analysis takes a step toward correcting this oversight and ensuring the implementation of SB-181 is fully informed by the facts.
APPENDIX: LIMITATIONS, ASSUMPTIONS AND ENDNOTES
This analysis does not purport to predict future oil and gas property tax revenues down to the last dollar and cent. Instead, it attempts to provide policymakers and the public with a greater sense of the size and scope of these revenues to inform future discussions about oil and gas development at the local level.
Some of the limitations and assumptions of this analysis have already been addressed, but others include:
1. Changing municipal boundaries
This analysis is based on near-term oil and gas development proposed within existing municipal boundaries. Cities and towns can change these boundaries by annexing nearby unincorporated land and any oil and gas facilities that exist on that land.
Once annexed, these oil and gas facilities will be subject to additional municipal property taxes in addition to the taxes levied by counties, school districts and other units of local governments. In some cities and towns, annexing oil and gas wells after they have been developed is an established practice.18
2. Updated development plans
This analysis provides a conservative estimate of near-term plans for oil and gas development, based on submitted or approved plans at the state and local level. This estimate is not intended to be an exhaustive review of every proposed oil and gas facility in the municipalities chosen for this analysis.
For example, in the Town of Erie, a map that details near-term oil and gas development does not include proposed well counts for a number of locations.19 These locations were excluded from the analysis, even though they are part of an existing operator agreement between local officials and oil and gas firms, because they have yet to be assigned a proposed well count. It is also possible for future production sites to be consolidated or moved to nearby unincorporated areas based on discussions between energy firms, local officials and the COGCC.20
3. Phases of production and infrastructure capacity
This analysis assumes a phased development process for new oil and gas facilities across the five local jurisdictions examined. Rather than expecting all the proposed locations to be developed and enter production in a single year, a five-year timeline was assumed instead, which reduces overall 10-year production and sales volumes levels by a significant amount.
Another factor impacting production and sales volumes is pipeline infrastructure. However, the impact of production curtailments over a 10-year period are considered to be minimal and were not specifically accounted for in this analysis.
4. Tax and regulatory changes
This analysis is based on state property tax assessment rates and representative mill levy rates from the five local jurisdictions studied. Mill levies for metropolitan districts, which help cover the infrastructure costs associated with new residential neighborhoods and mixed-use developments, were not included in these totals.
Local property tax rates may shift over time, due to changes in state law, voter-approved tax measures or other changes in fiscal policy. However, the rates used in this analysis are assumed to be relatively stable, with only small changes at the margins, for the purposes of this analysis.
Likewise, this analysis assumes a relatively stable regulatory framework for developing new oil and gas facilities in Colorado. For example, most of the planned development in this analysis is covered by operator agreements between local officials and energy firms. This is the kind of local involvement in siting decisions that SB-181 was designed to promote, and COGCC officials have stated “we’ll continue business as usual in terms of how we are processing [permit applications for] oil and gas wells” under the new law.21
5. Commodity prices
Commodity price assumptions in this analysis were developed after reviewing CME Group futures data, Energy Information Administration reference cases and other public forecasts. A conservative range relative to these forecasts was chosen: Between $51.40/barrel and $53.18/barrel for and $2.42/MCF and $3.05/MCF for natural gas over the course of 10 years. Deductions of $8/barrel and $1/MCF for transportation and other expenses tied to the sale of oil and natural gas produced in Colorado were also applied.
These price and expense assumptions were necessary to calculate the value of oil and natural gas produced during the first 10 years of production from new oil and gas facilities. However, commodity prices and transportation expenses are subject to change.
The following figures provide more detail on the assumptions and fiscal impacts across both scenarios.
ENDNOTES
- According to data from the Colorado Department of Education, the weighted average of teacher salaries in school districts serving Aurora, Broomfield, Commerce City, Erie and Johnstown is $56,889 per year.
- Road repair estimates compiled by the City of Littleton. Mill & overlay repair work costs approximately $320,000 per lane mile, according to 2016 data. The repair work results in strong, crack free and smooth driving surface with a life expectancy of 15 to 20 years.
- Special District Association of Colorado: A Guide to Special Districts https://www.colorado.gov/pacific/sites/default/files/atoms/files/guide_to_special_districts_2017.pdf
- Office of the Douglas County Assessor: https://www.douglas.co.us/assessor/assessor-frequently-asked-questions/
- Office of the La Plata County Assessor: http://www.co.laplata.co.us/government/elected_officials/assessor_s_office/general_information
- Production and sales data from individual oil and gas facilities was retrieved from the Colorado Oil and Gas Information System: https://cogcc.state.co.us/data.html#/cogis
- According to standard industry conversion rates, one barrel of oil equivalent (1 BOE) equals approximately six thousand cubic feet (6 MCF) of natural gas.
- July 2018: The Economic and Fiscal Impacts of 2018 Proposition 112 https://commonsenseinstituteco.org/oil-gas-setback-study/
March 2019: The Statewide Cost of Prohibitions, Restrictions and Regulatory Uncertainty in Colorado’s Energy Sector https://commonsenseinstituteco.org/senate-bill-181/ - Data sourced from Colorado Oil and Gas Information System: https://cogcc.state.co.us/data.html#/cogis
- City of Aurora Operator Agreement, June 5, 2019: https://www.auroragov.org/UserFiles/Servers/Server_1881137/File/Residents/Oil%20and%20Gas%20Drilling/ConocoPhillips%20Oil%20and%20Gas%20Operator%20Agreement%20FINAL.pdf
City of Aurora Operator Agreement, July 24, 2019: https://www.auroragov.org/UserFiles/Servers/Server_1881137/File/Residents/Oil%20and%20Gas%20Drilling/Axis%20Exploration%20LLC_%20FINAL%20Oil%20and%20Gas%20Agreement.pdf
COGCC Location Assessment, Nov. 9, 2018: https://cogcc.state.co.us/cogis/FacilityDetail.asp?facid=450157&type=LOCATION
COGCC Location Assessment, June 28, 2019: https://cogcc.state.co.us/cogis/FacilityDetail.asp?facid=454144&type=LOCATION
COGCC Location Assessment, Jan 18, 2019: http://ogccweblink.state.co.us/DownloadDocumentPDF.aspx?DocumentId=4711455 - City and County of Broomfield Operator Agreement, Oct. 24, 2017: https://www.broomfield.org/DocumentCenter/View/25064/Resolution-2017-186-and-Agreement?bidId=
City and County of Broomfield Use by Special Review Application, Feb. 23, 2018: https://www.broomfield.org/2816/Crestone-Peak—Broomfield-Goltl-Pad - Data sourced from Colorado Oil and Gas Information System: https://cogcc.state.co.us/data.html#/cogis
- Commerce City Operator Agreement, Sept. 19, 2019: https://www.c3gov.com/home/showdocument?id=8328
- https://www.weldgov.com/departments/oil_and_gas_energy
- Town of Erie Operator Agreement, Nov. 4, 2019: https://www.erieco.gov/DocumentCenter/View/11328/Amended–and-Restated-Operator-Agreement—11-04-2018
- Data sourced from Colorado Oil and Gas Information System: https://cogcc.state.co.us/data.html#/cogis
- COGCC Location Assessment, Feb. 20, 2019: http://ogccweblink.state.co.us/DownloadDocumentPDF.aspx?DocumentId=4753955
- Boulder Daily Camera, Jan 11, 2019: Erie annexation deal with Anadarko could bring town millions in revenue, officials say https://www.dailycamera.com/2019/01/11/erie-annexation-deal-with-anadarko-could-bring-town-millions-in-revenue-officials-say/
Denver Channel, Oct. 8, 2018: Dacono City Council approves drilling agreement with Anadarko Petroleum https://www.thedenverchannel.com/news/local-news/dacono-city-council-approves-drilling-agreement-with-anadarko-petroleum - Town of Erie Oil and Gas Activity: https://www.erieco.gov/DocumentCenter/View/10558/Well-Sites
- Denver Post, May 24, 2017: Denver-based Extraction Oil & Gas will move 40 wells out of Broomfield https://www.denverpost.com/2017/05/24/extraction-oil-and-gas-broomfield/
- 9News, April 3, 2019: Colorado lawmakers OK’d new oil and gas regulations. What’s next? https://www.9news.com/article/news/colorado-lawmakers-okd-new-oil-and-gas-regulations-whats-next/73-4b0f7ffa-6dae-4444-b97d-48037b8c450b