

Download a pdf of the full study >>
Download a pdf of a single page handout of the study >>
Authors: Brenda Bautsch Dickhoner, PH.D., Chris Brown
ABOUT THE AUTHORS
Dr. Brenda Bausch Dickhoner is CSPR’s Education Fellow. Dr. Dickhoner graduated from Duke University with a Bachelor of Arts in Political Science and earned her Doctor of Philosophy in Public Policy from the University of Colorado Denver. She has spent the last decade working in education policy at the national and state level. Most recently, at the Colorado Department of Education, she developed and implemented policies to ensure all students have access to a high-quality education. Highlights of Brenda’s work include helping Colorado’s Commissioner and the State Board of Education determine actions to take to improve the state’s lowest-performing schools and districts.
Chris Brown is the Director of Policy and Research with the Common Sense Policy Roundtable.
EXECUTIVE SUMMARY
An educated populace is a key driver of economic prosperity. Our increasingly dynamic economy requires employees to be agile, self-motivated and resilient. Students should be mastering these competencies, along with foundational literacy and numeracy skills, in our education system. And yet, in communities across Colorado, public schools are failing to provide the kind of quality education that prepares our youth to be productive members of the workforce. Thirty-five percent of Colorado’s high school students who graduated in 2017 and immediately enrolled in college were not prepared for college-level coursework and required developmental education. Outcomes for students of color and low-income students are even worse; over 55 percent of Colorado’s low-income high school graduates and 52 percent of Hispanic graduates were not ready for college courses in 2017.1
Some point to a lack of funding as the reason for our education system’s underperformance and inequitable outcomes. Recently, there have been efforts at the ballot box to raise taxes to generate more school funding in a hope to improve student outcomes. There has been an increased focus on teacher pay with rallies at the State Capitol and a week-long teacher strike at Denver Public Schools. Also, there was a spotlight on increasing funding for early childhood education during the 2019 legislative session when Governor Jared Polis successfully secured additional dollars to support full-day Kindergarten.
However, what is missing from public discourse is a common understanding of how K-12 public education is funded in Colorado and what the trends in revenues and spending have been over the past decade. Likewise, there is not a clear picture of what teachers are paid and how that differs across the state. This study provides baseline data and analysis to ground these important conversations in facts.
Here are some of the key findings from this study.
Funding for K-12 education is at an all-time high for Colorado. Total program funding, which includes local and state funding, reached $7.59 billion in Fiscal Year 2019-20, resulting in an average of $8,480 per pupil. K-12 education funding has been steadily increasing since 2013 when the state’s economy began rebounding from the Great Recession, and it is now at the highest level in the state’s history. School districts also receive additional funding from other local sources and from the federal government.
Structural flaws in the K-12 education funding system create inequities for local taxpayers. There is significant variation in the proportional amount taxpayers are contributing to public education through property taxes. Colorado’s education funding system sets a specific amount of total program funding for individual districts.
Then it calculates how much each district will contribute through local revenues, and finally, backfills with state funding to get districts to their prescribed funding levels. The amount that local districts contribute to total program funding—which determines the amount of state subsidy to each district—is not based on an intentional policy design and varies dramatically throughout the state. A taxpayer with a median value home in Pueblo, for example, pays $673.55 in property taxes for total program education funding, while a taxpayer in Kit Carson also living in a median value home pays $194.83. Given these flaws in how local dollars are contributed by districts to K-12 funding, the system does not raise revenue in the most effective, or even logical, manner.
In addition, structural flaws in the funding system lead to an inequitable distribution of revenues. When considering how revenues are allocated to school districts under Colorado’s funding formula, there are several elements that can be improved upon. The current formula, for example, distributes additional funding to districts with high costs of living. In some instances, this means wealthy localities such as Aspen School District are receiving more state dollars than poorer school districts, such as its neighbor, Lake County, even after Lake County receives extra funding for at-risk students. Put simply, wealthy districts are sometimes overcompensated by the state in an attempt to adjust for their higher cost of living. In addition, voters in some school districts have approved mill levy overrides to generate funding for their schools above and beyond what they get through the state’s education finance formula. This extra layer of funding outside of the statutory formula adds to the inequities in local revenues as some communities have a more difficult time shouldering extra taxes or persuading voters to do so. An example of the resulting disparities in revenues is that, in 2016-17, Aspen School District received $25,567 per pupil in local, state and federal revenues compared with neighboring Lake County, which received $13,687 in per pupil revenue. Because of the drastic differences in funding and demographics, the national nonprofit EdBuild has identified the Aspen/Lake County border as one of the most “divisive borders” in the country.2
There is a subtle, but impactful, downward trend in the share of dollars going to instructional staff. From 2007 to 2017, the share of spending allocated to instructional salaries declined by 3.5 percentage points. This salary data covers all instructional positions, including reading and math interventionists, paraprofessionals, nurses, psychologists, speech pathologists and others working with students along with teachers. At the same time, spending on benefits increased by 1.5 percentage points, largely due to the doubling of annual PERA payments needed to cover the growing unfunded liability. Spending on administrative functions, student support services, and operations also increased as a share during this time.
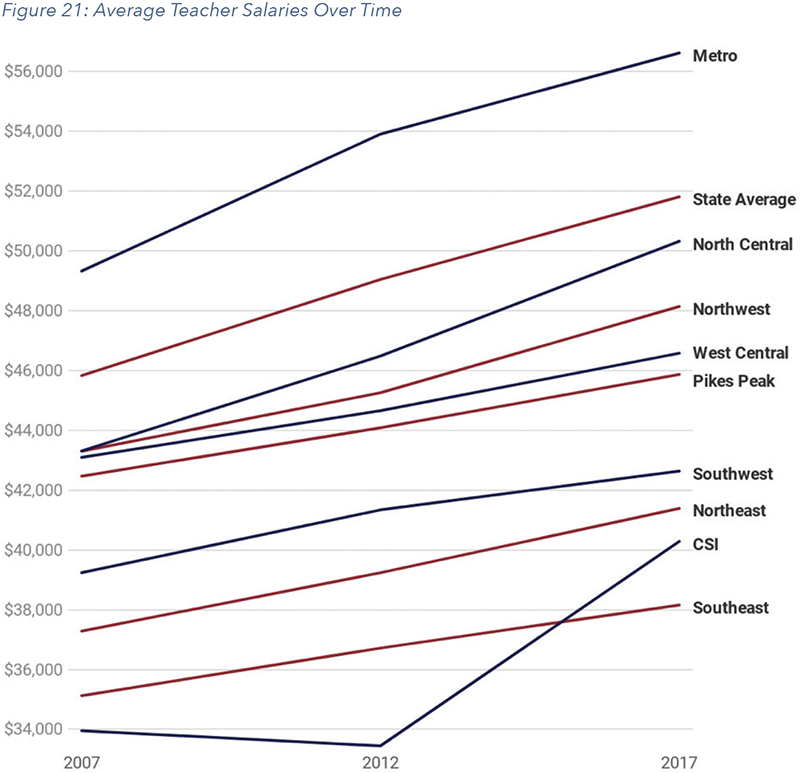
Looking at teacher salaries in more depth reveals that average salaries vary dramatically around the state and within the Metro Denver region. At a regional level, urban and suburban salaries are outpacing rural salaries even as the cost of living in the rural areas is also increasing. For instance, in 2017 the average salary for the Metro region was $56,621, which is 39 percent greater than the Southeast region’s average salary of $38,157. A state report estimates that teacher salaries in 95 percent of the state’s rural districts are below their area’s cost of living. Within regions, salaries also vary immensely. Boulder Valley School District is at the high end of the metro region with average salaries of $72,994. Less than an hour east of Boulder, average salaries are $24,400 lower in School District 27J, which serves students in Brighton and parts of Thornton and Commerce City.
At the same time, teacher turnover is low in comparison to other jobs. Despite the rhetoric that teachers are fleeing the profession due to low pay, pressure from state tests, or other factors, the data in this study shows a different picture. Overall, in 2017, teacher turnover was 16.9 percent. When looking all public education positions in the state, turnover that same year was 20.5 percent. An even starker difference is seen when considering that turnover for all jobs—public and private—was 48 percent in Colorado in 2017. Further, only 2.3 percent of teachers responding to a statewide survey in 2017 stated they planned to leave the field of education that year.3 In sum, teacher turnover in Colorado is drastically lower than in most other professions.
POLICY IMPLICATIONS
These findings indicate that careful thought should be given to any policies or ballot initiatives focused on K-12 education funding. Pouring more money into a funding system with serious structural flaws is unlikely to affect change in a way that significantly improves student outcomes. The current statutory funding formula for K-12 education collects revenues from taxpayers in an inequitable way and then fails to fully address the disparate local funding levels when allocating total program funding to school districts. Because the formula’s distribution of revenues is not adequately accounting for differences in property wealth, some wealthier districts have far higher per pupil revenue levels than poorer districts. Simply adding more dollars into this system will only perpetuate and even increase these inequities.
Similarly, the conversation about teacher pay is nuanced and requires thoughtful, targeted policy solutions. Research consistently points to teachers as the most important school-based factor affecting student success, and Colorado needs to ensure schools can pay teachers competitive wages to attract the best talent. According to regional and district-level data, however, there is a wide variation in teacher salaries with some districts struggling to pay their teachers well, while other districts have salaries far above national averages. Further, as evidenced by the data in this study, while education funding has been increasing, teacher salaries are not growing as fast as salaries for other position such as superintendents, and, in some regions, administrative staff. Solutions that involve across-the-board funding increases for all school districts will not help those districts that have more severe struggles with offering competitive teacher pay, nor does it ensure that school districts will funnel extra dollars to teacher pay.
For good reasons education is, to a large degree, a locally controlled enterprise. Preserving local control is critical—those who are closest to students should be making choices about their learning environments. At the same time, acknowledging the differences that play out at the local level in regard to education funding and teacher pay will allow for a more informed policy conversation about how to best move Colorado’s education system forward.
METHODOLOGY
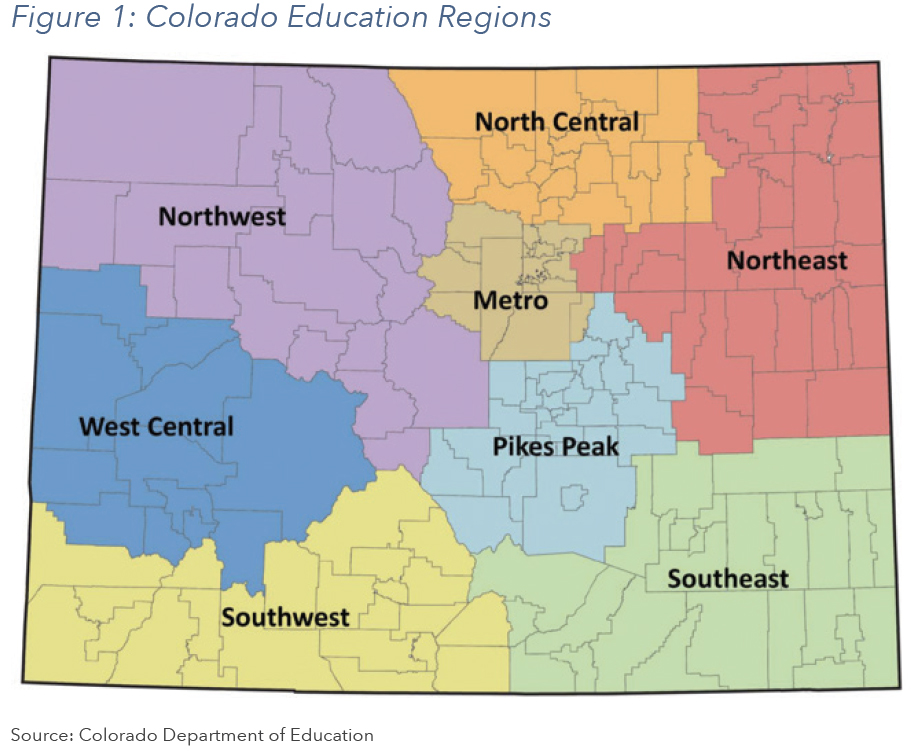
This study analyzes spending and revenue at the state level and by region using the field service regions demarcated by the Colorado Department of Education (CDE). See Appendix A for a list of school districts by region. Expenditure and revenue data are from CDE. The timeframe considered in this study is 2007, 2012 and 2017, which is the last year for which the data were available during the drafting of this report. CDE released 2017-18 data on August 22, 2019, when this study was already completed. The state appropriations section does contain more recent data, which was available from the Joint Budget Committee.4 However, most of the report is focused on the decade between 2007 and 2017. Data on teacher salaries and turnover are from CDE.
STATE CONTEXT
SCHOOL FINANCE ACT
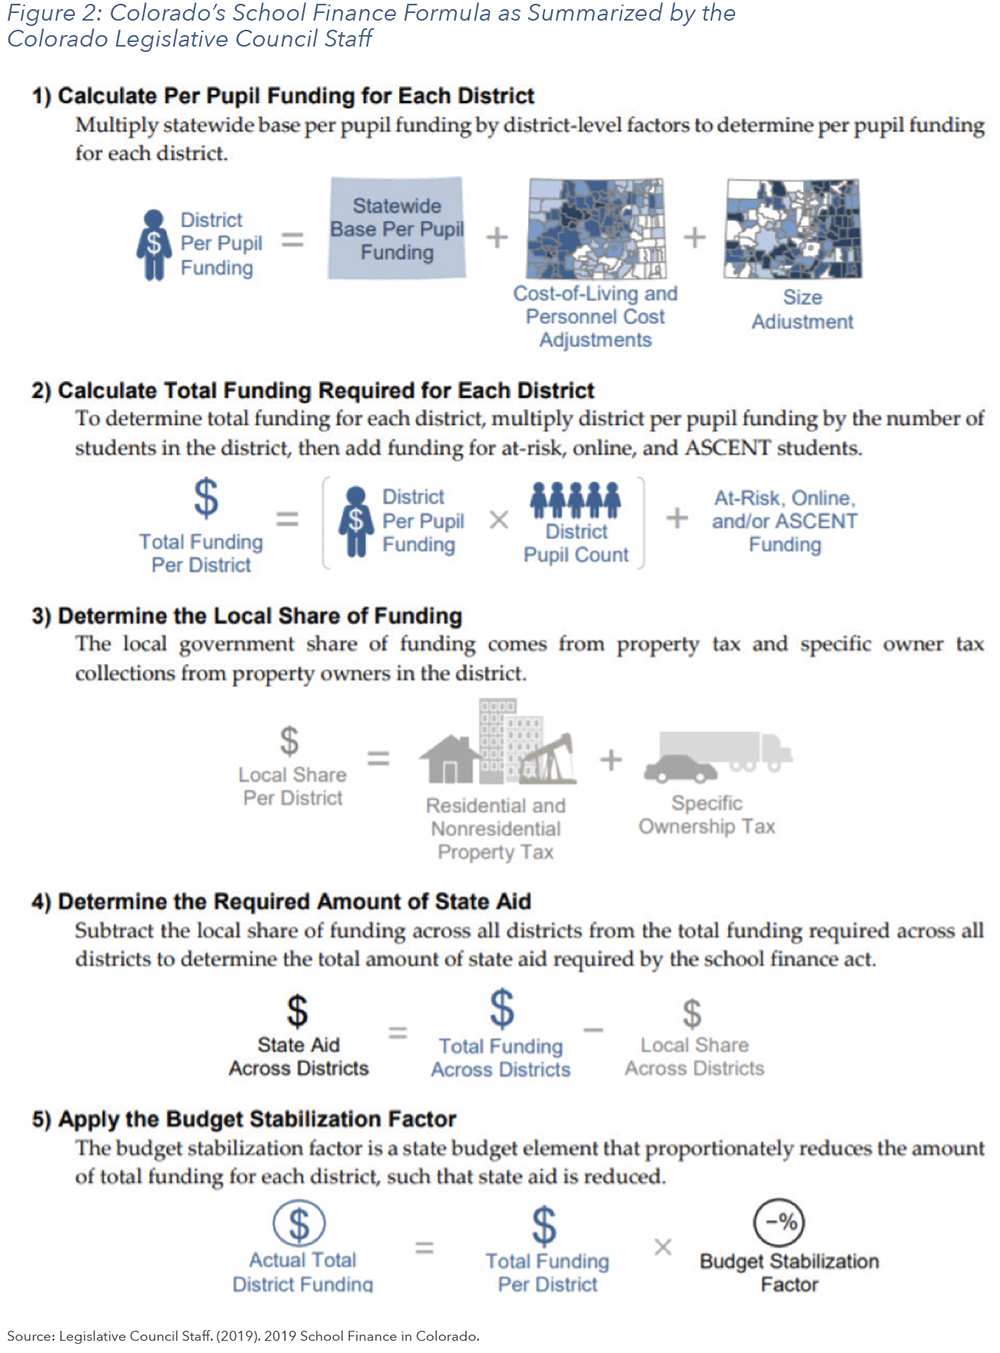
Colorado’s school districts receive state and local funds based on a finance formula first established in 1988 and last revised through the Public School Finance Act of 1994. Figure 2 provides a summary of the school finance formula. The total amount of funding that each school district receives through this formula is referred to as “total program,” which includes both the state share and local share. The formula starts with a base per pupil funding amount and then adjusts that amount for each district by considering cost of living and district size. In addition to per pupil funding, districts receive funding for at-risk, online and ASCENT5 students.
The school finance act requires that local revenues be used to fund public education before the state contributes any dollars. This means that the legislature first calculates the local share, derived from property taxes and specific ownership taxes, and then determines the amount the state will allocate to each school district. If the local share is short of what the district needs to fund its total program, then the state contributes the remaining amount. It is important to note that some districts collect and spend property taxes above and beyond those that get allocated toward the school finance act. These additional property taxes are known as voter-approved mill levy overrides. This study further discusses the funding formula and the inequities that arise from it in the following section.
Once all adjustments are made and district funding levels are established as set forth in the school finance act, the budget stabilization factor is applied to reduce total funding proportionately across school districts. The budget stabilization factor allows the legislature to generate the savings needed to balance its budget while also complying with Amendment 23. Passed in 2000, Amendment 23 requires the base per pupil funding amount in the school finance formula to increase each year by at least the rate of inflation.
SCHOOL FINANCE FUNDING SUMMARY
State funding for public education is now at an all-time high. Funding has been steadily increasing since 2013 when the state’s economy began rebounding from the Great Recession. Colorado contributed $7.59 billion in total program funding (state and local funding) for Fiscal Year 2019- 20, resulting in an average of $8,480 per pupil. This is up from $4.78 billion in total program funding in Fiscal Year 2006-07, which amounted to an average of $6,376 per pupil, not adjusted for inflation. Depending on the rate of inflation used at the state level6, this per pupil program funding amount in 2006-2007 would equal between $7,815 and $8,289 in 2019 dollars.
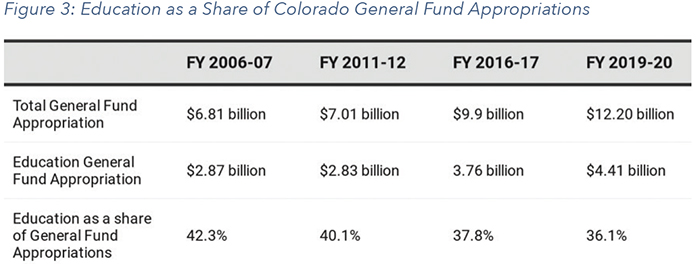
While state funding for education has increased over time, spending on other budget areas has increased at a greater rate, in turn reducing the share of the state’s budget dedicated to K-12 education. Overall, the state’s General Fund spending grew from $6.8 billion in FY 2006-07 to $12.2 billion in FY 2019-20, or by 79.2 percent in nominal dollars. During that same time period, the amount spent on education grew by 53.2 percent or from $2.9 billion to $4.4 billion. Therefore, the share of General Fund dollars allocated to education declined from 42.3 percent to 36.1 percent (see Figure 3). That six percent drop in the share of general fund dollars equated to about $756.3 million in FY 2020. The decline in the share of General Fund education spending during this timeframe is partnered with an increase in the share of the General Fund dedicated to Health Care Policy and Financing, the administrator of the state’s Medicaid program. From the FY 2006-07 to FY 2019-20, the share of General Fund appropriations dedicated to Health Care Policy and Financing grew from 20.2 percent to 25.8 percent.
This pressure on education spending is coupled with significant changes to the funding status of PERA, the state’s public pension system. As a result of several legislative changes, annual contribution requirements have more than doubled. The standard contribution amount made on behalf of each school employee was 10.15 percent in both 2007 and 2017. However, 2007 was the second year of incremental contribution increases on top of the standard contribution that were targeted at paying off the unfunded liability (the projected shortfall in the PERA fund relative to the future payment amounts). From 2007 to 2017 that additional contribution amount, officially termed the amortization equalization disbursement (AED) and the supplemental amortization equalization disbursement (SAED) grew from 1 percent to 9.5 percent and capped out at 10 percent in 2018. In 2017, that additional 9.5 percent contribution requirement on all schools cost $475 million. This is money that comes out of funds that could otherwise be spent on higher teacher pay or classroom materials.
Since 2017 there have been additional PERA reforms that only add to the contribution increases and pressures on funding for classrooms. Previous CSPR research released in March 2018 under the REMI Partnership, One Step Further On PERA Reform, found that partially as a result of the annual contribution increases and reluctance to further reform benefits, from 2012 to 2017, annual pay increases for PERA members was just over 1 percent while PERA retirees saw their payments increase by nearly 3 percent.
While 2018 legislation did impose limited benefit reforms, it committed $225 million annually from the General Fund, along with increased contributions from employees by an additional 2 percent to help pay off the unfunded liability across all divisions. This means that school employees will be contributing 10 percent of their take-home salary to PERA which is nearly the entire amount their benefits are estimated to cost. PERA’s 2018 Comprehensive Annual Report shows that 84% of the employer contribution for each member of the school division will be available to pay down the unfunded liability and not directly contribute to the benefit of the person it is being earned by. PERA’s 2018 Comprehensive Annual Report also shows that the portion of the direct distribution from the general fund going to the school division equals 2.47 percent of pay. Therefore, not even accounting for next year’s increase in payroll, the total contribution to PERA on behalf of the school division, will total over $839 million from the combination of additional employer contributions and the direct payment from the general fund. That total amounts to $15,755 for every teacher in Colorado.
STUDENT POPULATION TRENDS
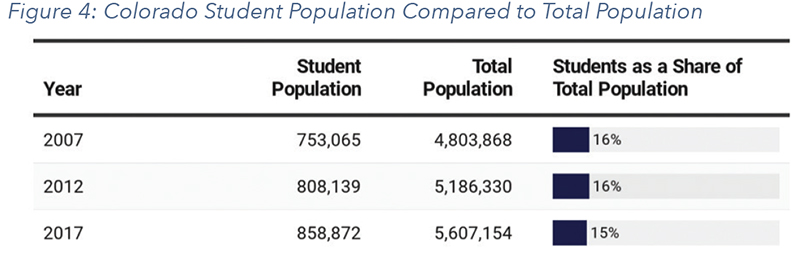
From 2007 to 2017, both the number of students and the overall state population grew, with the state population increasing at a slightly higher rate than the student population. In 2017, students attending pre-Kindergarten through 12th grade in public schools comprised about 15 percent of the total population in Colorado, down slightly from 16 percent in 2007 and 2012. The number of students captured here accounts for approximately 90 percent of Colorado’s school-aged children. Colorado has the one of highest levels of public-school participation in the nation.8
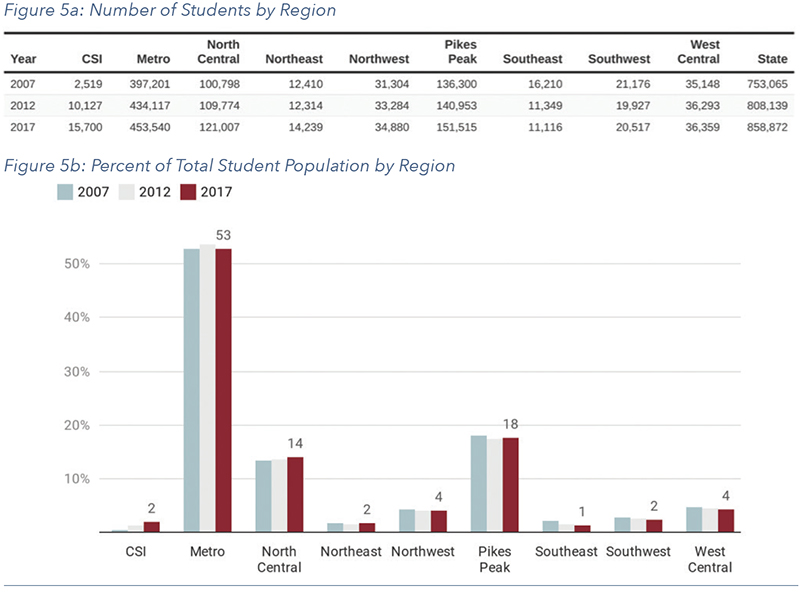
As depicted in the 2017 data in Figures 5a and 5b, just over half of all public-school students (53 percent) attended schools in the Metro region. That equated to nearly half a million students (453,540). The Pikes Peak region was the next largest region enrolling 18 percent of publicschool students, followed by the North Central region, which enrolled 14 percent of students. The Northeast region, consisting of 32 school districts, had the fewest students in 2017 at 14,239, or 2 percent of all Colorado students.
All regions saw their student enrollment increase from 2007 to 2017 except for the Southeast and Southwest regions. The Charter School Institute (CSI) saw the greatest enrollment increases due to its unique status. CSI is a statewide charter authorizing entity that was created by legislation in 2004. CSI authorized its first two schools in 2005. Figure 4 depicts enrollment for 2006- 2007, which was only the second school year for the Institute when it had approximately 2,520 students attending eight schools. Over the next ten years, CSI saw its enrollment increase six-fold and, by 2017, CSI enrollment grew to 15,700 students attending 40 charter schools across the state. School districts can also be charter authorizers, and, in 2016-17, 197 charter schools were authorized by school districts throughout Colorado.
TRENDS IN EDUCATION REVENUE
K-12 public education revenue comes from four main funding sources: Local, State, Federal and Other. Local revenue stems from property tax, specific ownership tax and other monies produced within the boundaries of a school district for the purpose of public education. State revenue includes all funds collected by the state government that are then appropriated to school districts, including per pupil funding, program funding and other state grants and projects. Federal revenue is any money that is distributed to the school district from the federal government, whether directly or through an intervening agency such as the Colorado Department of Education. Federal dollars typically have specific regulations around how the money can be spent. Federal funding, for example, is used to support educational services for students with disabilities and English Language Learners and to fund programs at districts and schools that have a high proportion or number of low-income students. The “Other” category includes items such as accrued interest, proceeds from the sale of bonds and capital leases. Funds in this category are not considered revenues to the school district and tend to be more volatile year to year. For those reasons, Other revenues are not included in the analysis beyond Figure 6.
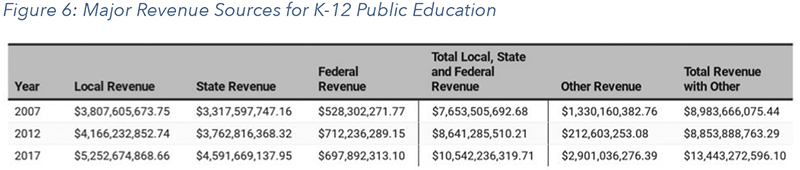
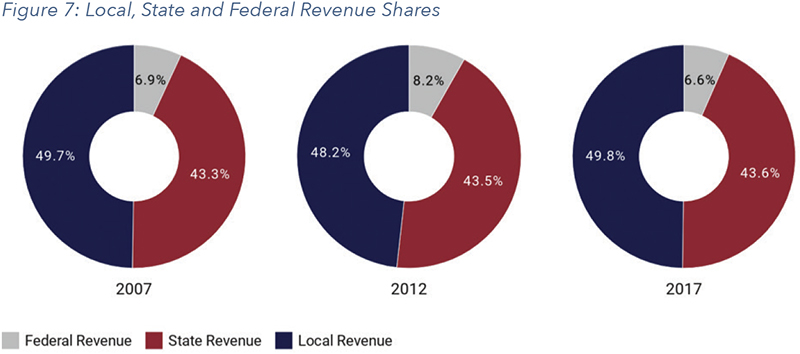
Figure 6 shows education revenues from all major sources for fiscal years 2007, 2012, and 2017. The recession affected revenue levels between 2007 and 2012. The Other category, which is volatile in nature and has big swings year to year, reflects a large decline of $1.12 billion in 2012 as compared to 2007. There was also an increase in the Federal share of revenue in 2012 as the federal government awarded large educational grants to states in the wake of the recession.
Excluding the Other category, by 2017, the share of revenue made up by local, state and federal sources had returned to 2007 levels. In both 2007 and 2017, local funding comprised about 50 percent of revenues, state funding comprised about 43.5 percent and federal funding rounded out the remainder at about 6.5 percent of revenues.
LOCAL FUNDING
For most traditional school districts, property tax revenue from “total program” mills make up the largest source of local funding. This revenue goes towards a school district’s total program funding as set forth in the School Finance Act. The specific ownership tax, which is a tax levied on motor vehicles, makes up a small portion of local revenue and is also included as part of the total program funding. State law allows school districts to collect additional local revenue from voterapproved mill levy overrides and bond redemption mills. Such revenue is not considered in the school finance formula and thus is above and beyond a district’s total program funding.
TAX TERMS
Mill Levy: A property tax rate based on dollars per thousand of assessed valuation. One mill will generate $1 for every $1,000 of assessed value.
Total Program Mill Levy: Property tax revenue generated from total program mills represents the primary source of local funding for K-12 public education.
Specific ownership tax: a tax levied on motor vehicles. Specific ownership taxes are part of a district’s local contribution to school funding.
State Aid: Funding provided by the state under the school finance act. State aid is the difference between a district’s total funding and what is provided from local property and specific ownership taxes.
Override Mill: Local voter-approved property tax revenue in excess of funding provided through the school finance act.
Source: Colorado Legislative Council Staff. 2019 School Finance in Colorado
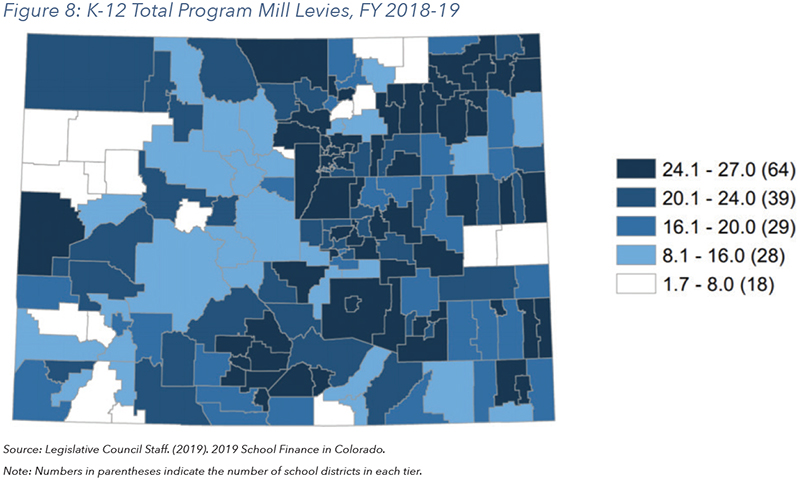
The amount of education revenue generated from property taxes varies widely across the state due to differing levels of total program mills and property wealth. Figure 8 displays total program mill levies by school district. Primero School District has the lowest mill levy at 1.68 mills. By law, the maximum levy is 27 mills. Thirty-nine of the state’s 178 school districts levy 27 mills, leaving 138 districts somewhere in between 1.7 mills and 26.9 mills. This results in a significant variation in the proportional amount taxpayers are contributing to public education via property taxes.
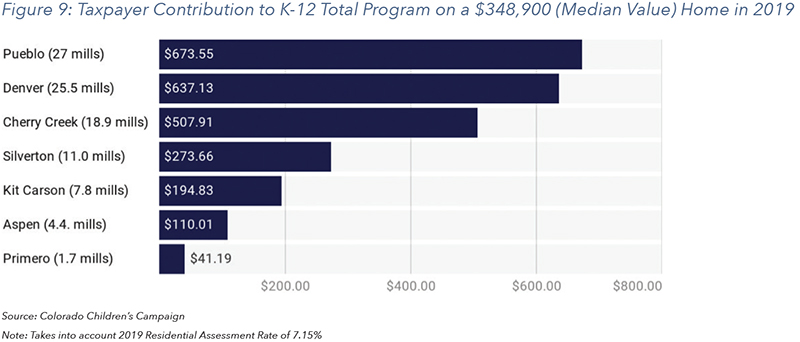
As shown in Figure 9, a taxpayer living in Aspen in a $348,900 home (Colorado’s median value home) contributes $110.01 in yearly property taxes for total program funding for K-12 education while a taxpayer in Pueblo pays $673.55, over six times the amount of the Aspen taxpayer. Of course, taxpayers would be hard pressed to find a house in Aspen for $348,900 where the median home value was $563,900 in 2017. The differing levels of property wealth around the state further complicate the local revenue picture.
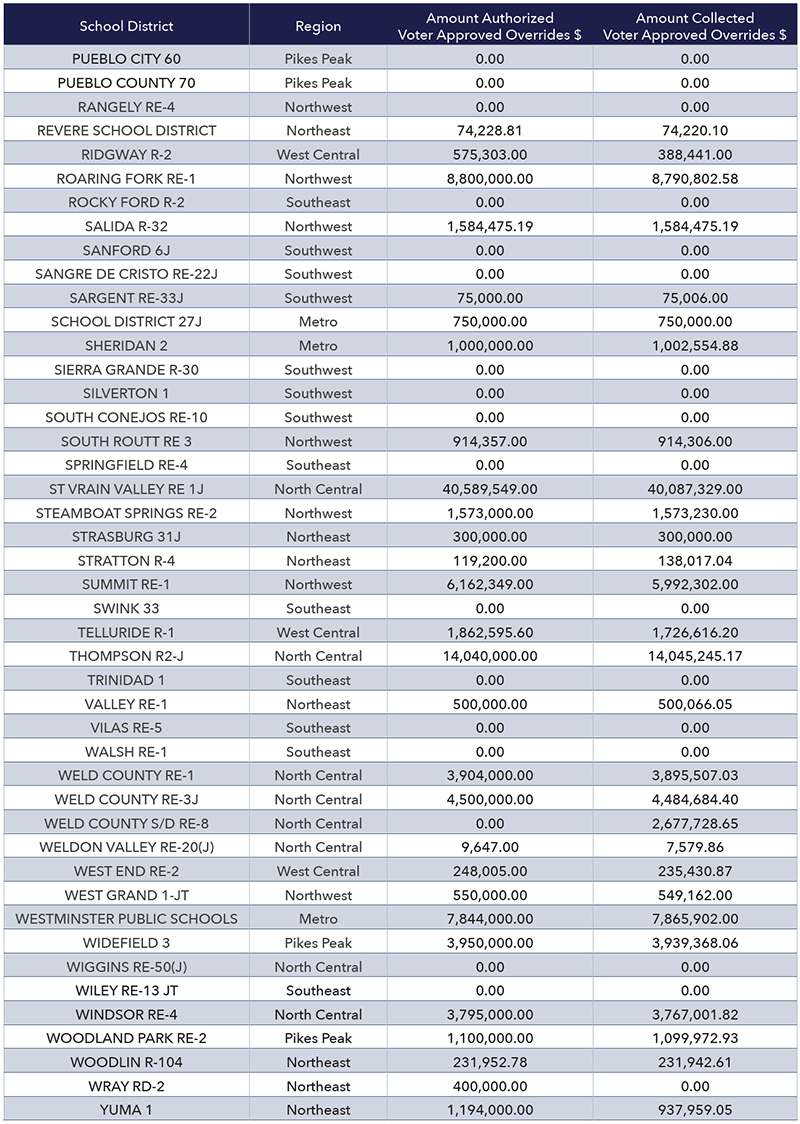
One hundred of the state’s 178 school districts had successfully gained voter approval for mill levy overrides to bring additional funds into their schools by the 2016-17 school year. Another 17 districts secured passage of an override mill by FY 2018-19. Among those districts with overrides in place, the amount of revenue generated varied dramatically—even when the mills were similar and student population size was comparable. Aspen School District’s 1.8 voter-approved override mills generated $5.4 million in 2016-17, for example, while Eaton School District in northeast Colorado brought in $1.2 million that year through its 2.9 override mills. As shown in the map in Figure 10, on a per pupil basis, the Metro region districts bring in lower amounts through their override mills due to comparatively high student enrollment. Those districts generating larger amounts of mill levy override revenue are resort communities and some rural areas with low enrollment.
Continuing with Aspen School District as an example, and considering all local, state and federal dollars on a per-pupil basis (including mill levy overrides), Aspen far outpaced its neighbor, Lake County School District. Even though the two districts are just miles apart, their populations are as different as their education funding levels. Seventy three percent of Lake County students are nonwhite and 16 percent are in poverty, compared with Aspen’s students of whom 15 percent are nonwhite and 5 percent are in poverty. With local, state and federal revenues combined, Aspen receives $25,567 per pupil to Lake County’s $13,687 per pupil. Because of the drastic differences in funding and demographics, the national nonprofit Ed-Build has identified the Aspen/Lake County border as one of the most “divisive borders” in the country.9
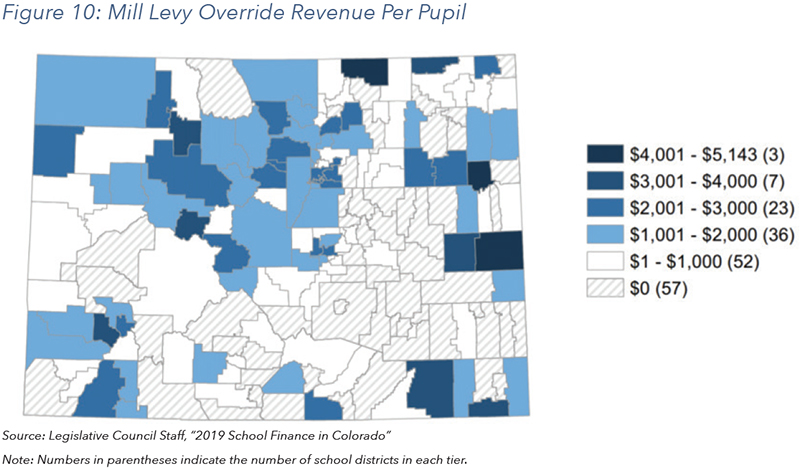
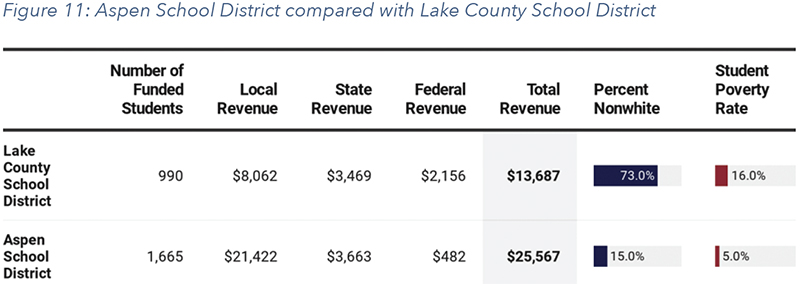
Figure 12 considers property tax revenue as a share of total local, state and federal revenue by region. Figure 13 looks at state funding as a source of total revenue by region. The Northwest region, which is comprised of school districts with higher total program mill levies, relies the most heavily on property tax revenue. The region receives over half of their total revenues throughproperty taxes (54.4 percent in 2017), and, correspondingly, the Northwest region has the smallest share of state funding of all regions (see Figure 8).
The Southeast region receives the smallest proportion of revenue from property taxes (18.4 percent in 2017), and, accordingly, its share of revenue coming from state sources is the highest among the traditional school districts (see Figure 8). Given CSI’s unique constitution as a statewide charter authorizer, it does not collect any revenue from property taxes and relies instead on state appropriations as depicted in Figure 13.
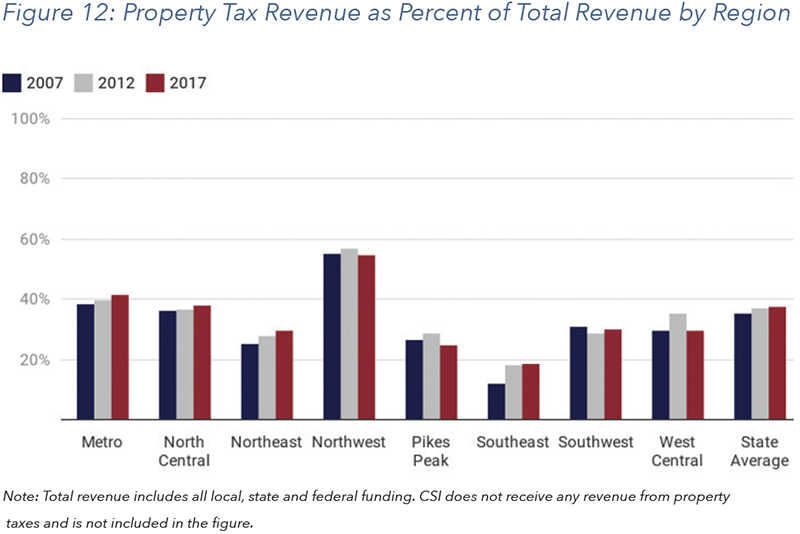
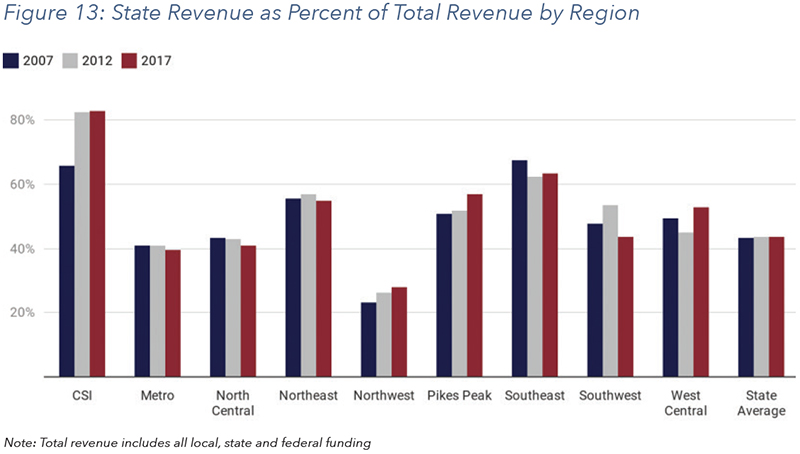
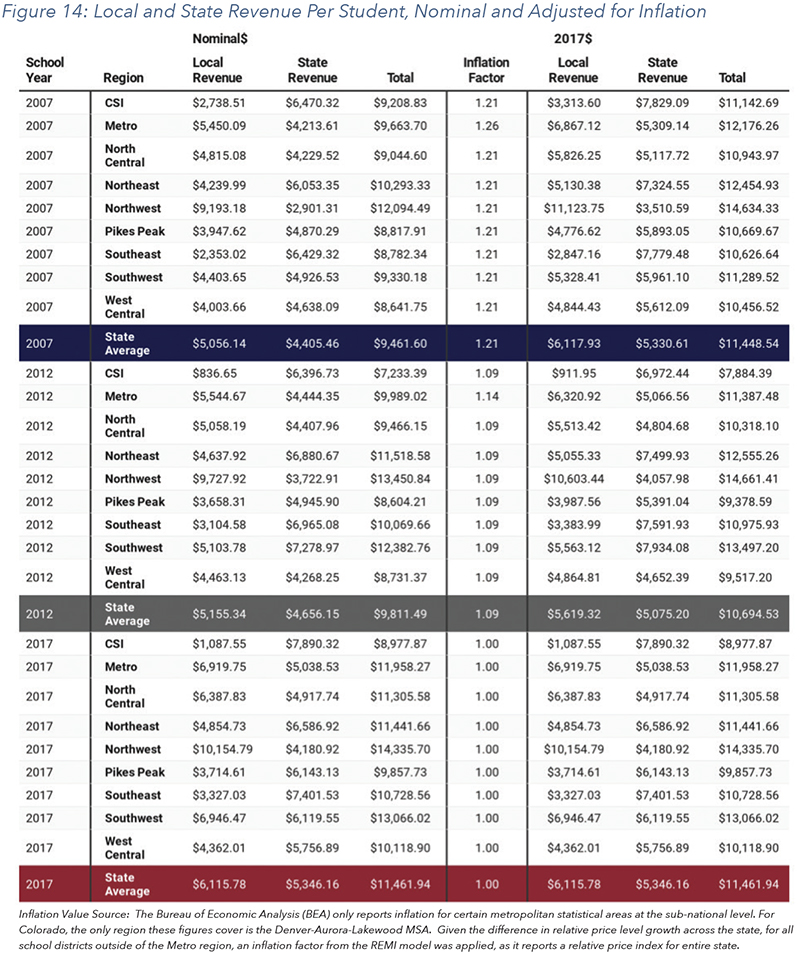
Figure 14 displays local and state revenue per funded pupil in nominal and real dollars by region. When looking at nominal dollars, local revenue per funded pupil went up in most regions from 2007 to 2017 except for CSI and the Pikes Peak region. State revenue per funded pupil in nominal dollars went up for all regions and CSI from 2007 to 2017. After adjusting for inflation, local revenue per funded pupil went down for half of the regions and CSI. In real 2017 dollars, state revenue per funded pupil also went down for half of the regions. It remained nearly flat for CSI and for the state average.
TRENDS IN EDUCATION SPENDING
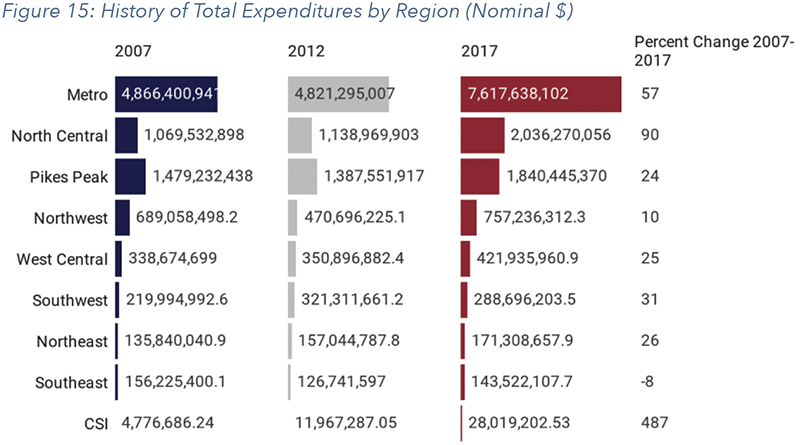
Not adjusting for inflation, total expenditures have increased across all regions from 2007 to 2017 except for the Southeast, which saw a significant decline in its student population. CSI, which had exponential student growth, saw its expenditures increase 487 percent from 2007 to 2017. The Metro and North Central regions also had large increases in expenditures.
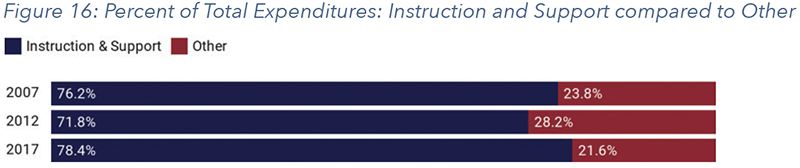
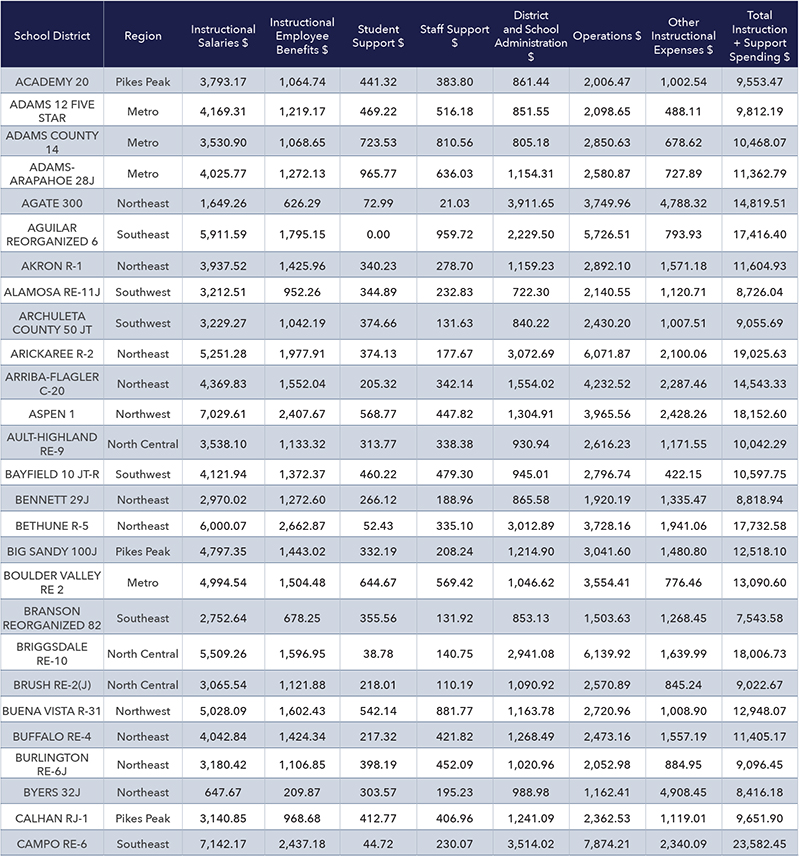
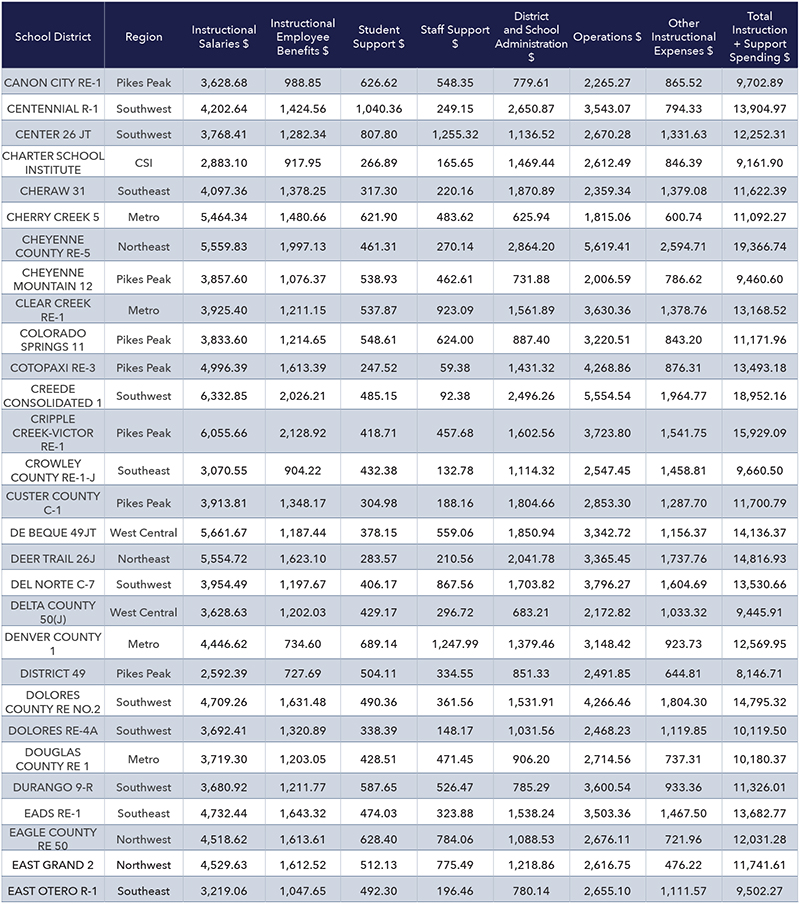
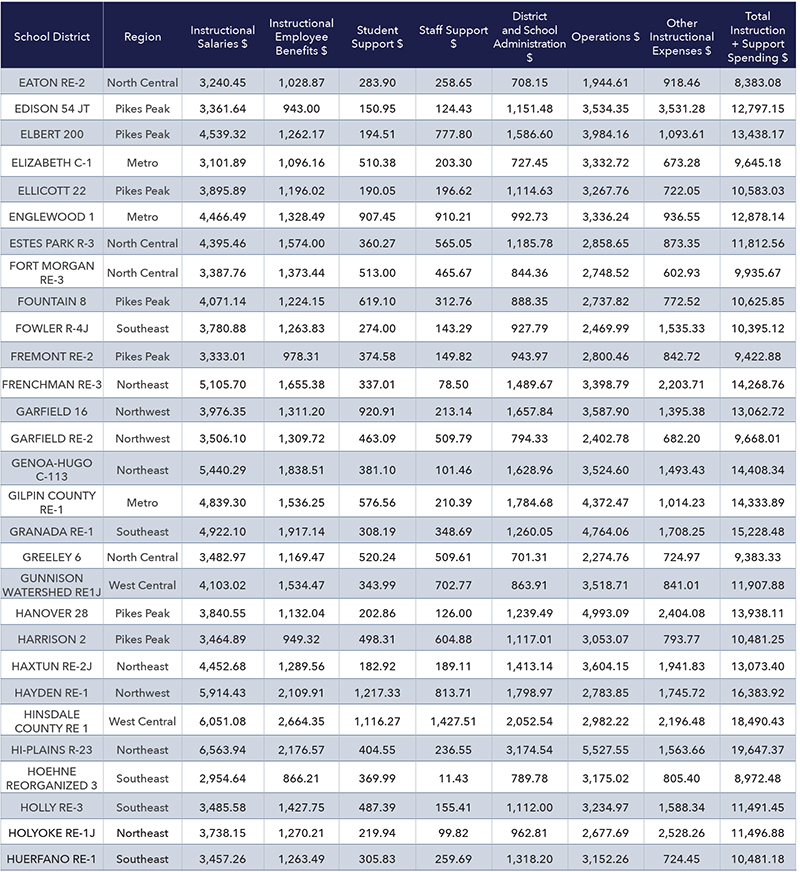
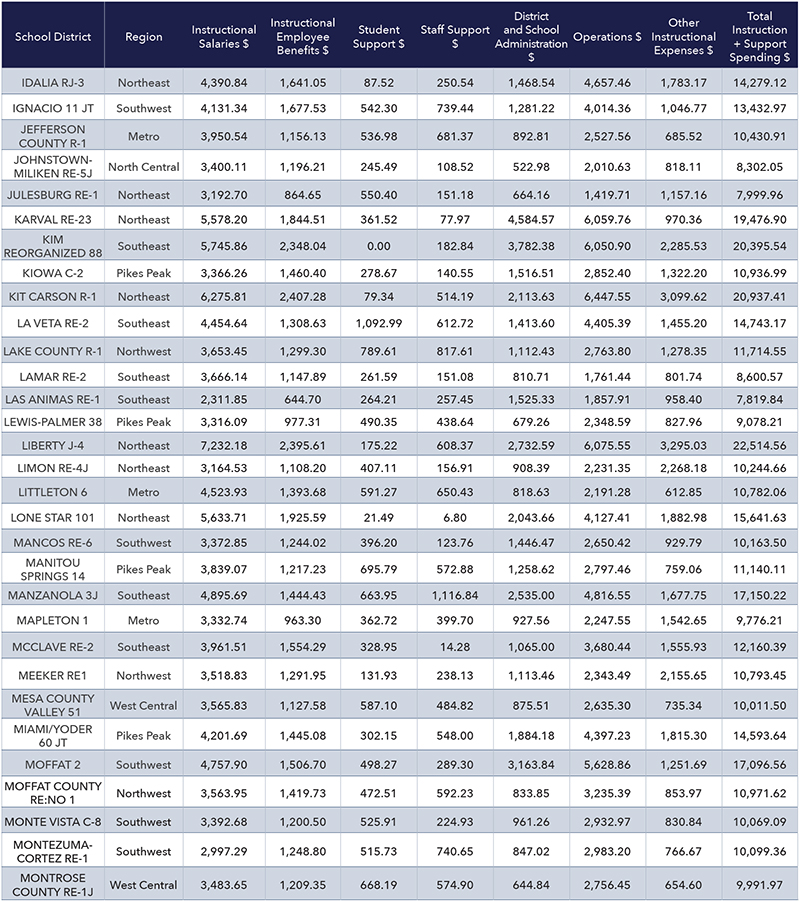
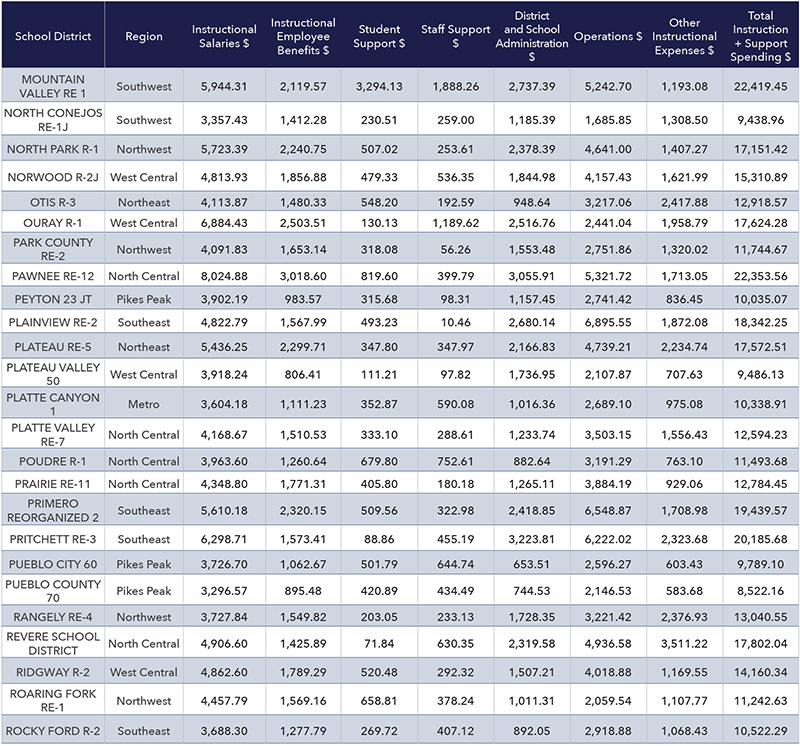
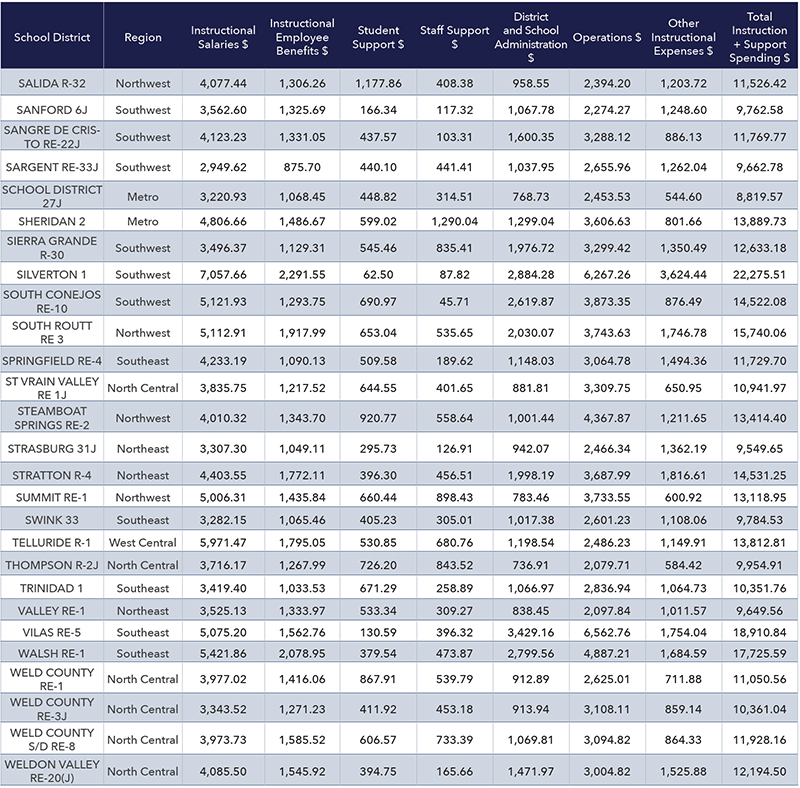
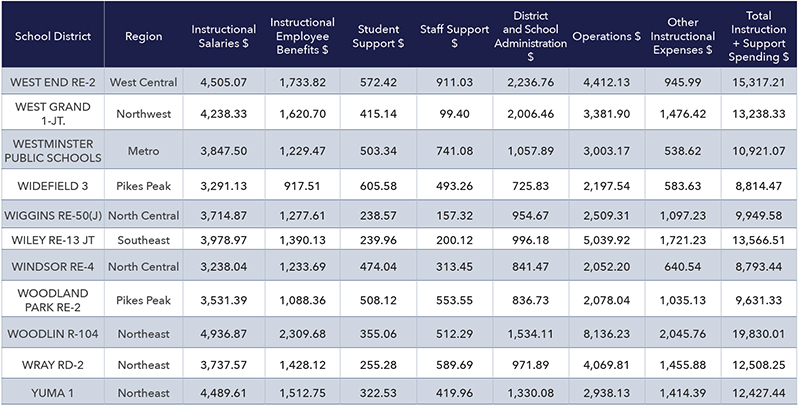
High-level expenditure categories include Instruction, Support and Other. As shown in Figure 16, instruction and support spending accounted for 78 percent of total expenditures in 2017 compared to 22 percent for other spending.
Instructional expenditures include items such as salaries and benefits for instructional staff, supplies, materials and purchased services. Support expenditures include salaries and benefits for school and district administrators, support for students (e.g. guidance counseling, health and psychology services), and support for staff (e.g. professional development). Operational expenses including transportation, maintenance, and food services are also included under the broader Support category.
The Other category consists of construction and facilities acquisitions (e.g. acquiring land and buildings; constructing or remodeling buildings; improving sites), debt (payments of principal or interest; debt issuance costs; fund transfers), and refinancing. Expenditures in the Other category are not typically associated with the day-to-day operation of school activities and are excluded from the analysis in the remainder of this section.
INSTRUCTION AND SUPPORT EXPENDITURES
Figure 17: Inflation Adjusted (2017 Dollars) Instruction and Support Expenditures, Per Funded Pupil
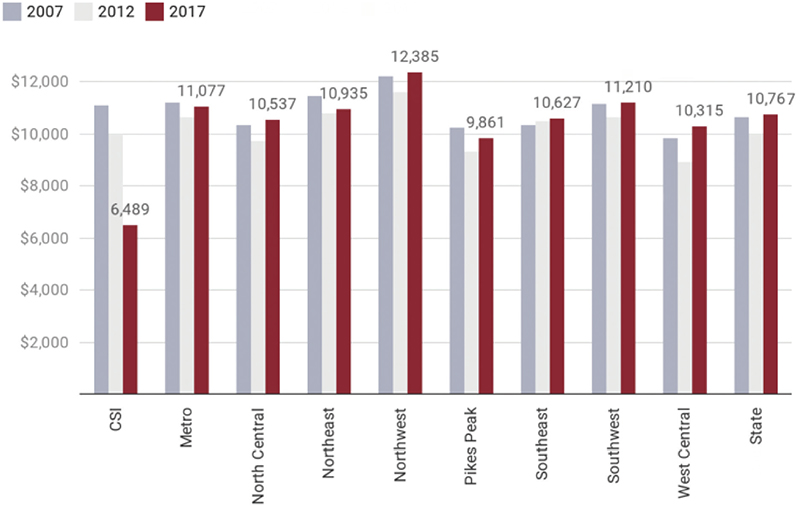
In 2017, per pupil spending on instruction and support ranged from a low of $6,489 for CSI to an average high of $12,385 for districts in the Northwest region.
Looking from 2007 to 2017, per pupil spending on instruction and support in real dollars took a dip in most regions in 2012 and rebounded in 2017 to be on par with 2007 spending levels, with a few exceptions. Spending in the Northeast and Pikes Peak regions remains slightly below that of 2007. CSI, which saw a rapid enrollment expansion over the past decade, showed a large decline when considering expenditures on a per pupil basis.
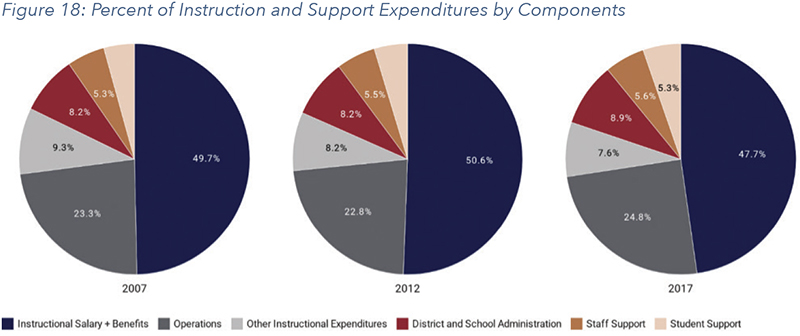
While instructional salaries and benefits saw a slight increase as a share of total spending from 2007 to 2017, the category saw a drop in its share of spending from 2012 to 2017. Statewide, the percent of spending allocated to instructional salaries and benefits declined two percentage points in the span of the decade from 2007 to 2017. This affects a wide range of instructional positions, including not only teachers but also reading and math interventionists, paraprofessionals, nurses, psychologists, speech pathologists and others.
Operations, administration and supports for students and staff all saw increases as a share of total spending from 2007-2017. The other instructional expenditures category, which includes purchased services, supplies and materials, capital outlay and other miscellaneous spending saw a decline in its share of spending.
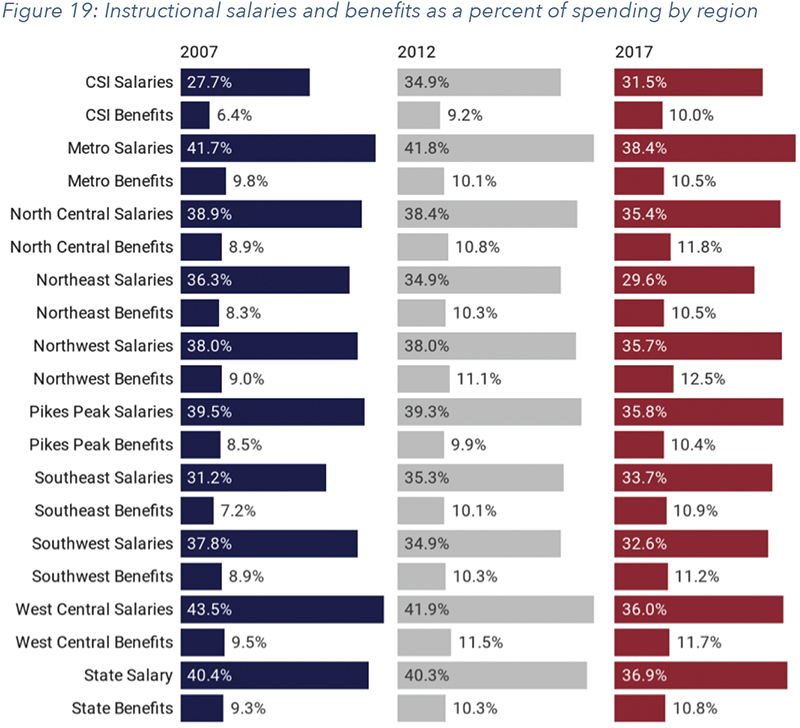
From 2007 to 2017, all regions and CSI saw benefits for instructional staff grow as a share of expenditures. During the same time period, all regions except for the Southeast region and CSI spent less on salaries as a share of total expenditures.
Statewide, as depicted in Figure 18, salaries and benefits when combined saw a decrease in the share of total spending. As shown in Figure 19, when looking at salaries and benefits separately, salaries decreased while benefits increased as a share of total spending. This phenomenon relates back to the trend described earlier in the study, that as the funded status of K-12 education’s retirement system suffers, the increases in contributions made to solve the problem, come at the expense of other spending priorities.
EXPENDITURE EXAMPLES
Instructional Salaries + Benefits: Includes teachers (both permanent and temporary), paraprofessionals, reading and math interventionists, paraprofessionals, nurses, psychologists, speech pathologists
Operations: Transportation, operations and maintenance, food services, research and data analysis services
Student support: Guidance, health, and psychology services
Staff support: professional development, instructional technology
District and School Administration: Central office services, school principal and department chair services
Other Instructional Expenditures: Purchased services, supplies and materials, capital outlay
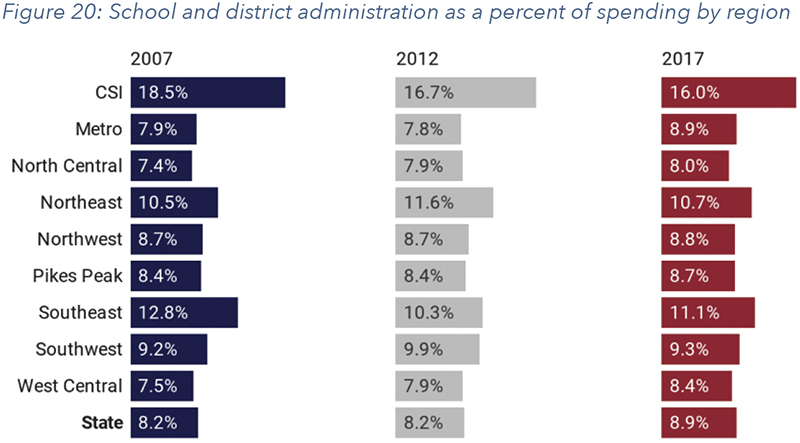
Additionally, school and district administrative spending as a share of expenditures increased in all regions except for the Southeast region and CSI10 (see Figure 20). Administrative functions are designed to support schools and students, but the increasing share of expenditures devoted to administrative functions results in fewer dollars being available for instructor salaries and classroom support.
TRENDS IN TEACHER SALARIES AND TURNOVER
Recently, the subject of teacher pay has been prominent in public discourse in Colorado and across the country. Denver Public Schools experienced its first teacher strike in 25 years, which centered on teacher pay. Strikes also occurred in Los Angeles, Oakland, and Nashville and statewide in West Virginia, Arizona, Oklahoma in the last two years.
Research consistently points to teachers as the most important school-based factor affecting student success; they are the front-line workers who have the most influence over our children’s education.11 It is critical to ensure that teachers are appropriately compensated. Schools need to pay competitive wages to attract high quality teacher and promote student success. Given that public education is largely dependent on taxpayer dollars, it is also important to maximize the cost efficiency of the system and strategically target resources where most needed.
The issue of whether teachers are adequately compensated is confounded by several factors. Areas with higher costs of living necessitate higher salaries. Harder to staff subject areas such as mathematics and science may demand higher wages.12 Turnaround schools are difficult environments to teach in and research shows offering higher salaries helps boost retention, which may in turn help schools improve quicker.13 Offering higher salaries in rural areas could help attract teachers who otherwise would seek out positions in suburban and urban areas.
TEACHER SALARIES
The following data highlight trends in teacher salaries by region and among school districts in the Metro Denver area to demonstrate local differences.
In 2016-17, the state average teacher salary was $51,810. According to the National Education Association’s comparison of average teacher salaries across states, that results in Colorado ranking 31st in teacher pay.14 The national average for teacher salaries in 2017 was $59,539—about 13 percent higher than Colorado’s average.
The state average, however, masks the wide variation in salaries that occurs at the regional and school district level. Urban and suburban salaries outpace rural salaries even as the cost of living in the rural areas has increased. As displayed in Figure 21, the average salary for the metro region in 2017 was $56,621, which is 39 percent greater than the Southeast region’s average salary of $38,157.
Teacher salaries in 95 percent of the state’s rural districts are below the cost of living for their area, according to the teacher shortage report released by Colorado’s K-12 and higher education agencies. The report states that the wage disparity is negatively affecting hiring and retention efforts in rural areas.15
Even within the Metro region, average salary levels vary widely. School districts have discretion over how to allocate their state funds, including how much to pay their teachers (sometimes set through a collective bargaining agreement) and whether to prioritize teacher pay or other expenditures such as administrator pay, operations or support services.
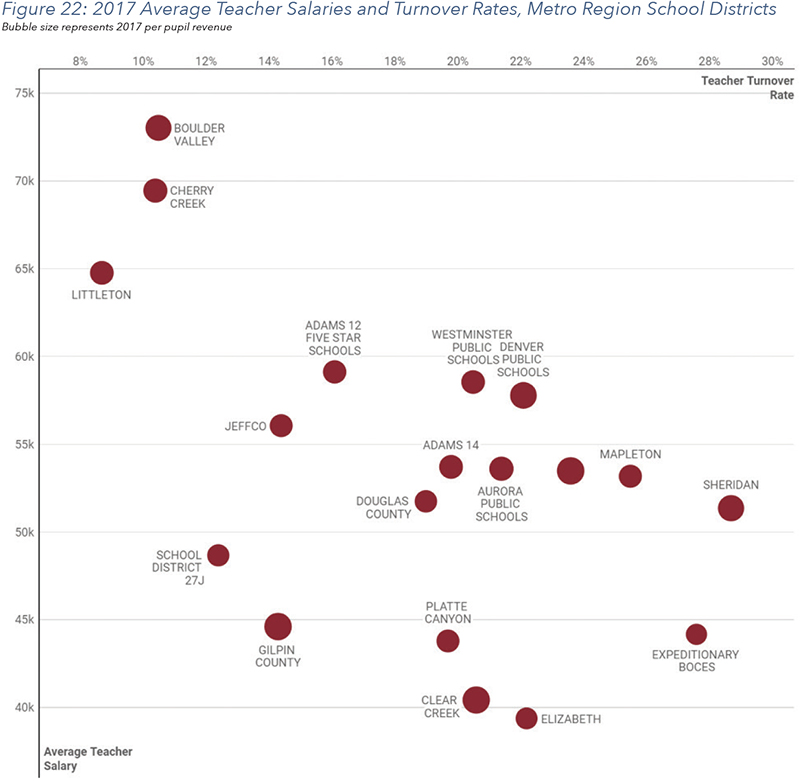
Figure 22 displays average salaries and turnover rates for Metro region districts. Boulder had the highest average salary in 2017 while districts that are on the rural outskirts of the metro region had much lower average salaries.
Turnover rates can affect average teacher salary levels in conflicting ways. Districts with high turnover may be hiring younger teachers each year who are being paid the lower starting salary wage, thus driving down the average. Mapleton Public Schools had an average salary in 2017 that is on the lower end of the spectrum for districts near Denver; but Mapleton also had 25.5 percent turnover, which is 7.5 percentage points above the average for the region. That average salary does not represent the salary levels of their veteran teachers who do receive some of the highestwages in the metro area. Boulder, Cherry Creek and Littleton have the highest average salariesand have low turnover, which could reflect having a more veteran workforce. The data could also reflect, however, that teachers are motivated by the higher salaries to remain in those districts.
Further, there are districts with low turnover and low wages, such as School District 27J, which serves the city of Brighton and parts of Thornton and Commerce City, which supports the fact thatthere is not a statistically significant correlation between turnover rates and salaries. The average teacher wage at School District 27J was $48,640 in 2017, nearly $8,000 below the Metro region’s average and $5,000 below neighboring Adams 14 School District’s average. Despite their low average wages, teachers are leaving positions in School District 27J at a lower rate than 15 of the districts in the Metro region.
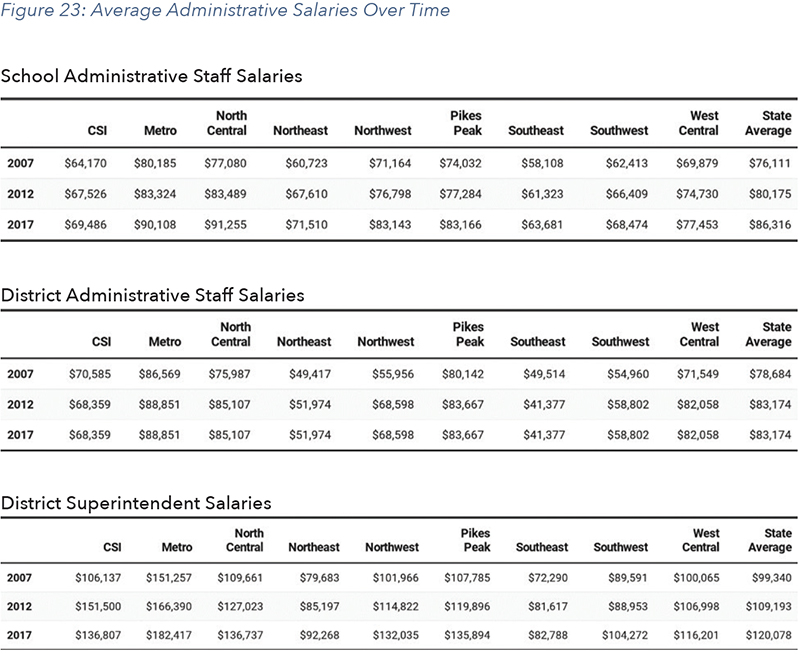
ADMINISTRATOR SALARIES
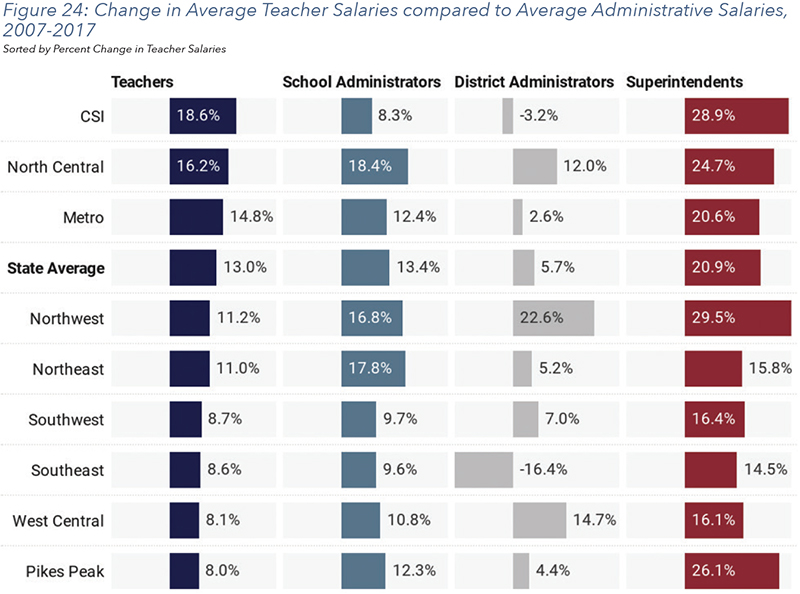
Figures 23 displays average administrative salaries over time and Figure 24 compares the change between 2007 and 2017 for both teacher and administrative salaries. The school administrator category includes principals and assistant principals. The district administrator group includes various central office positions including assistant or deputy superintendents; executive directors; non-instructional and instructional managers, directors, program coordinators and supervisors; and BOCES directors.
In all regions except for the Northeast, superintendent salaries grew the most from 2007 to 2017, ranging from an increase of 15.8 percent in the Northeast to 29.5 percent growth in the Northwest. The percent change in the other salary groups varies among the regions. In the Metro region and CSI, teachers had the next largest increase in salaries following superintendents. In the Northwest and the West Central region, district administrative staff had the second highest salary growth. Principals and assistant principals in the North Central, Pikes Peak, Southeast and Southwest regions saw their wages increase the most after superintendents; teachers were next after school administrators in salary growth in these regions. The increase in average teacher salaries from 2007 to 2017 ranged from a low of 8.0 percent in the Pikes Peak region to a high of 18.6 percent at CSI.
TEACHER TURNOVER
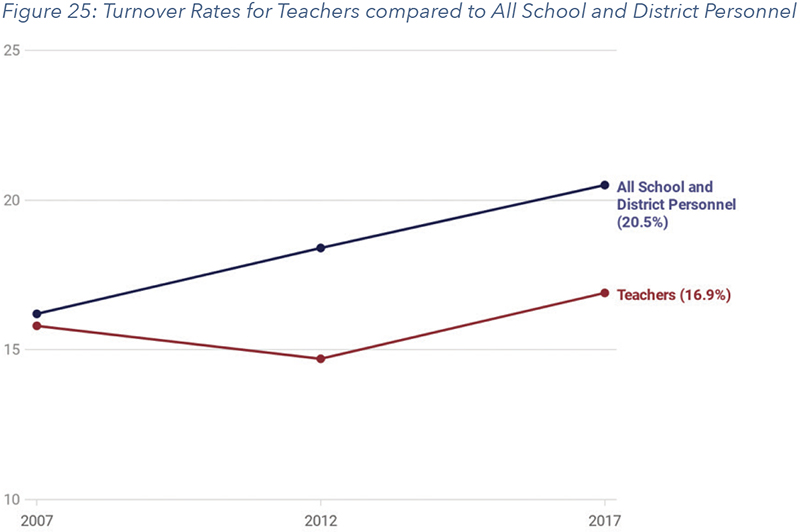
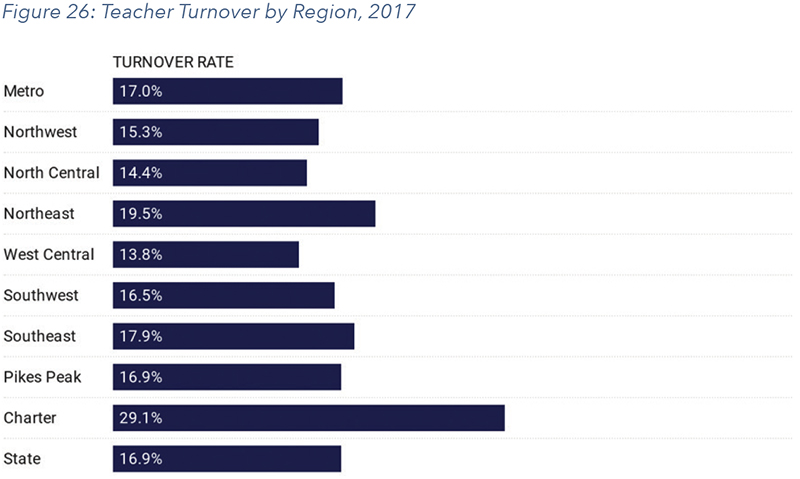
As depicted in Figure 25, average turnover rates for teachers statewide were lower than the average turnover rates for all district and school employees in 2007, 2012 and 2017. Statewide, about 16.9 percent of teachers left their positions in 2017 compared with 20.5 percent of all personnel. Figure 26 breaks out the 2017 teacher turnover rates by region. The West Central region had the lowest teacher turnover rates at 13.8 percent while CSI had the highest turnover at 29.1 percent.
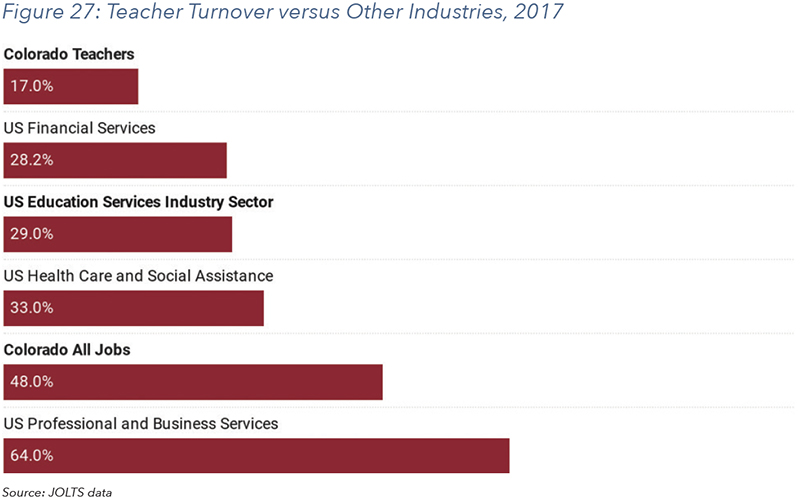
The average turnover rate for Colorado employees in all other industries is nearly three times the turnover rate for teachers—48 percent compared to 17 percent, respectively (see Figure 27). When comparing Colorado’s teachers to education personnel nationwide, their turnover rates are still lower—17 percent compared to 29 percent, respectively.
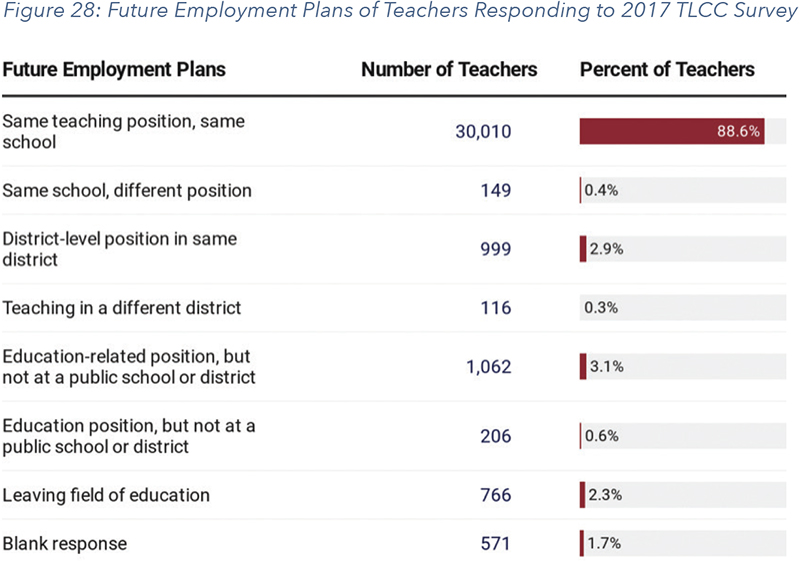
According to a 2018 survey of Colorado teachers, known as Teaching and Learning Conditions Colorado (TLCC), 88.6 percent of teachers who responded to the survey intended to remain in the same position as a teacher in their current school.16 About three percent of the respondents said they would be teaching within the same district but at a different school, while another three percent planned to teach in a different district. Only 2.3 percent of teachers responding to the survey stated they were leaving the field of education altogether.
The TLCC survey also asked teachers what most affects their decision to stay teaching at their school, and over 62 percent cited school staff or school leadership. The next most popular response was salary with 13 percent of teachers saying that was the biggest factor in their decision to remain a teacher at their current school.17 National research on teacher retention corroboratesColorado’s survey data and finds that salary, while important, is not the leading factor in why teachers choose to leave the profession.18
TEACHER SALARY AND TURNOVER SUMMARY
The variation in salary trends among regions underscores the point that school districts have discretion over how they spend their funds, and they choose to exercise that discretion in different ways. Further, data and research on teacher turnover highlights that while salaries are important, it is more important to focus on establishing a positive school culture and developing strong school leaders. Making generalizations that all teachers across the state are underpaid or that the teaching profession as a whole is seeing high levels of turnover does not reflect the data and prevents thoughtful, targeted policy solutions from arising.
CONCLUSION
This study analyzes trends in K-12 revenues and spending at the state level and by region to build a common understanding of how public education is funded in Colorado. The study also looks at teacher salaries and turnover rates and considers how both factors differ across the state. The goal is to provide baseline data and analysis to ground ongoing discussions about public education funding in facts.
The analysis and findings presented here make a case for careful thought to be given to any policies or ballot initiatives focused on K-12 education funding. The current funding system has several serious flaws to its structure and increasing revenues without addressing those flaws is unlikely to improve student outcomes. As the law stands now, funding for K-12 education is collected from taxpayers and distributed to school districts in an inequitable manner, and simply adding more dollars into the system will only perpetuate those inequities.
Similarly, trends around teacher pay and turnover are not easily summarized at the state level. Looking at salary and turnover rates at the regional and district level reveals a great deal of variation. Some districts are struggling to pay their teachers well while other districts have salaries far above national averages. Thus, policy solutions need to be thoughtful and targeted to those school districts who are facing the greatest challenges.
Education is, and should continue to be, a locally controlled enterprise. Those who are closest to students have the best information about what learning environments are right for their children. At the same time, understanding the differences in education funding and teacher pay that arise at the regional and school district level will allow for more informed policy conversations. With this data, Coloradoans can develop solutions to create an equitable funding system that attracts the best teaching talent and provides high-quality educational experiences for all students.
APPENDIX A: LIST OF SCHOOL DISTRICTS BY REGION
Region School / District Name
Metro / ADAMS 12 FIVE STAR SCHOOLS
Metro / ADAMS COUNTY 14
Metro / ADAMS-ARAPAHOE 28J
Metro / BOULDER VALLEY RE 2
Metro / CHERRY CREEK 5
Metro / CLEAR CREEK RE-1
Metro / DENVER COUNTY 1
Metro / DOUGLAS COUNTY RE 1
Metro / ELIZABETH SCHOOL DISTRICT
Metro / ENGLEWOOD 1
Metro / GILPIN COUNTY RE-1
Metro / JEFFERSON COUNTY R-1
Metro / LITTLETON 6
Metro / MAPLETON 1
Metro / PLATTE CANYON 1
Metro / SCHOOL DISTRICT 27J
Metro / SHERIDAN 2
Metro / WESTMINSTER PUBLIC SCHOOLS
North Central / AULT-HIGHLAND RE-9
North Central / BRIGGSDALE RE-10
North Central / BRUSH RE-2(J)
North Central / EATON RE-2
North Central / ESTES PARK R-3
North Central / FORT MORGAN RE-3
North Central / GREELEY 6
North Central / JOHNSTOWN-MILLIKEN RE-5J
North Central / PAWNEE RE-12
North Central / PLATTE VALLEY RE-7
North Central / POUDRE R-1
North Central / PRAIRIE RE-11
North Central / ST VRAIN VALLEY RE 1J
North Central / THOMPSON R2-J
North Central / WELD COUNTY RE-1
North Central / WELD COUNTY S/D RE-8
North Central / WELD COUNTY SCHOOL DISTRICT RE-3J
North Central / WELDON VALLEY RE-20(J)
North Central / WIGGINS RE-50(J)
North Central / WINDSOR RE-4
Northeast / AGATE 300
Northeast / AKRON R-1
Northeast / ARICKAREE R-2
Northeast / ARRIBA-FLAGLER C-20
Northeast / BENNETT 29J
Northeast / BETHUNE R-5
Northeast / BUFFALO RE-4J
Northeast / BURLINGTON RE-6J
Northeast / BYERS 32J
Northeast / CHEYENNE COUNTY RE-5
Northeast / DEER TRAIL 26J
Northeast / FRENCHMAN RE-3
Northeast / GENOA-HUGO C113
Northeast / HAXTUN RE-2J
Northeast / HI-PLAINS R-23
Northeast / HOLYOKE RE-1J
Northeast / IDALIA RJ-3
Northeast / JULESBURG RE-1
Northeast / KARVAL RE-23
Northeast / KIT CARSON R-1
Northeast / LIBERTY J-4
Northeast / LIMON RE-4J
Northeast / LONE STAR 101
Northeast / OTIS R-3
Northeast / PLATEAU RE-5
Northeast / REVERE SCHOOL DISTRICT
Northeast / STRASBURG 31J
Northeast / STRATTON R-4
Northeast / VALLEY RE-1
Northeast / WOODLIN R-104
Northeast / WRAY RD-2
Northeast / YUMA 1
Northwest / ASPEN 1
Northwest / BUENA VISTA R-31
Northwest / EAGLE COUNTY RE 50
Northwest / EAST GRAND 2
Northwest / GARFIELD 16
Northwest / GARFIELD RE-2
Northwest / HAYDEN RE-1
Northwest / LAKE COUNTY R-1
Northwest / MEEKER RE1
Northwest / MOFFAT COUNTY RE:NO 1
Northwest / NORTH PARK R-1
Northwest / PARK COUNTY RE-2
Northwest / RANGELY RE-4
Northwest / ROARING FORK RE-1
Northwest / SALIDA R-32
Northwest / SOUTH ROUTT RE 3
Northwest / STEAMBOAT SPRINGS RE-2
Northwest / SUMMIT RE-1
Northwest / WEST GRAND 1-JT
Pikes Peak / ACADEMY 20
Pikes Peak / BIG SANDY 100J
Pikes Peak / CALHAN RJ-1
Pikes Peak / CANON CITY RE-1
Pikes Peak / CHEYENNE MOUNTAIN 12
Pikes Peak / COLORADO SPRINGS 11
Pikes Peak / COTOPAXI RE-3
Pikes Peak / CRIPPLE CREEK-VICTOR RE-1
Pikes Peak / CUSTER COUNTY SCHOOL DISTRICT C-1
Pikes Peak / DISTRICT 49
Pikes Peak / EDISON 54 JT
Pikes Peak / ELBERT 200
Pikes Peak / ELLICOTT 22
Pikes Peak / FOUNTAIN 8
Pikes Peak / FREMONT RE-2
Pikes Peak / HANOVER 28
Pikes Peak / HARRISON 2
Pikes Peak / KIOWA C-2
Pikes Peak / LEWIS-PALMER 38
Pikes Peak / MANITOU SPRINGS 14
Pikes Peak / MIAMI/YODER 60 JT
Pikes Peak / PEYTON 23 JT
Pikes Peak / PUEBLO CITY 60
Pikes Peak / PUEBLO COUNTY 70
Pikes Peak / WIDEFIELD 3
Pikes Peak / WOODLAND PARK RE-2
Southeast / AGUILAR REORGANIZED 6
Southeast / BRANSON REORGANIZED 82
Southeast / CAMPO RE-6
Southeast / CHERAW 31
Southeast / CROWLEY COUNTY RE-1-J
Southeast / EADS RE-1
Southeast / EAST OTERO R-1
Southeast / FOWLER R-4J
Southeast / GRANADA RE-1
Southeast / HOEHNE REORGANIZED 3
Southeast / HOLLY RE-3
Southeast / HUERFANO RE-1
Southeast / KIM REORGANIZED 88
Southeast / LA VETA RE-2
Southeast / LAMAR RE-2
Southeast / LAS ANIMAS RE-1
Southeast / MANZANOLA 3J
Southeast / MC CLAVE RE-2
Southeast / PLAINVIEW RE-2
Southeast / PRIMERO REORGANIZED 2
Southeast / PRITCHETT RE-3
Southeast / ROCKY FORD R-2
Southeast / SPRINGFIELD RE-4
Southeast / SWINK 33
Southeast / TRINIDAD 1
Southeast / VILAS RE-5
Southeast / WALSH RE-1
Southeast / WILEY RE-13 JT
Southwest / ALAMOSA RE-11J
Southwest / ARCHULETA COUNTY 50 JT
Southwest / BAYFIELD 10 JT-R
Southwest / CENTENNIAL R-1
Southwest / CENTER 26 JT
Southwest / CREEDE SCHOOL DISTRICT
Southwest / DOLORES COUNTY RE NO.2
Southwest / DOLORES RE-4A
Southwest / DURANGO 9-R
Southwest / IGNACIO 11 JT
Southwest / MANCOS RE-6
Southwest / MOFFAT 2
Southwest / MONTE VISTA C-8
Southwest / MONTEZUMA-CORTEZ RE-1
Southwest / MOUNTAIN VALLEY RE 1
Southwest / NORTH CONEJOS RE-1J
Southwest / SANFORD 6J
Southwest / SANGRE DE CRISTO RE-22J
Southwest / SARGENT RE-33J
Southwest / SIERRA GRANDE R-30
Southwest / SILVERTON 1
Southwest / SOUTH CONEJOS RE-10
Southwest / UPPER RIO GRANDE SCHOOL DISTRICT C-7
West Central / DE BEQUE 49JT
West Central / DELTA COUNTY 50(J)
West Central / GUNNISON WATERSHED RE1J
West Central / HINSDALE COUNTY RE 1
West Central / MESA COUNTY VALLEY 51
West Central / MONTROSE COUNTY RE-1J
West Central / NORWOOD R-2J
West Central / OURAY R-1
West Central / PLATEAU VALLEY 50
West Central / RIDGWAY R-2
West Central / TELLURIDE R-1
West Central / WEST END RE-2
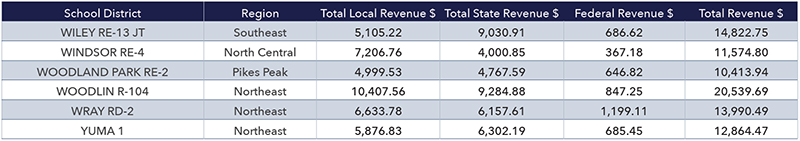
APPENDIX B: PER PUPIL REVENUES BY SCHOOL DISTRICT, 2017
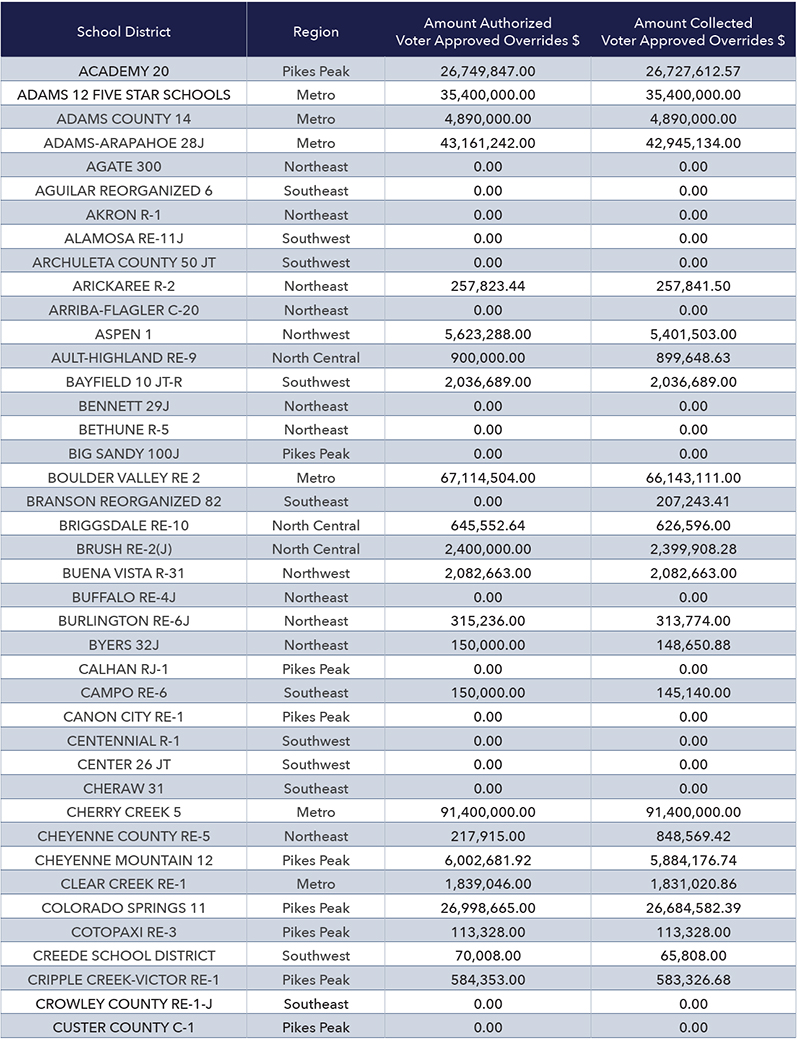
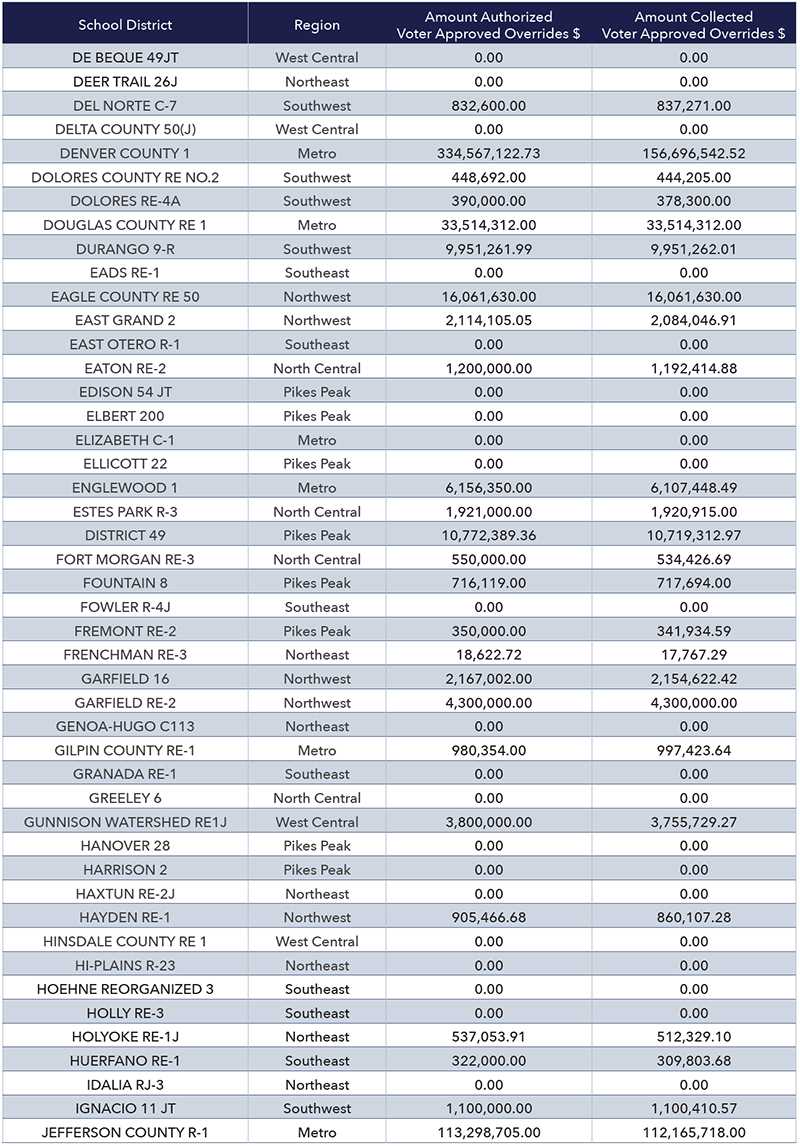
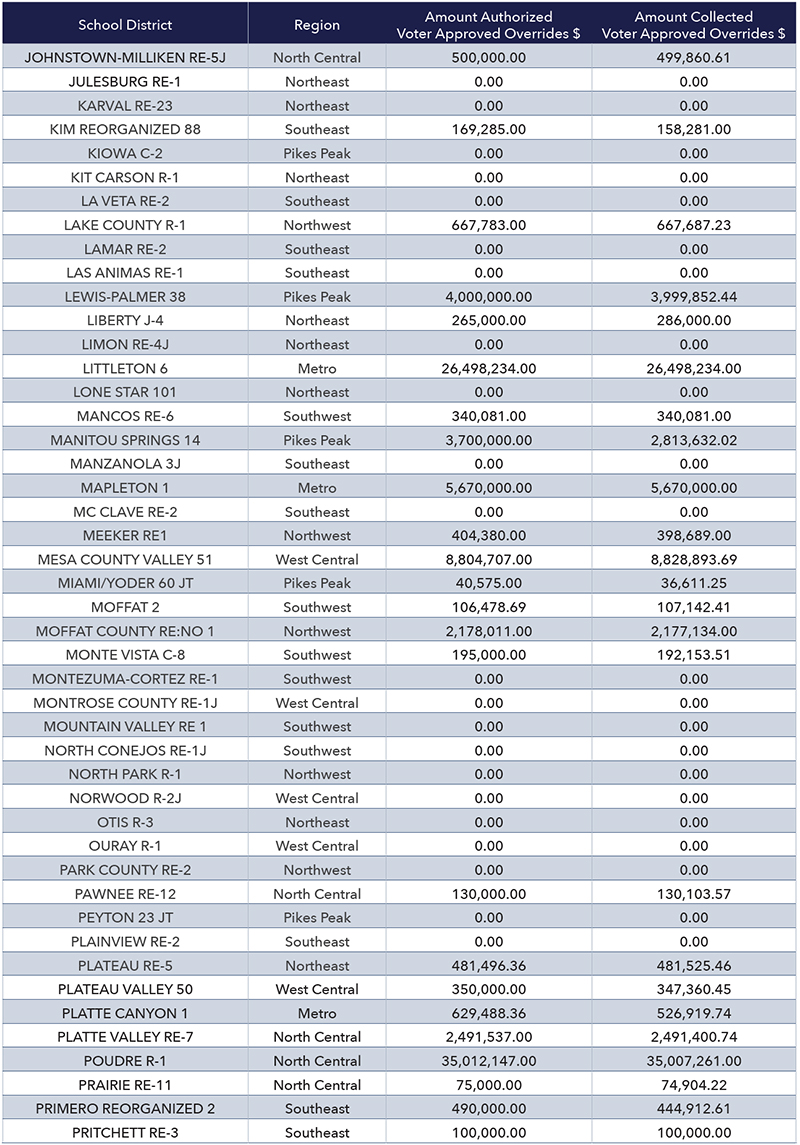
APPENDIX C: MILL LEVY OVERRIDES BY SCHOOL DISTRICT, 2017
APPENDIX D: PER PUPIL EXPENDITURES BY SCHOOL DISTRICT, 2017
Download a pdf of the full study >>
Download a pdf of a single page handout of the study >>
1 Colorado Department of Higher Education. (2019) 2019 Legislative Report: Developmental Education Needs. Retrieved from: https://highered.colorado.gov/Publications/Reports/Remedial/FY2018/2018_Remedial_relJuly2019.pdf
2 EdBuild. (2019). Dismissed: American’s most divisive borders. Retrieved from: https://edbuild.org/content/dismissed
3 Cambridge Education. (2018). Teaching and Learning Conditions Colorado Survey: Summary Report. Retrieved from: https://www.cde.state.co.us/tlcc/tlcc_cambridge_2018_summary_report
4 Joint Budget Committee. Budget in Brief Fiscal Year 2019-20. Retrieved from: https://leg.colorado.gov/sites/default/files/fy19-20bib.pdf
5 ASCENT, or Accelerating Students through Concurrent Enrollment, is a program that allows students to remain in high school for one year past 12th grade to take college courses. Per pupil funding is provided to school districts to pay for community college tuition for ASCENT students. Only those students who have earned at least 12 credit hours of postsecondary courses prior to completion of the 12th grade year are eligible for the ASCENT Program.
6 Between 2007 and 2019, the increase in the Personal Consumer Expenditure (PCE) Price Index for Colorado in the REMI model equals 23 percent and the Consumer Price Index from BEA for the Denver-Aurora-Lakewood MSA equals 30 percent.
7 Colorado PERA, Comprehensive Annual Financial Report Public Employees’ Retirement Association of Colorado For the Year Ended December 31, 2018 Embracing Change to position PERA for the future Retrieved from: https://www.copera.org/sites/default/files/documents/5-20-18.pdf
8 Baker, B.D.; Sciarra, D.G.; and Farrie, D. (2018). Is School Funding Fair? A National Report Card. Newark, NJ: Education Law Center. Retrieved from: https://drive.google.com/file/d/1BGXV3mV7aO5hr3N4MX_nBMJGKZswR-bS/view
9 EdBuild. (2019). Dismissed: American’s most divisive borders. Retrieved from: https://edbuild.org/content/dismissed
10 On a per pupil basis, CSI spends 15 percent less than other districts due to a lack of access to over $1 billion in Mill Levy Override funds. This means that a greater percentage of CSI expenditures is spent on fixed costs such as administration.
11 Hanushek, E. A. (2011). Valuing Teachers: How much is a good teacher worth? EducationNext. Vol. 11, No. 3. Retrieved from: https://www.educationnext.org/valuing-teachers/
12 Hansen, M.; Breazeale, G.; Blankenship, M. (2019). STEM teachers are most in need of additional pay. Brookings Institution. Retrieved from: http://www.brookings.edu/blog/brown-centerchalkboard/ 2019/06/17/stem-teachers-are-most-in-need-of-additional-pay/
13 Clotfelter, C.; Glennie, E.; Ladd, H.; and Vigdor, J. (2008) Would higher salaries keep teachers in high-poverty schools? Evidence from a policy intervention in North Carolina. Journal of Public Economics, Volume 92, Issues 5–6.
14 National Education Association (2019). Rankings of the States 2018 and Estimates of School Statistics 2019. Retrieved from: http://www.nea.org/assets/docs/2019%20Rankings%20and%20 Estimates%20Report.pdf
15 Colorado Department of Higher Education. (2017). Teacher Shortages Across the Nation and Colorado: Similar Issues, Varying Magnitudes. Retrieved from: https://highered.colorado.gov/Publications/Reports/teachereducation/2017/TeacherShortages_Nation_Colorado_Dec2017.pdf
16 Cambridge Education. (2018). Teaching and Learning Conditions Colorado Survey: Summary Report. Retrieved from: https://www.cde.state.co.us/tlcc/tlcc_cambridge_2018_summary_report.
17 Ibid.
18 See, e.g.: Allensworth E.; Ponisciak, S.; Mazzeo, C. (2009). The Schools Teachers Leave: Teacher Mobility in Chicago Public Schools. Chicago, IL: The Consortium on Chicago School Research. Retrieved from: https://consortium.uchicago.edu/sites/default/files/2018-10/CCSR_Teacher_Mobility.pdf.
Phillips, O. (March 30, 2015). Revolving Door of Teachers Costs Schools Billions Every Year. NPR. Retrieved from: https://www.npr.org/sections/ed/2015/03/30/395322012/the-hidden-costs-ofteacher-turnover.