

Inflation in Colorado – March 2022 Update
Inflation in the Denver metropolitan area continues to run hot, particularly for housing. Overall price levels increased 2% between January and March and 9.1% over the last 12 months. The BLS reports housing inflation of 7.9%, but home prices (not a component of CPI) have increased 20.8% YoY through January 2021. Nationally, prices increased 2% in February/March, the highest increase since December 1981, and 8.5% over the last 12 months. U.S. average hourly earnings rose only 5.6% in the last 12 months—66% of the increase in inflation. Wage growth is not keeping up with inflation and Coloradans’ budgets are being squeezed, causing many people to return to the labor force. The Federal Reserve is preparing to combat inflation with a series of rate hikes throughout the year and a reduction in bond purchases (quantitative easing). Historically, it has been difficult for the Fed to wrestle inflation out of the economy without causing a recession.
Inflation in Metro Denver was 2% between January and March and 9.1% over the Last 12 Months (BLS CPI Survey)[i]
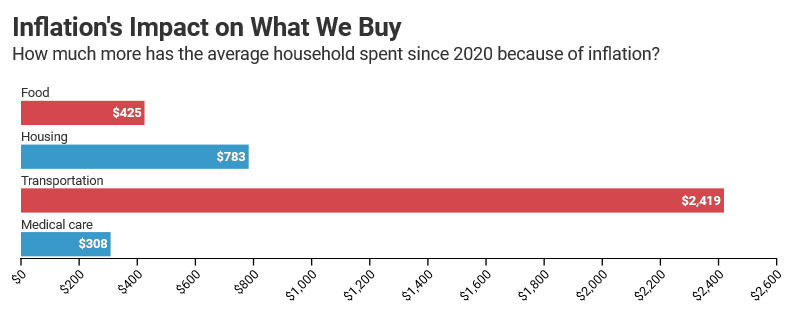
- The average Colorado household spent $4,467 more since 2020 because of inflation.[ii]
- Inflation in metro Denver over the past 12 months was 0.6 percentage points higher than the national average of 8.5%.
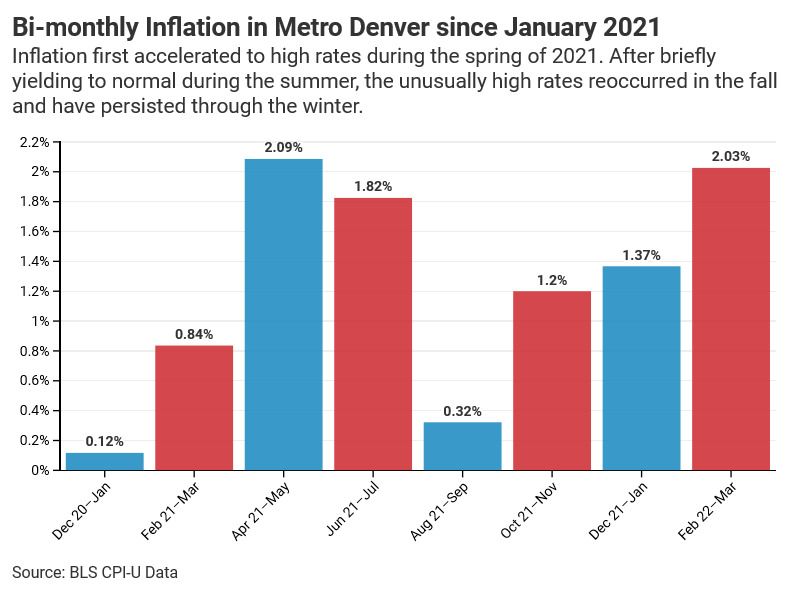
- Since March 2021, when the period of high inflation began, average bi-monthly inflation in metro Denver has been 230% higher than its historical average of .42%.
- Of the 23 urban consumer price indices tracked by the BLS, Denver–Aurora–Lakewood’s ranks 8th in total growth since the end of 2020.
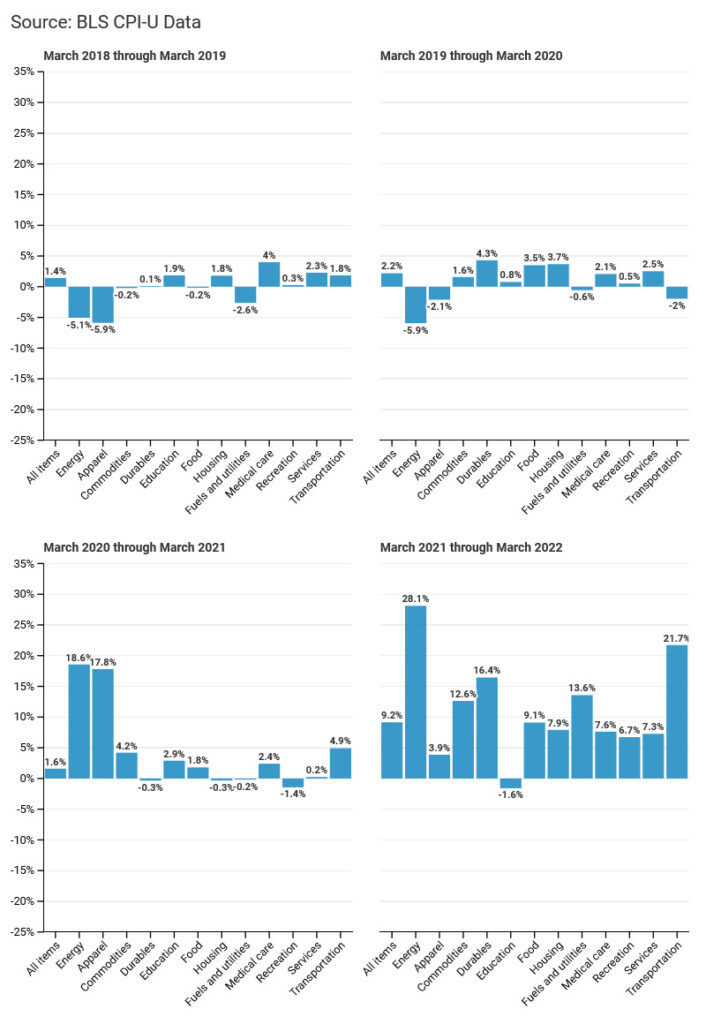
- Average annual inflation between 2010 and 2020 was 2.51%. Since March 2021, all categorized prices in the graphs below except for education have grown by more than that.
- The two price categories that grew the fastest over the last 12 months were energy and transportation, which grew by 28.1% and 21.7%, respectively.
Price Changes in Metro Denver over the Previous Year
Feature: The Growth in Home Prices Has Outpaced Record-high Inflation
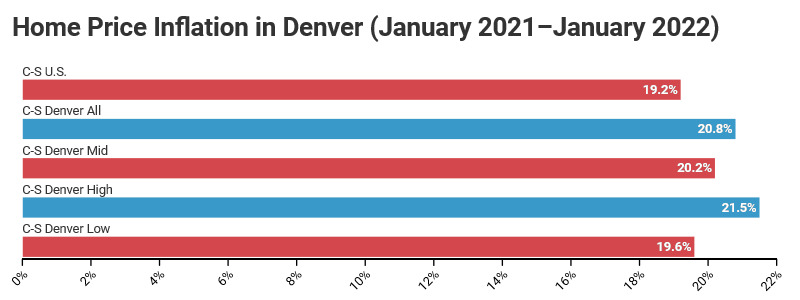
The BLS reports inflation related to housing, but this figure tends to be misleading because the CPI views housing units as capital (or investment) goods and not as consumption items like food or gasoline. Rent paid for housing is considered consumption, and the BLS reports inflation for rents. The latest CPI figures report housing inflation as 7.9% over the past 12 months; however, for those consumers who wish to purchase a housing unit, prices in Colorado have increased 20.8% from January 2021 to January 2022 as measured by the Case-Shiller Denver Home Price Index (the latest data available). Housing prices in the lowest, middle, and highest tiers have increased 19.6%, 20.2%, and 21.5% respectively, and are all higher than the national rate of 19.2%.
© 2022 Common Sense Institute.
[i] https://www.bls.gov/cpi/
[ii] This figure corresponds to the data in the first graph. These are generated by distributing the consumer expenditure estimates from https://www.bls.gov/regions/mountain-plains/news-release/consumerexpenditures_denver.htm across individual months, weighting them according to their corresponding CPI levels, and adjusting them according to the latter’s growth history.