

In 2021, inflation in the Denver metropolitan area was the highest it’s ever been since the Bureau of Labor Statistics began tracking it in 1986. The largest two-month period of inflation occurred in late spring and a resurgence at the end of the year through January added an additional 2.6%. High inflation erodes savings and increases the costs of daily commutes, groceries, and other consumer goods. This threatens the financial health of Colorado citizens and the strength and swiftness of the state’s ongoing economic recovery.
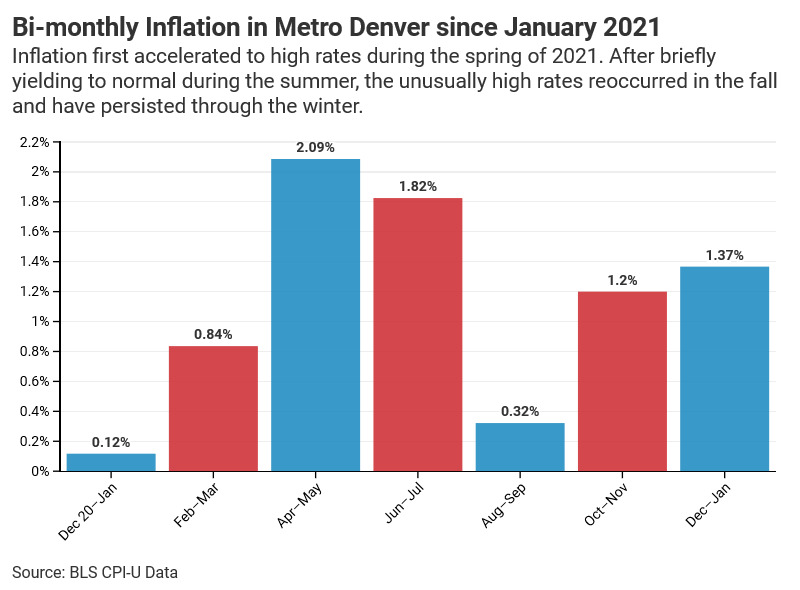
Inflation in Metro Denver was 1.4% between November and January and 7.9% over the Last 12 Months – Jan ’21 through Jan ’22 – (BLS CPI Survey)[i]
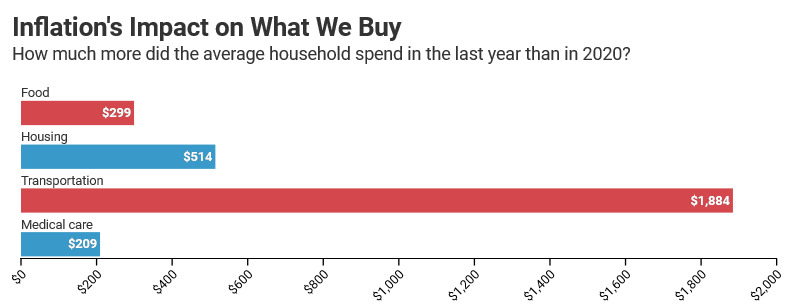
- The average Colorado household spent a combined $2,902 more on food, housing, transportation, medical care, recreation, and education in past 12 months than in 2020.[ii] Together, these items account for just under 80% of a household’s total expenditure.[iii]
- Inflation in metro Denver over the past 12 months was .4 percentage points higher than the national average of 7.5%.
- Inflation has been consistently high since spiking in March 2021 except during August and September.
- Of the 23 urban consumer price indices tracked by the BLS, Denver-Aurora-Lakewood’s ranks 8th in total growth since the end of 2020.
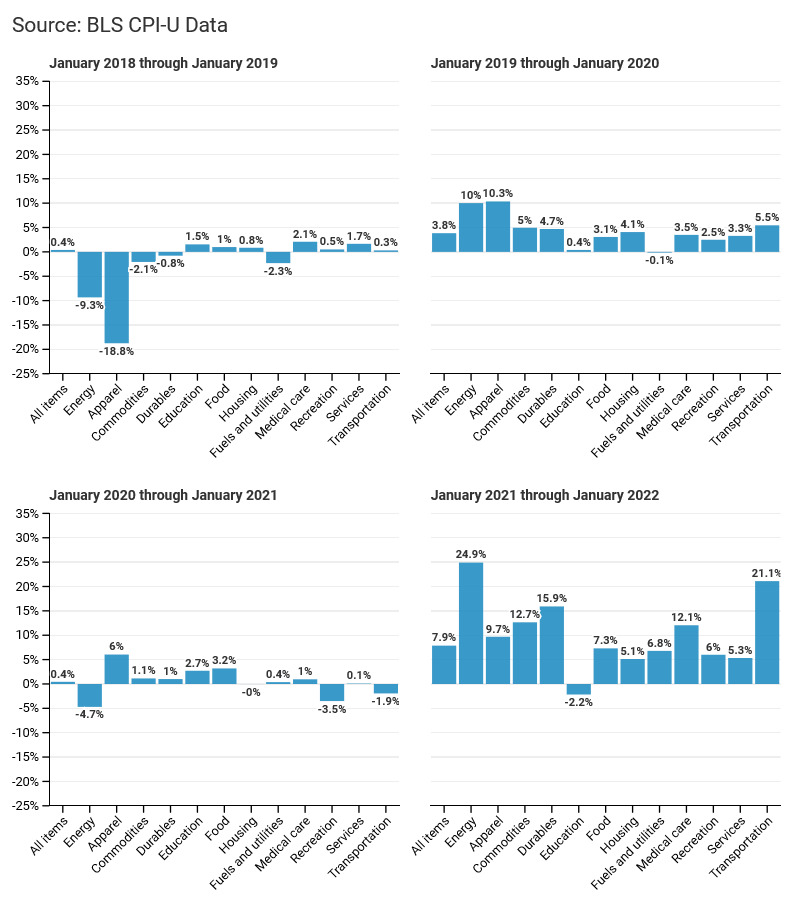
- Average annual inflation between 2010 and 2019 was 2.85%. Since January 2021, all categorized prices in the graphs below except for education have grown by more than that.
- The two price categories that grew the fastest over the last 12 months were energy and transportation, which grew by 24.9% and 21.1%, respectively.
Price Changes in Metro Denver over the Previous Year
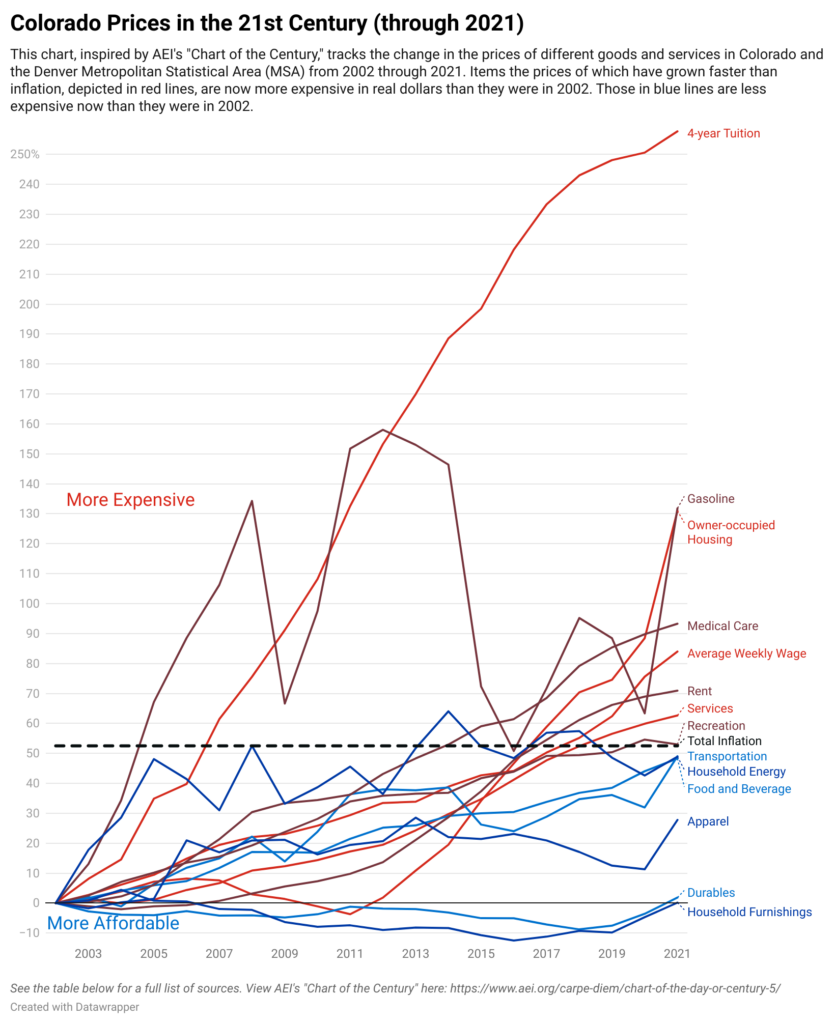
Annual Feature: Metro Denver Prices in the 21st Century
The chart below, inspired by the American Enterprise Institute’s “Chart of the Century,” displays 19 years of changes in wages, inflation, and the prices of consumer goods and services in the Denver metropolitan area. As real wages have risen locally, most durable and nondurable goods have become more affordable; conversely, the rising costs of housing, health care, and higher education have increasingly crowded out more and more of every dollar of spending. This chart includes some items which are representative of a statewide average and not just the Denver MSA. Similarly, the price changes reported at the Denver MSA level may not be fully representative of actual price changes in regions across Colorado that are outside of the MSA.
![]()
[i] https://www.bls.gov/cpi/
[ii] This figure corresponds to the data in the first graph. These are generated by distributing the consumer expenditure estimates from https://www.bls.gov/regions/mountain-plains/news-release/consumerexpenditures_denver.htm across individual months, weighting them according to their corresponding CPI levels, and adjusting them according to the latter’s growth history.
[iii] https://www.bls.gov/regions/mountain-plains/news-release/consumerexpenditures_denver.htm
© 2022 Common Sense Institute