

ABOUT THE AUTHOR
Steven L. Byers, Ph.D. is the senior economist with the Common Sense Institute. Steven’s Experience as an economist spans twenty-three years, including work at federal regulatory agencies (SEC, CFTC, PCAOB) and quantitative economic analysis supporting international trade litigation cases brought before the U.S. International Trade Commission.
ABOUT COMMON SENSE INSTITUTE
Common Sense Institute is a non-partisan research organization dedicated to the protection and promotion of our economy. As a leading voice for free enterprise, CSI’s mission is to examine the fiscal impacts of policies, laws and educate voters on issues that impact their lives.
CSI’s founders were a concerned group of business and community leaders who observed that divisive partisanship was overwhelming policymaking and believed that sound economic analysis could help people make fact-based and common sense decisions.
CSI employs rigorous research techniques and dynamic modeling to evaluate the potential impact of these measures on the Colorado economy and individual opportunity.
TEAMS & FELLOWS STATEMENT
CSI is committed to independent, in-depth research that examines the impacts of policies, initiatives, and proposed laws so that Coloradans are educated and informed on issues impacting their lives. CSI’s commitment to institutional independence is rooted in the individual independence of our researchers, economists, and fellows. At the core of CSI’s mission is belief in the power of the free enterprise system. CSI’s work explores ideas that protect and promote jobs and the economy, and the CSI team and fellows take part in this pursuit with academic freedom. The CSI team’s work is guided by data-driven research and evidence.
The views and opinions of fellows do not reflect the institutional views of CSI. CSI operates independently of any political party and does not take positions.
Introduction
The cost of housing in Fort Collins, Colorado has made it a more expensive place to live. Since 2015, the price of housing in Fort Collins has exceeded the U.S. average though it is lower than the state average. Significant fluctuations in demand during the pandemic, coupled with a growing supply shortage due to lagging development over the last decade, have created conditions resulting in an imbalance between the demand for and supply of housing. Consensus expectations for mortgage rates are that they will remain elevated for the foreseeable future as the Federal Reserve tackles inflation. Higher mortgage rates have raised the cost of new home purchases, undoubtedly slowing demand. While this may provide some relief, new housing unit permitting has fallen in in the last four years and there are some indications that actual home completions will decline as builders gauge the impact of a slowing economy on housing demand.
This report analyzes trends in affordability and estimates whether there is a deficit or surplus in housing units in Fort Collins.
Key Findings
- Due to elevated prices and rising interest rates, the affordability of purchasing a home in Fort Collins is at the lowest point in more than 20 years. In just the past 8 years, the cost of purchasing a home has nearly doubled.
- Household incomes have not kept pace with rising housing costs. Between June 2015 and June 2023, the average hourly wage increased 35% from $22.41 to $30.23. However, due to the rapidly increasing cost of housing, the number of hours of work required to cover the median mortgage payment increased from 69 hours to 120 hours, a 73% increase as seen in Figure 5.
- Between approximately 1,580 and 2,197 permits are needed annually through 2028 to close the city housing supply deficit and meet the demands of future population growth. Projected permitting for new housing has been tapering off since 2019 as home builders reassess the demand for housing in a higher interest rate environment. Based on permit data through June 2023, Fort Collins is projected to be between 395 and 1,013 permits short of the required annual amount to close the deficit plus new housing demand by 2028. Recent reports indicate that the homebuilding market may be contracting. To avoid a similar collapse in new home building that followed the last recession, permitting must remain at elevated levels for the next several years.
- 57% percent of permits issued in Fort Collins since 2011 are for multi-family structures.
- Homebuilders’ confidence has declined 41% since a recent high in February 2022. After falling for 9 straight months from February 2022 to December 2022 to 25, the National Association of Home Builders/Wells Fargo Housing Market Index for the Western Region is now 54 indicating an increase in home builder confidence.
- Home affordability has decreased by 82.5% since 2015.
Declining Affordability as Measured by the Homebuyer Misery Index
Figure 1 shows the “Fort Collins Homebuyer Misery Index”, as developed by CSI (shown by black line). The index captures the impact of housing prices (shown by redline) and mortgage rates (shown by blue line) on the affordability of purchasing a new home. The homebuyer index is based on 30-year mortgage rates and the Zillow Home Price Data for Fort Collins, see figure 1.[i][ii] The mortgage rates and average home prices are combined and converted into an index with 2000 as its base year. The significant increase in the index value over the last two-and-a-half years reflects the drastic decrease in home affordability as home prices and mortgage rates have increased.
Figure 1 – Fort Collins, CO. Homebuyer Misery Index
Figure 2 shows the change in the Homebuyer Misery Index through July 2023 relative to prior years end. Thirty-six percent of the decline in affordability from 2015 occurred since 2020 alone, as both home price and mortgage rates have grown.
Figure 2 – Change in Housing Affordability in Fort Collins, CO.
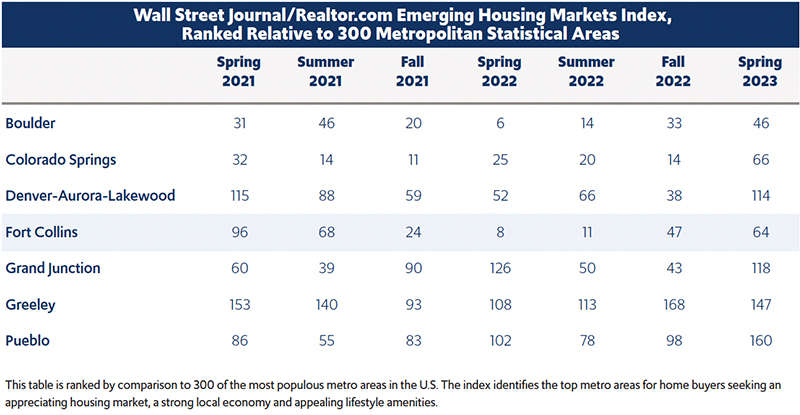
The Wall Street Journal and Realtors.com began producing their Emerging Housing Markets Index in spring 2021 and has now published 6 quarterly estimates. The index identifies the top metro areas for home buyers seeking an appreciating housing market, strong local economies, and appealing lifestyle amenities. Three hundred of the most populous core-based statistical areas as measured by the U.S. Census Bureau are evaluated using two main areas: real-estate markets (50%) and economic health (50%). It utilizes 11 key indicators that are weighted and summed to create a single measure: real-estate supply (16.6%), real-estate demand (16.6%), medium home listing price trend (16.6%), unemployment (6.25%), wages (6.25%), regional price parities (6.25%), amenities (6.25%), small businesses (6.25%), and property taxes (6.25%).[iii]
Figure 3 shows the rankings of the Colorado core-based statistical areas relative to all three hundred most populous areas included in the index. Fort Collins has fallen out of the top ten percent since Summer 2021 and is now ranked 64th. This index provides some perspective that the large decrease in affordability is making Fort Collins relatively less attractive given the potential for prices to continue to rise and for other quality of life amenities and economic factors.
Figure 3 – Wall Street Journal/Realtor.com Emerging Housing Markets Index, Ranked Relative to 300 Metropolitan Statistical Areas
Home Prices
Shown in Figure 4, home prices in Fort Collins eclipsed the US average home price in 2013 and have risen at a rate close to Colorado home prices since 2009, though they have diverged since 2020 and home prices in Fort Collins are less expensive on average than the state overall. Home prices as measured by the Fort Collins Home Price Index increased 36% since the beginning of the Covid-19 pandemic through June 2023.
Figure 4 – Fort Collins, CO Home Price Index
Hours of Work Needed to Afford a Home Mortgage
To measure the impact on the average homeowner in Colorado, CSI calculated the number of hours that one would have to work while earning the average hourly wage ($30.23 in June 2023) to cover the monthly mortgage payments and is shown in Figures 5 and 6. Over just the last 24 months, an additional 47 hours of work per month has become necessary to cover the mortgage on average priced home as mortgage rates have doubled. In 2023, 119.5 hours of work are required, at the average wage rate, to pay the monthly mortgage on an average priced home in Fort Collins.
Figure 5 – Fort Collins, CO. Home Prices, Mortgage Rates, Monthly Payment, Wage Rates, and Hours of Work Required to Cover the Monthly Mortgage Payment
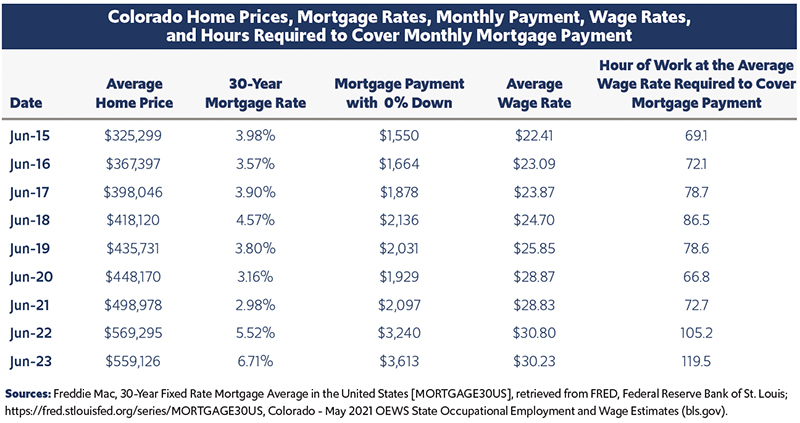
Figure 6 shows the evolution of monthly mortgage payments on a median-price home and the required hours of work necessary to cover the payment. Required hours steadily declined until 2013 and then gradually increased until 2019, dropped during the pandemic and then began to increase dramatically beginning in November 2021.
Figure 6 – Evolution of Mortgage Affordability in Fort Collins, CO.
Fort Collins Housing Supply Shortage
Fort Collins has failed to build enough housing to keep pace with demand. Standard housing market reports like those developed by the Colorado Association of REALTORS® track inventory based on homes listed for sale. What those reports do not capture is the total stock of homes needed to maintain a healthy housing market.
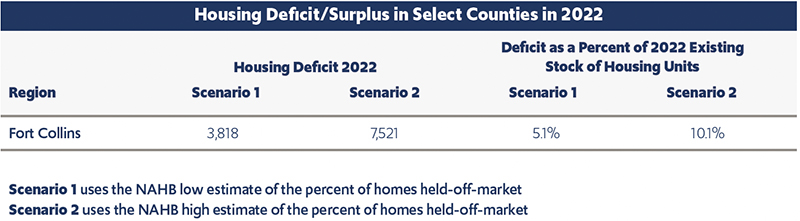
CSI estimated the number of homes by select Colorado counties needed to achieve a healthy housing market under two scenarios. Each scenario is intended to measure the difference between the actual number of homes in a county relative to the number of homes needed to maintain a more stable market for the local population. The first scenario estimates the housing deficit or surplus based on the low estimate of homes held off the market for purchase by the local population. The second scenario estimates the housing deficit or surplus based on the high estimate of homes held off the market for purchase by the local population.
Housing units and households – Each scenario uses both the estimate of housing units and households from U.S. Census Bureau’s American Community Survey (ACS) and data from the Colorado Demography Office.
Homes held off the market – Total homes held off the market reflect existing housing units not available for purchase by the local population. The estimate includes a range of second homes at the county level released by the National Association of Homebuilders,[iv] along with an estimate of uninhabitable homes from ACS. The high range for second homes in Fort Collins is estimated to be 4.9%.
Desired ratio of total units to local population – To estimate the target number of housing units, the value of 1.1 housing units per household was used to represent a healthy market. This value is derived from the historic average ratio of vacancy rates for the U.S. and was the basis for a housing supply report done for the state of Oregon.[v]
Using the scenarios discussed above, the deficit in housing units in 2022 is estimated to be between 3,818 and 7,521 units. Figure 7 presents summary results for Fort Collins. CSI will continue to monitor new data as it becomes available and will amend the estimates and methodology as required.
Figure 7 – Housing Deficit in Fort Collins, CO
Building Permits and the Housing Supply Deficit
The housing supply deficit began to accumulate in the 1990s as Colorado experienced a substantial increase in population. The deficit increased through 2012 and began to decline through 2019. Beginning in 2020, the deficit increased dramatically through 2021 and has remained elevated as demand for housing increased, see Figure 8. Permitting over the last four years has been lower than the previous 9 years and is not sufficient to reduce the deficit.
Figure 8 – Fort Collins , CO Population Growth, Permitted Units, and the Housing Supply Deficit
Figure 9 – shows the estimated change in population, households, and housing units needed in Fort Collins through 2028. This data is used to forecast the number of permits that would be required to close the 2022 supply deficit and meet new demand for housing as new residents move in.
Figure 9 – Change in Population, Households and Housing Units Needed in Fort Collins, CO Through 2028
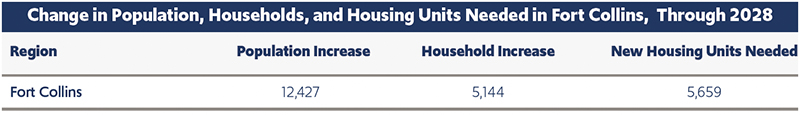
To erase the estimated deficit in Fort Collins and meet new population-driven demand for housing by 2028, an additional 1,580 (9,477/6-years) to 2,196 (13.179/11-years) permitted units are required per year. CSI is tracking building unit permits on a quarterly basis to evaluate whether the level of issuance is sufficient to close the existing housing deficit and meet new demand for housing as the population grows. See Figure 10 for the scenario estimates for Fort Collins. At the time of this analysis data on permitting was available through June showing that there have been 592 permits issued to date. The projected full year permitting for 2023 assumes the same level of permitting in the second half of the year for a total of 1,184.
Figure 10 – Permits Required to Close the Housing Supply Deficit and Meet New Demand in Fort Collins, CO. by 2028
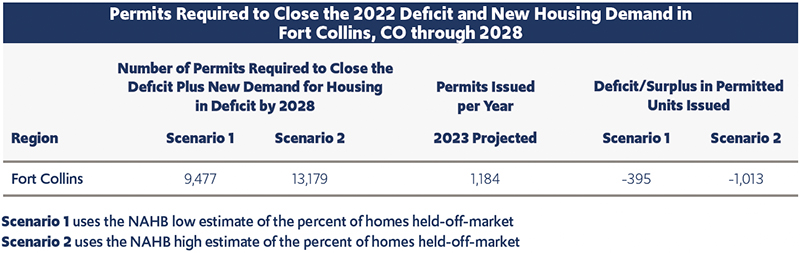
Figure 11 shows the number of housing units permits required to close the deficit by 2028 for 2 scenarios, and the number of permits issued monthly so far. The red line shows the average monthly required permits to close the 2022 deficit and meet new housing demand by 2028 for scenario 1. The blue line is for scenario 2. In scenario 1, enough permits have been issued in two months, in May and August 2022 to cover the housing deficit and meet new demand for housing by 2028. However, permitting is trending down as high interest rates are dampening demand for housing and builders are applying for fewer permits. In scenario 2, enough permits were issued in only one month, May 2022.
Figure 11 – Average Monthly Housing Permits Needed vs. Issued in Fort Collins, CO
Types of Permits Issued in Fort Collins by Year
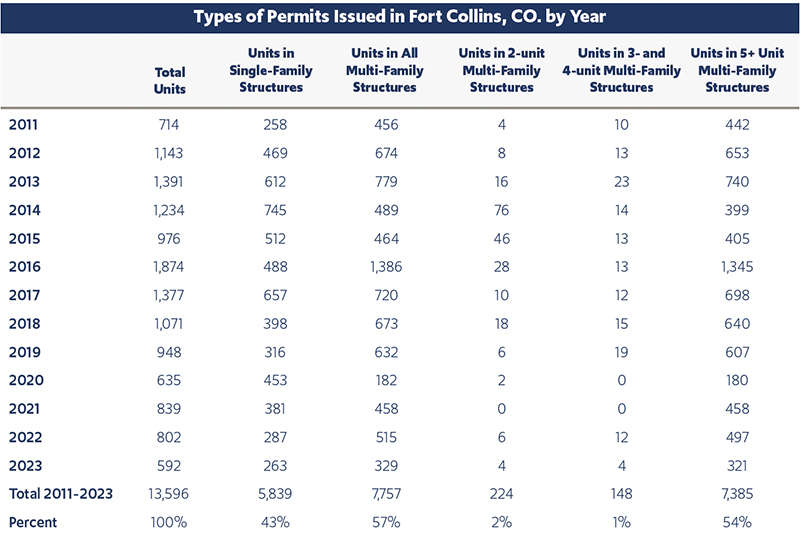
Figure 12 shows the number and types of permits issued in Fort Collins since 2011. Fifty-seven percent of permits have been for multi-family structures, the majority of which (fifty-four percent) are in the 5+ Unit structures. Forty-three percent of permits have been for single family structures.
Figure 12- Types of Permits Issued in Fort Collins, CO. by Year
Going Forward
As shown in Figure 13, as mortgage rates (black line) have increased since March 2022, demand for housing has begun to taper off and in response, many home builders are re-evaluating their plans for new housing development, thus, 30-year mortgage rates (blue line) have declined by 29 percent since March 2021. The October Housing Market Index (HMI) (red line) released by the National Association of Homebuilders, which reflects builder confidence in the market for newly built single-family homes, fell for the 11th straight month to the lowest point since April 2020.[vi]
The housing deficit remains and if builders reduce annual production, which looks increasingly likely based on the HMI, the deficit will not decrease. If population growth in Fort Collins continues, absent sufficient new housing units, the deficit will grow. Developers should transition to building more higher density and less expensive housing so that the deficit can be erased even in a high interest rate environment.
Figure 13 – NAHB/Wells Fargo Housing Market Index, 30-year Mortgage Rates
[i] Housing Data – Zillow Research
[ii] Freddie Mac, 30-Year Fixed Rate Mortgage Average in the United States [MORTGAGE30US], retrieved from FRED, Federal Reserve Bank of St. Louis; https://fred.stlouisfed.org/series/MORTGAGE30US, July 12, 2022.
[iii] https://www.wsj.com/articles/see-the-full-rankings-for-wsj-realtor-coms-summer-emerging-housing-markets-index-11658779946?mod=article_relatedinline
[iv] The Nation’s Stock of Second Homes, Zhao, Na., May 2013, National Association of Home Builders
[v] Implementing a Regional Housing Needs Methodology in Oregon: Approach, Results, and Initial Recommendations. August 2020. ECONorthwest.
[vi] https://www.nahb.org/news-and-economics/press-releases/2022/07/builder-confidence-plunges-as-affordability-woes-mount