

Introduction
As the Covid-19 pandemic recedes, leaving in its wake declining public school student enrollment and achievement, local, state, and federal dollars continue to flow to the Colorado public education system in ever-larger amounts.
While some of this expansion in the most recent years can be attributed to the massive infusion of COVID-19 relief dollars, which will begin to dry up a year from now, it continues a trend that has been evident over a longer period of time. While some argue that Colorado’s public schools are underfunded, the school system continues to receive larger contributions from local, state, and federal sources year after year.
At the same time, student enrollment steadily declined for many districts and is forecasted to continue a downward slide for the foreseeable future. The financial challenges specific schools will face will be exacerbated as federal relief funds will soon run out.
Student achievement, as reflected in the Colorado Measures of Academic Success (CMAS) results, made only a modest recovery in English Language Arts (reading and writing) in 2022 after a huge plunge in 2021, according to the admittedly imperfect and incomplete data collected last year. Math scores continued to slide, and fewer than four in 10 Colorado students can perform grade-level math proficiently.
Each year, the Colorado Department of Education releases a new set of data capturing the finances of Colorado’s PK-12 public education system. This report summarizes several different dimensions of the financial data, and shows key trends of how the system of education funding and spending has changed over time.
Key findings
K-12 Enrollment has not recovered from the pandemic dip
- K-12 student enrollment in in the 2021–2022 school year dipped by 1,174 students. This was relatively flat after a plunge of almost 22,000 students the year before. Prior to 2021, K-12 enrollment grew every year since 2012, albeit at a declining rate.
- Enrollment declines hit Denver metro area districts especially hard, but were also pronounced in the Pikes Peak and North Central regions.
- The Northeast region gained students over the course of the pandemic, with enrollment growing from 14,825 in 2020 to 17,690 in 2022.
- After declining by 8,000 students in 2020, pre-school enrollment grew by nearly 4,500 students in 2021. When including PK enrollment, total PK-12 enrollment grew slightly from 2020 levels.
Funding for PK-12 education in Colorado did not suffer major cuts due to drops in local and state funding, but federal relief funds will soon be gone
- Because of a temporary increase in federal funding, budgets for PK-12 education across every region avoided major cuts, even as education continues to be crowded out of the state budget by spending on other areas.
- Apart from the pandemic year (FY 2020), funding has been steadily increasing since 2013 when the state’s economy began rebounding from the Great Recession.
- Between 2011 and 2021, total revenue (local, state, and federal) to Colorado school districts increased by 52 percent.
- State inflation adjusted per-pupil revenue from all local, state, and federal sources has remained flat at between $14,000 and $15,000 since 2011.
- After three years of massive federal spending in education through Covid relief funds, federal funding will drop as the more than $2.5 billion in relief funds are spent down. Hopefully the funds were deployed prudently and not used to create long-term financial commitments.
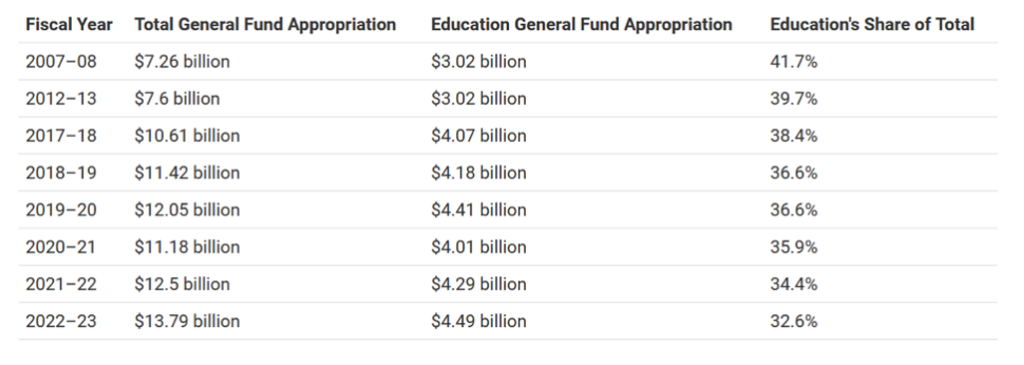
- For the first time in recent years—with fiscal year 2021 being defined by pandemic disruption—Colorado’s General Fund appropriation decreased and, consequently, so did the education portion. However, since that low point, the Education General Fund appropriation grew by $480M, while the total General Fund appropriation grew by $2.61B. This means that education saw a 12 percent increase in appropriations over the last two budget cycles yet continued its trending decline as an overall share of the state’s General Fund which grew by 23.3 percent.
A greater proportion of school district spending is taking place away from classrooms
- There is a downward trend in the share of dollars being spent on instruction, and more specifically, on teacher salaries. Operations, school and district administration, and support for students all saw increases as a share of total spending from 2011 to 2021.
- The share of total spending being allocated to instruction, which covers teacher salaries, has decreased on average across the state between 2011 and 2021, from 45.4 percent to 39.1 percent.
- The growth in central office administrators—which has increased by 132 percent—has far outstripped student population growth over the past 22 years, as well as the growth in teachers. The number of building principals has also grown 73 percent, twice the rate of teachers (36%), and at three times the rate of student numbers (25%).
Teacher salaries continue to rise, but regional disparities are large in pay and turnover
- In 2021-22, the statewide average teacher salary was $60,234. The state average, however, masks the wide variation in salaries that occurs at the regional and school district level.
- Over the last 14 years, the state’s funding per student has increased by 47 percent. Meanwhile, the average teacher salary has grown by 27 percent.
- Even as funding received by school districts continues to increase, there is not an equivalent rise in teacher pay, which hurts schools’ ability to recruit and retain teachers.
- Urban and suburban salaries outpace rural salaries even as the cost of living in the rural areas has increased. The average salary for the Metro region in 2021 was $62,700, compared to the Southeast region’s average salary of $41,365.
- Teacher turnover rates varied widely across Denver Metro Area districts. There was a strong correlation between higher salaries and lower turnover rates. In Littleton, for example, the teacher turnover rate was 9.3 percent and the average salary was $73,196. In Clear Creek, at the other end of the Metro Area turnover spectrum, the turnover rate was 21.9 percent and the average salary was $50,510.
- The average turnover rate in FY 2021 for Colorado employees in all other industries is 2.9 times the turnover rate for teachers—41.5 percent compared to 14.3 percent.
Part 1: Enrollment
Because funding is tied to student enrollment levels, it should generally mirror enrollment trends. Prior to the pandemic, enrollment was increasing year over year, but the rate of growth has been slowing over time (see Figure 1). From 2010 to 2015, the rate of growth was between a 1.1 and 1.6 percent increase. That rate slowed in 2016-17 and was down to a 0.1 percent increase in 2018. When COVID-19 hit in 2020, the public K-12 system lost over 30,000 students, representing a 3.3 percent decline in enrollment.
The Colorado Legislature passed a measure to keep funding levels for school districts based on the fall 2019 enrollment numbers rather than use the lower fall 2020 numbers. The fall 2021 student count, conducted last October, showed a continued enrollment decline of 1,174 K-12 students statewide.
Figure 1: Colorado K-12 enrollment over time
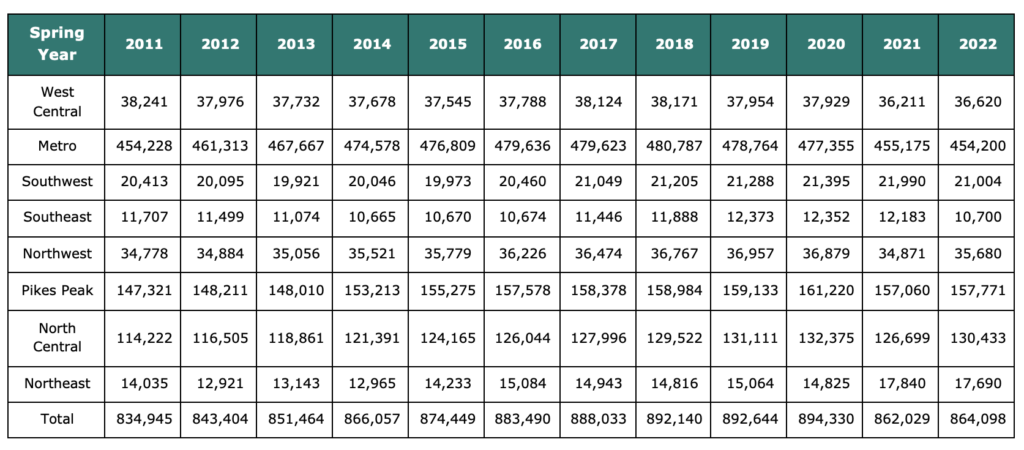
Though enrollment declines in the fall of 2020 were widespread across Colorado regions, as shown in Figure 2, adding in pre-school enrollment shows that some parts of the state did see slight overall increases. Those regions with a net increase in students from pandemic lows, when including pre-school enrollment, include North Central, Northwest, and West Central.
Figure 2: Pre-K-12 enrollment by region
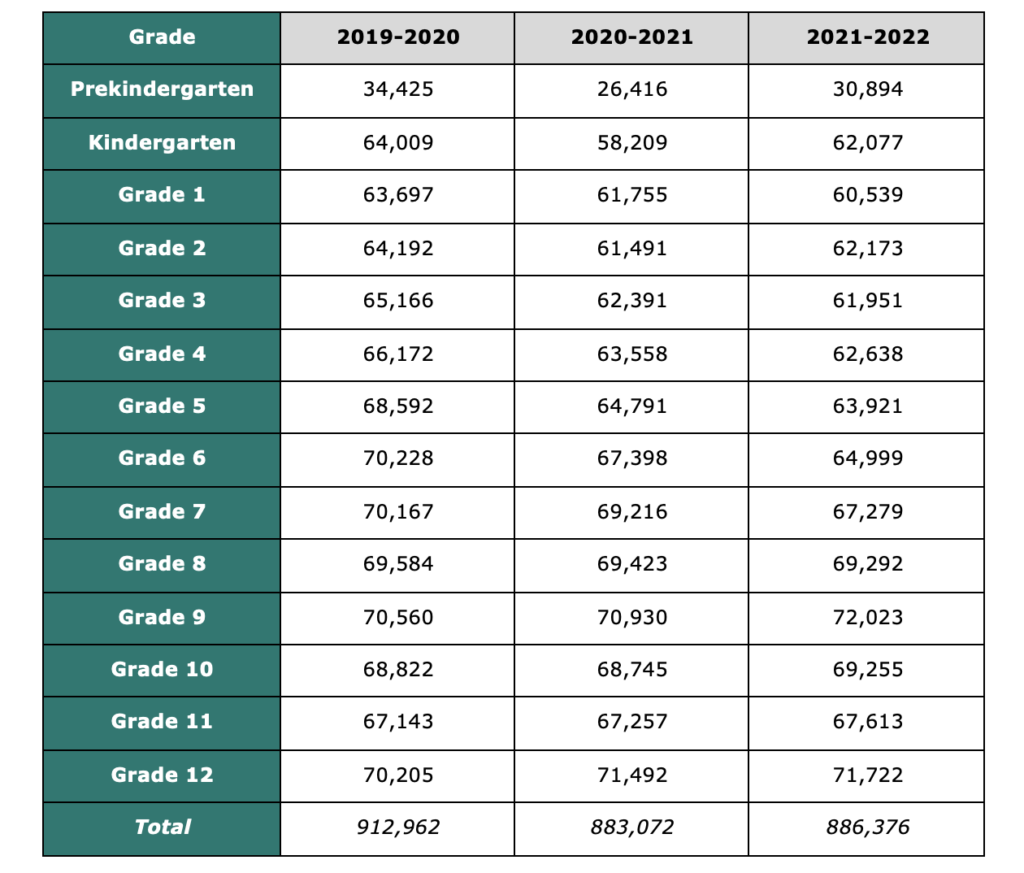
In an ill omen for the future, the steepest enrollment declines statewide between 2020 and 2022 were at the early childhood and elementary grades. Both the Pre-K and 4th grade cohorts have approximately 3,530 fewer students than pre-pandemic, but 5th grade is down 4,670 students and 6th grade is down by 5,230. Pre-kindergarten dropped by 10.3 % between 2020 and 2022, though Pre-k enrollment recovered half the losses between 2019-2020 and 2020-2021 in 2021-2022.
If these cohorts remain significantly lower, this would mean more budgetary pain in the future as those cohorts of students work through the system. The only grades that gained enrollment were grades 9-12. Pre-kindergarten dropped by 10.3 % between 2020 and 2022, though Pre-k enrollment recovered half the losses suffered between 2019-2020 and 2020-2021 in 2021-2022.
Figure 3: Enrollment changes by grade between the 2020 and 2022 school years
Figure 4: Pre-k–12 enrollment by grade (2020 through 2022)
Part 2: Revenue
K-12 public education revenue comes from four main funding sources: Local, State, Federal and Other. Local revenue stems from property tax, specific ownership tax and other funds produced within the boundaries of a school district for the purpose of public education. This category includes mill levy overrides and mills for bonded indebtedness. State revenue includes all funds collected by the state government that are then appropriated to school districts, including per pupil funding, program funding and other state grants and projects. Federal revenue is any money that is distributed to the school district from the federal government, whether directly or through an intervening agency such as the Colorado Department of Education.
Federal dollars typically come with specific regulations around how the money can be spent. Federal funding, for example, is used to support educational services for students with disabilities and English Language Learners and to fund programs at districts and schools that have a high proportion or number of low-income students.
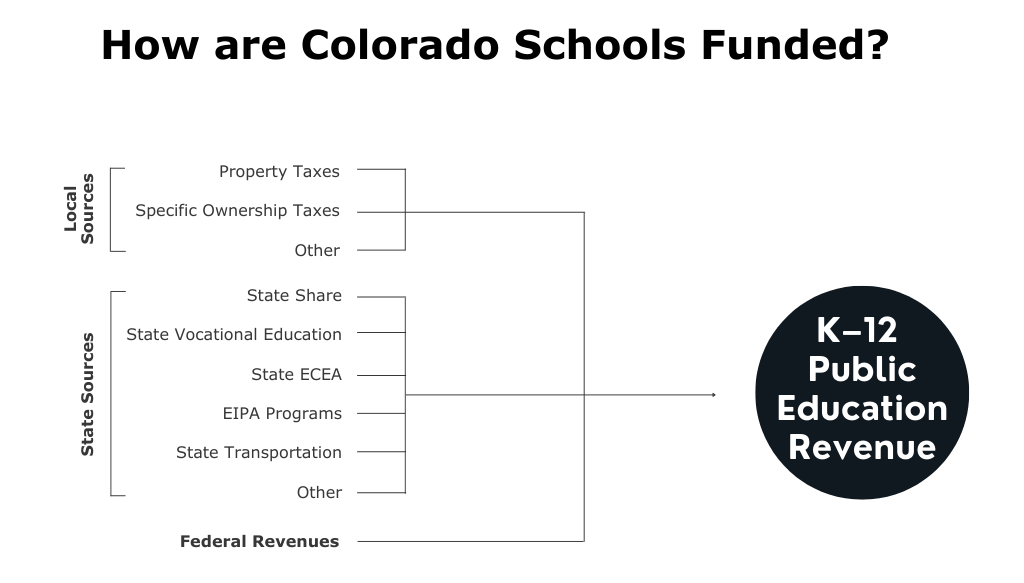
Figure 5: How are Colorado schools funded?
Local revenue
For most traditional school districts, property tax revenue from “total program” mills make up the largest source of local funding. This revenue goes towards a school district’s total program funding as set forth in the School Finance Act. The
specific ownership tax, which is a tax levied on motor vehicles, makes up a small portion of local revenue and is also included as part of the total program funding. State law allows school districts to collect additional local revenue from voter approved mill levy overrides and bond redemption mills. Such revenue is not considered in the school finance formula and thus is above and beyond a district’s total program funding.
The amount of education revenue generated from property taxes varies widely across the state due to differing levels of total program mills and property wealth. HB 1164, enacted in 2021, addresses to a great extent these inequities in total program mill levies by requiring school districts to reset the mills to the lesser of (a) the level the school district was at when it de-Bruced, (b) the level needed to be fully funded locally, or (c) 27 mills.
The average increase in mills under HB21-1164 is 4.2 mills. There are 17 school districts, all rural, that will see steeper increases of 10 to 18 mills, which will be phased in over time as the bill limits the tax increase to no more than 1 mill per year. 125 of 178 districts will end up at 27 mills, up from only 39 districts currently.
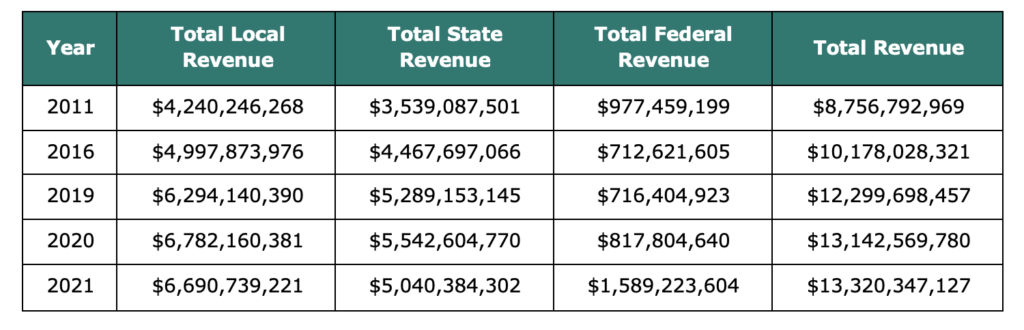
Local revenue has remained remarkably consistent over the last 10 years; federal revenue had been declining as a share of total revenue until 2021 when COVID-19 relief funds helped offset lower state revenue.
Figure 6: History of total revenue (including other sources)
As shown in Figure 7, the growth in the share of revenue coming from local sources that was so pronounced from 2015 to 2020 (see last year’s report) was far less notable between 2016 and 2021.
Figure 7: Major revenue sources for K-12 public education as shares of total (excluding other sources)
The state share of total revenue has fluctuated over time, however it declined by 6 percentage points between 2016 and 2021. This is consistent with the fact that appropriations from the state’s General Fund to Education, which are the primary source of “state revenue” for K-12 education, have not increased at the same rate as the overall budget. Increased health care spending among other competing state spending priorities, account for education’s declining percentage of the state budget.
Figure 8: Education as a share of Colorado general fund appropriations
The local share of funding dropped in 2021 in part because federal spending increased markedly over the past two years, thanks to the infusion of $2.5 billion federal COVID-19 relief funds to Colorado’s K-12 public schools to be spent between 2021 and 2024.[i] See Figure 9 below.
Figure 9: Per-pupil funding from COVID-19 relief funds by stimulus package
Revenue Across Different Regions of the State
Wealthier regions of Colorado—particularly Metro, North Central, and Northwest—get a higher percentage of their funding from local revenues, primarily due to high property values. Lower income regions – especially Southeast and Northeast – receive the vast majority of their funding from state and federal sources. Those trends have grown more pronounced since 2016.
Figure 10 presents the proportions of local, state and federal revenue by region. The Northwest region, which is comprised of school districts with higher total program mill levies, relies the most heavily on local property tax revenue. The region received nearly two-thirds of its total revenues through local sources (61.6 percent in 2021), and, correspondingly, the Northwest region has the smallest share of state funding of all regions (29%).
Figure 10: Local, state, and federal revenue as a share of total revenue by region
Given the Charter School Institute’s unique position as a statewide charter authorizer, its schools do not have taxing districts and thus do not collect any revenue from property taxes and rely largely on state appropriations. Aside from the Charter School Institute, the Southeast region receives the smallest proportion of revenue from local sources (17.5% in 2021). Accordingly, the Southeast’s share of revenue coming from state sources is the highest among the traditional school districts (69.8%).
Figure 11: Nominal and inflation-adjusted local, state, and federal revenue by region
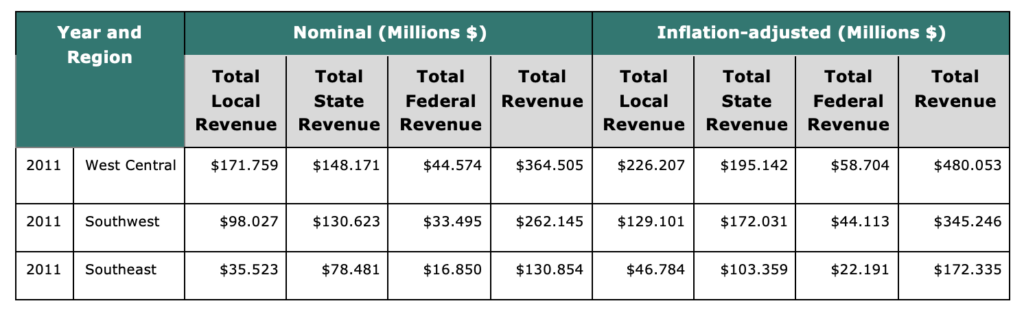
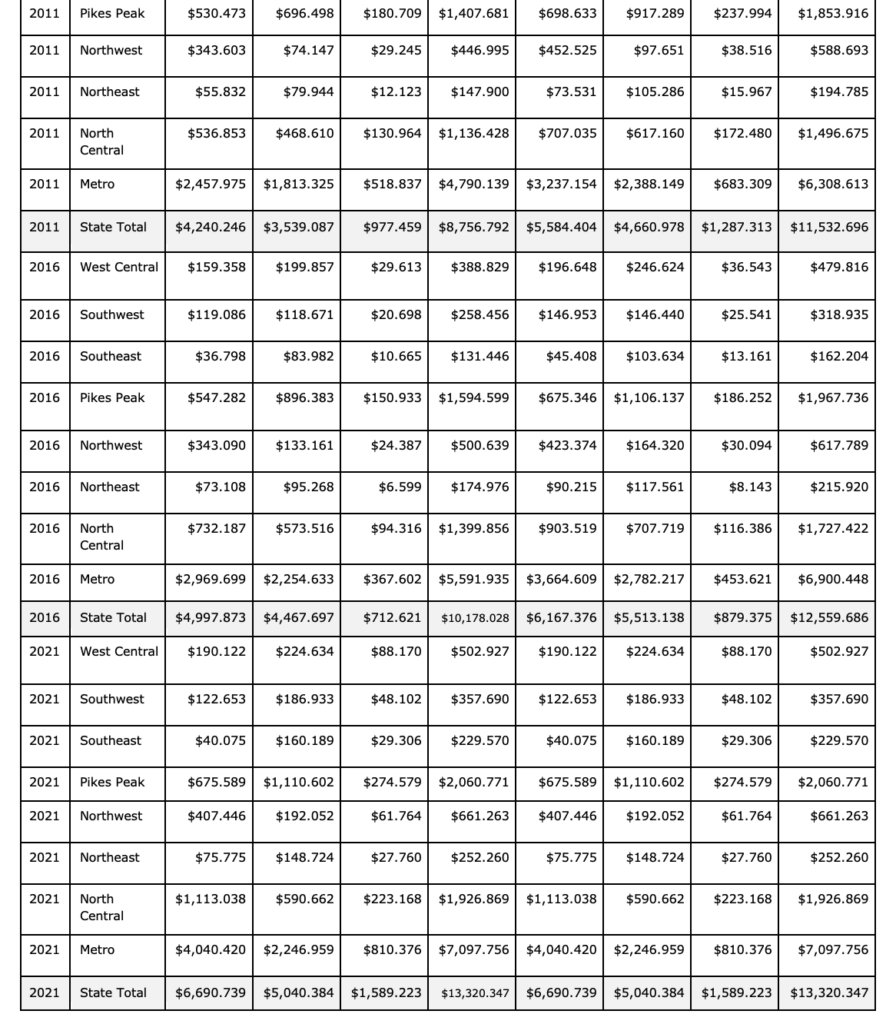
Real total revenue rose in every region between 2011 and 2016 and between 2016 and 2021, though in many cases only because it was backfilled by high federal revenues in 2021.
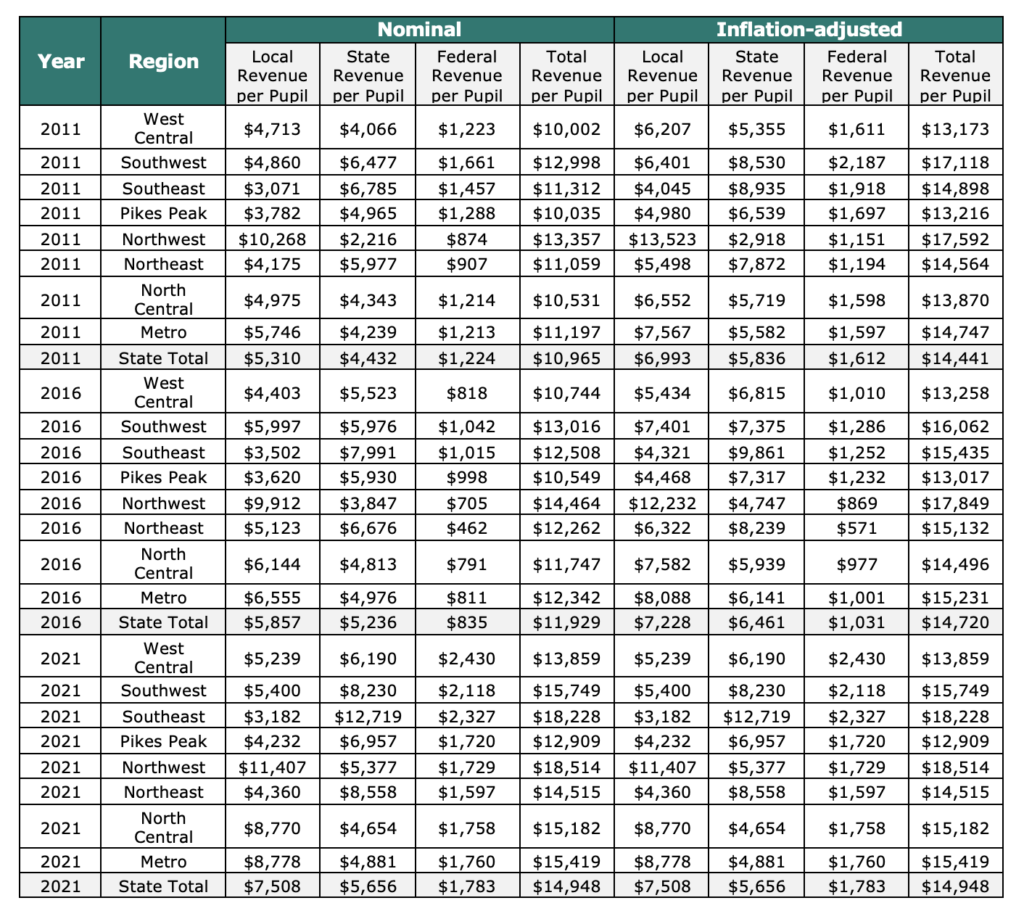
Figure 12: Nominal and inflation-adjusted local, state, and federal revenue per pupil by region
Part 3: Expenditures
The source of funding for K-12 public education is reported in the different categories of revenue. The destination of those dollars is captured in state expenditure reports.
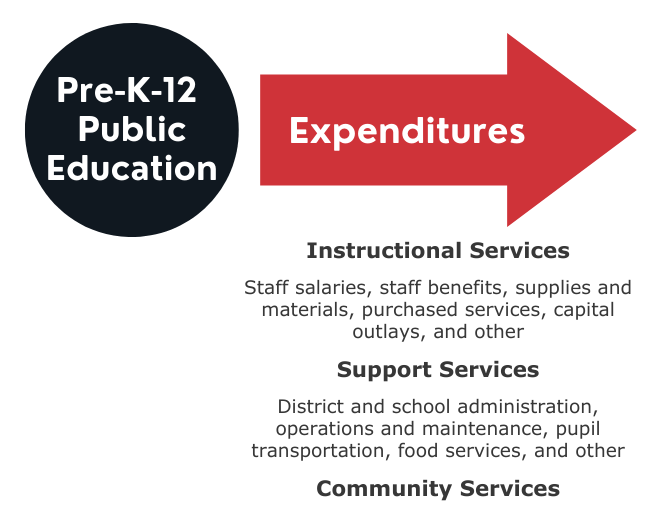
Figure 13: Total Annual Public Education Expenditures
As shown in Figure 14, instructional services accounted for 39 percent of total spending, while support services comprised 35.3 percent and other spending rounded out the remaining 23.2 percent. There has been a decrease in the share of spending on instruction and an increase in the share of spending on support services over the past 10 years.
Figure 14: Shares of major expenditures in public education
Figure 15: Growth in enrollment, funded pupil counts, and classroom expenditure since 2007
Figure 16 shows total expenditures by region for three selected years going back over a decade.
Figure 16: History of total expenditures by region
Figure 17 illustrates per pupil spending on instruction and support by region for three years. Figure 18 provides a more granular look at spending by region in 2021. Variations by region are modest.
Figure 17: Instruction and support expenditures per pupil by region
Figure 18: Regional shares of total instructional and support expenditure by category in 2021
Figure 19: Statewide shares of total expenditure by instructional/support category
Part 4: Teacher salaries and turnover
Statewide, the average salary topped $60,000 in 2021, an increase of 17.5 percent increase since 2016. But there are significant disparities by region: The average teacher salary in the Southeast was $41,365, while in the metro region it was $62,700.
Figure 20: Average regional teacher salaries over time
As the scatter plot in Figure 21 shows, teacher turnover in the metro region is closely correlated with average pay. In Boulder Valley, where the average salary is almost $85,000, teacher turnover was just 10.5 percent. In the semi-rural Elizabeth School District, where average pay is $46,389, turnover was 29.1 percent.
Figure 21: Average teacher salaries and turnover rate in the metro region
The data used to populate figure 21 is captured in the table below.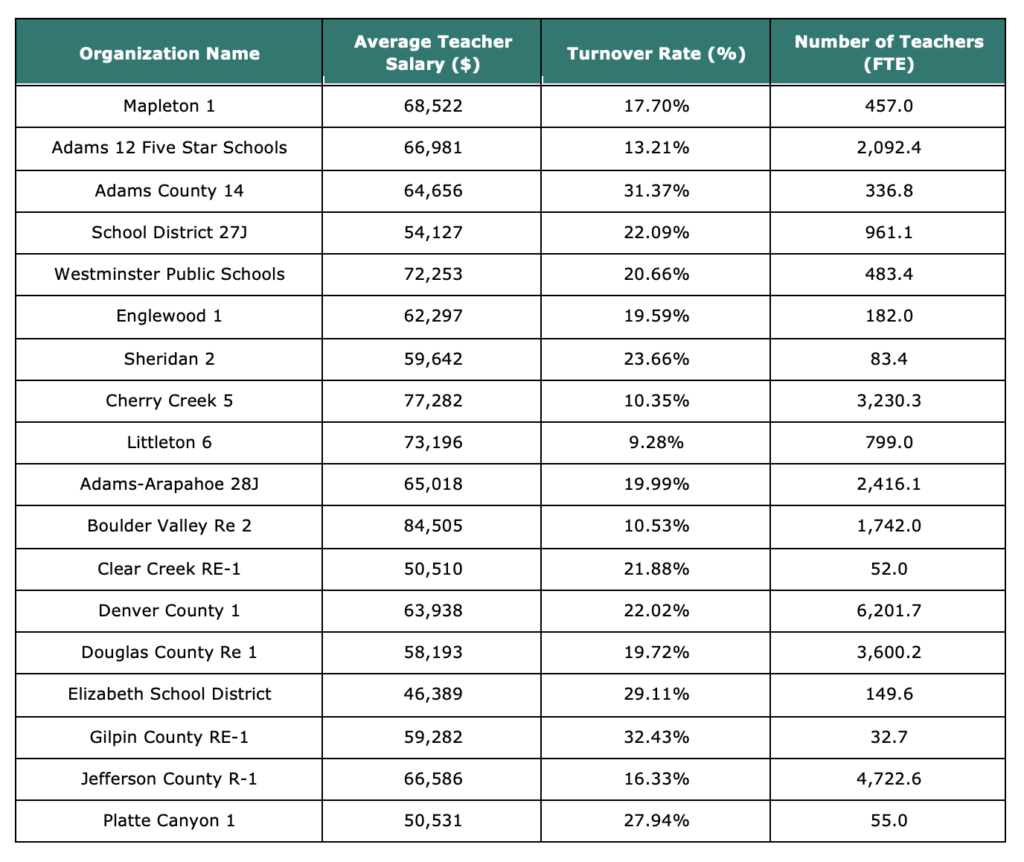
Figure 22: Average education staff turnover rates compared to other industries
Part 5: Student performance
Figure 23: Four- and six-year graduation rates in Colorado
Colorado’s graduation rate is measured by how many students enter the ninth grade and progress through the 12th grade—completing all academic requirements—in either four or six years. However, while Colorado’s four- and six-year high school graduation rate have risen over time, it must be noted that these academic standards are not well aligned to college readiness standards, nor workforce readiness standards.
Figure 24: Four-year high school graduation rates by region (2021)
Despite some missing data for 2020 and 2021, Figure 25 shows that on a statewide average, third-grade math and English scores have mostly recovered from pandemic-related dips. But having only 41 percent of third graders reading at grade-level bodes ill for the futures of 60 percent of the state’s young students. Research shows that students not reading proficiently by the end of third grade face major obstacles to ever catching up. Math scores are similarly bleak, with just 39 percent of third graders performing at grade-level proficiency.
Figure 25: Third grade reading and math proficiency rates
Colorado, like other states, suffers from yawning achievement gaps separating low-income from non-low-income students. As Figure 26 shows, those gaps begin early. And they persist.
Figure 26: Third-grade reading and math proficiency rates by free or reduced-price lunch eligibility
Conclusion
This analysis of most recent data shows a continuation of Colorado’s longtime trends: increased spending on education, a growing share of resources moving out of the classroom, and overall student performance low and stagnant despite the increased spending. There are also persistent academic achievement gaps between low-income students and their more affluent peers.
The decrease in spending on instruction and an increase in spending on support services over the past 10 years is notable considering the well-documented difficulty schools are having finding the classroom teachers they need. While overall funding received by school districts continues to increase, there is not an equivalent rise in teacher pay, which impacts schools’ ability to recruit and retain teachers. At the same time, the data reveals a strong correlation between higher teacher pay and lower turnover rates.
As education spending steadily increases and student performance remains woefully low—with only 40 percent of the state’s third grade students proficient in reading—what does accountability look like to the tax paying public, to the parents who entrust their children to our public schools, and to the students receiving subpar educational services?
Other trends show that some districts, which are funded on a per pupil basis, are starting to recover from the enrollment loss suffered during the pandemic. But for other districts, especially those in more urban areas, enrollment is projected to continue declining.
The state’s high school graduation rate continues an upward climb, an important milestone for students at the end of their K-12 experience who are transitioning to their postsecondary pursuits.
There is opportunity for more forward progress. Colorado’s education officials—who are still coping with the disruptive ramifications of the Covid-19 pandemic—must wisely deploy the unprecedented influx of federal dollars that recently poured into local schools and then brace for fiscal year 2024 by when those funds must be spent and will not be renewed.
In an upcoming report, Common Sense Institute will calculate the economic impacts of Colorado’s educational underperformance and the resultant cost to individuals and the larger economy. We’ll also project the converse—what if Colorado prioritized and modernized the way we deliver K-12 education? It will be a timely exploration of the many ways in which structural improvements to the public education system could generate major benefits to all stakeholders and bring Colorado closer to the aspiration of being the greatest state in which to live, learn, work, and play.
Methodology and Data Sources
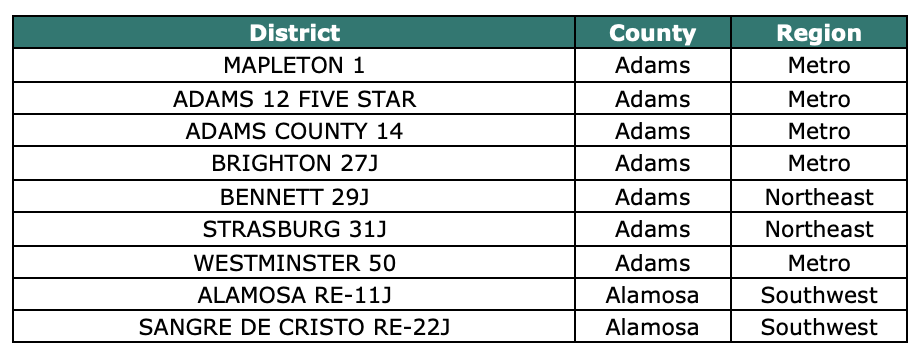
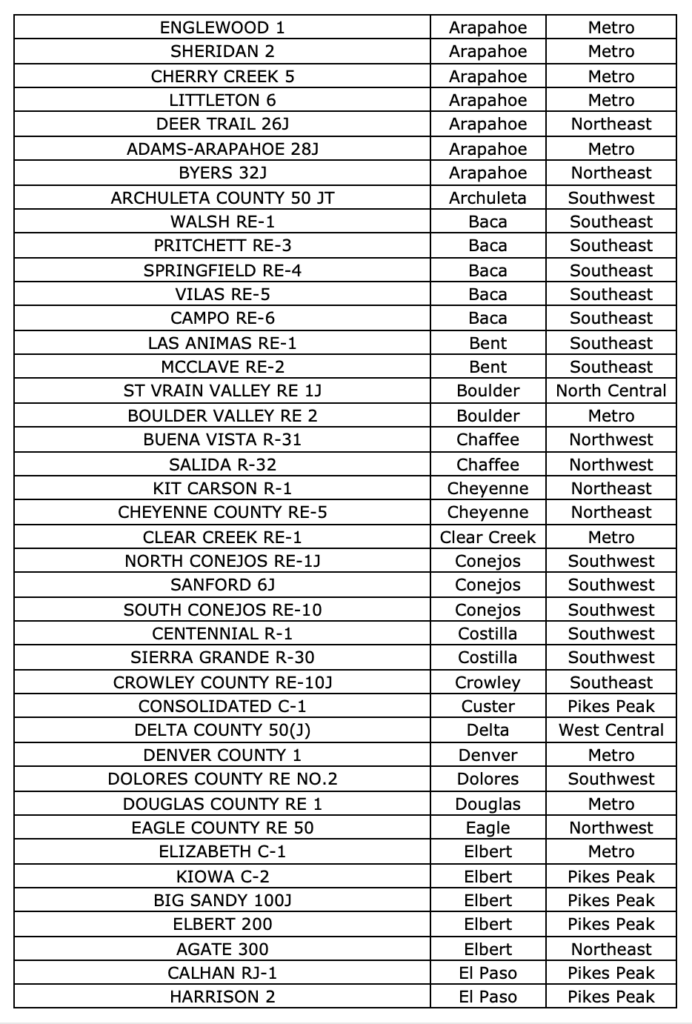
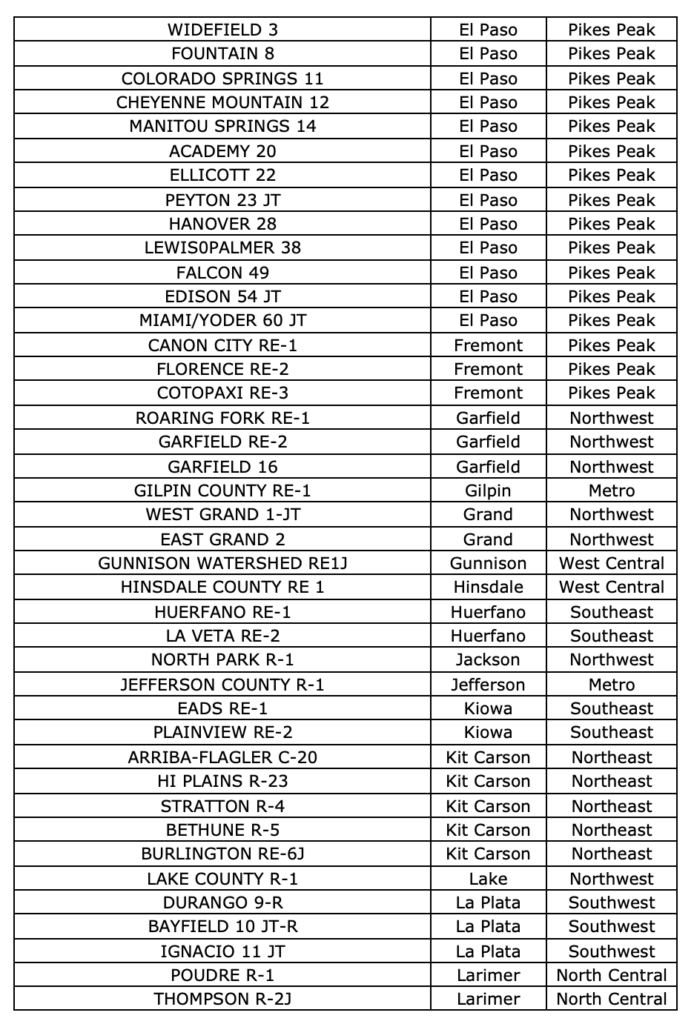
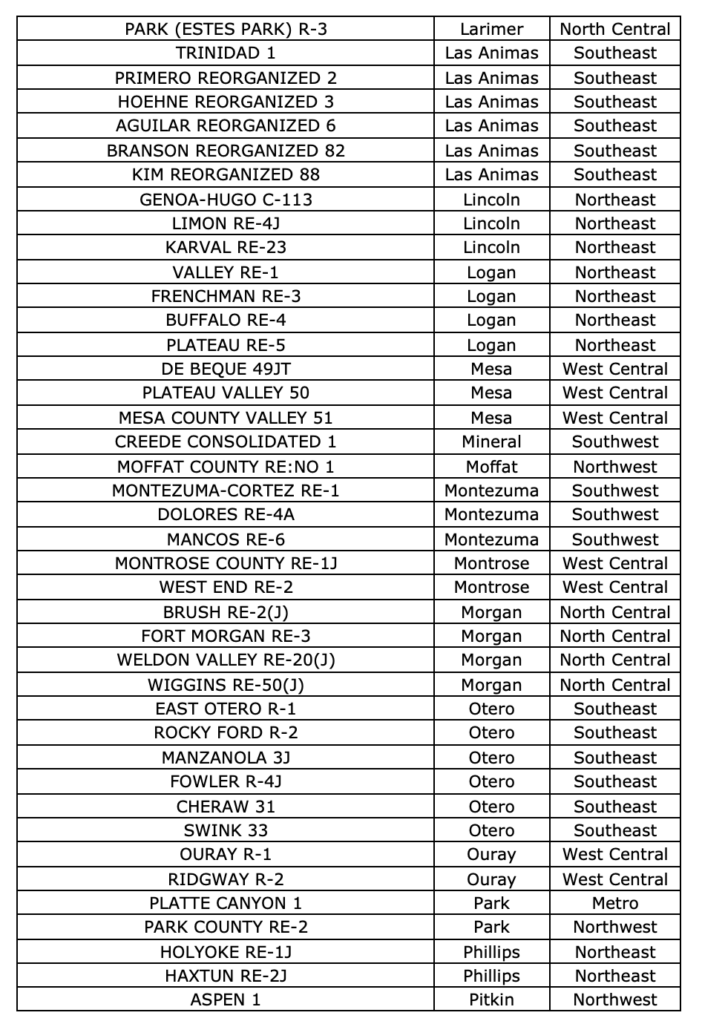
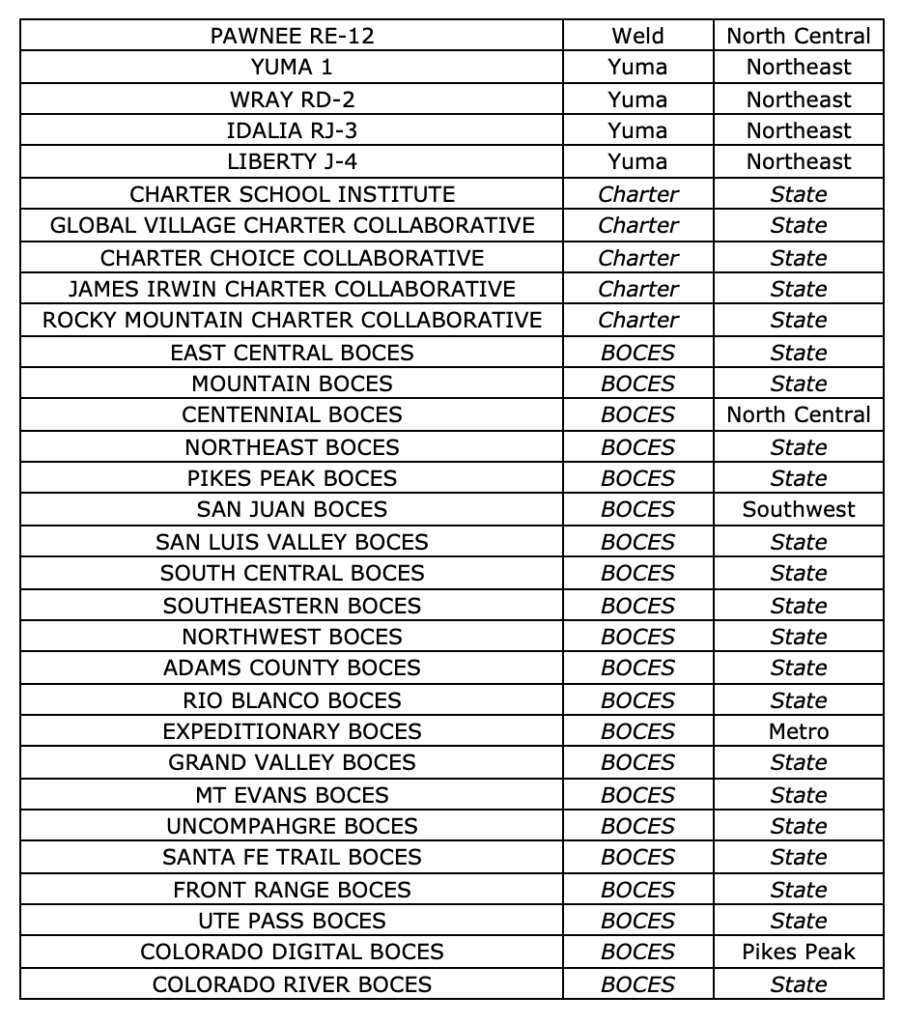
This study analyzes financial, workforce and student data across Colorado K-12 publicly funded school districts. See Appendix A for a list of school districts by region.
All the report’s revenue and expenditure data, as well as funded pupil counts, are from the Colorado Department of Education’s (CDE’s) annual “School District Revenues and Expenditures” reports. The most recent school year data is for FY2021 and the public reports on CDE’s website go as far back as FY2007.[ii]
CSI developed all of this report’s regional figures by cross-referencing the county in which each school district operates with the CDE’s eight Field Service Regions (while designating charter and BOCES schools separately).[iii]
Per-pupil figures are developed entirely according to data provided in these reports, whereas headcount enrollment data, which is distinct from funded pupil counts, are available from FY2000 through FY2022 and come from CDE’s ”Pupil Membership” releases.[iv]
Inflation adjustments, where they occur, are developed according to the U.S. Government’s CPI-U data published by the Bureau of Labor Statistics (BLS).[v]
Data concerning public-school staff counts, pay, and turnover are gathered from CDE’s ”School/District Staff Statistics” reports.[vi]
Turnover data for professions beyond the CDE’s remit are published by the BLS’ “Job Openings and Labor Turnover Survey” program.[vii]
Appendix A: School Districts by County and Region
![]()
[i] https://commonsenseinstituteco.org/2-5-billion-in-covid-19-federal-relief-funding-to-colorados-k-12-education-system/
[ii] https://www.cde.state.co.us/cdefinance/revexp
[iii] https://www.cde.state.co.us/cdeedserv/rgmapage
[iv] https://www.cde.state.co.us/cdereval/pupilcurrent
[v] https://www.bls.gov/cpi/
[vi] https://www.cde.state.co.us/cdereval/staffcurrent
[vii] https://www.bls.gov/jlt/