

A Look at K-12 Education Funding in Colorado
About the Mike A. Leprino Free Enterprise Fellowship
The Mike A. Leprino Free Enterprise Fellowship was established by Laura Leprino and Matthew Leprino in honor of the late Mike A. Leprino, who was a pillar in the Denver community. The son of Italian immigrants, he was a banker, developer and community servant. Some of the greatest treasures and neighborhoods in our state were built and funded by Mike. He gave back relentlessly to his state and country, something that he also instilled in each of his children. No greater defender of free enterprise and the American dream, Mike is someone who from humble beginnings built an enviable legacy in Colorado. Thanks to Mike A. Leprino’s legacy, we can all take a lesson in hard work, the entrepreneurial spirit, and the power of free enterprise. The Mike A. Leprino Fellowship will focus on issues reflected in the values and accomplishments of this former pillar of the community.
About the Author
2021 Mike A. Leprino Free Enterprise Fellow
Brenda Bautsch Dickhoner, Ph.D. has spent the last decade working in education policy at the national and state level. She is currently the President and CEO of Ready Colorado, a leading education advocacy group. Brenda has previously served as a policy expert at the Colorado Department of Education, helping design and implement programs to help improve the state’s lowest performing schools and districts. Prior to CDE, Brenda supported education policy efforts at the Colorado Department of Higher Education and the National Conference of State Legislatures.
Brenda earned a Ph.D. in Public Policy at the University of Colorado Denver’s School of Public Affairs and studied political science as an undergraduate at Duke University. Brenda serves on the board of directors for the Charter School Institute, the statewide authorizer for public charter schools. In 2021, Governor Jared Polis appointed Brenda as a member of his Education Leadership Council.
About Common Sense Institute
Common Sense Institute is a non-partisan research organization dedicated to the protection and promotion of Colorado’s economy. CSI is at the forefront of important discussions concerning the future of free enterprise in Colorado and aims to have an impact on the issues that matter most to Coloradans.
CSI’s mission is to examine the fiscal impacts of policies, initiatives, and proposed laws so that Coloradans are educated and informed on issues impacting their lives. CSI employs rigorous research techniques and dynamic modeling to evaluate the potential impact of these measures on the Colorado economy and individual opportunity.
Common Sense Institute was founded in 2010 originally as Common Sense Policy Roundtable. CSI’s founders were a concerned group of business and community leaders who observed that divisive partisanship was overwhelming policymaking and believed that sound economic analysis could help Coloradans make fact-based and common sense decisions.
Total Local, State and Federal Revenue Per Pupil for 20 Select School Districts
Introduction
If Colorado is to have a substantive public discourse about how to improve educational outcomes, there needs to be a common understanding of how K-12 public education is funded in the state. This study analyzes statewide and regional trends in K-12 revenues and spending over the past decade to help ground conversations in facts.
Key Findings
Funding for K-12 education is at an all-time high, even as education continues to be crowded out of the state budget by spending on other areas such as health care and PERA.
- Apart from the pandemic year (FY 2020), funding has been steadily increasing since 2013 when the state’s economy began rebounding from the Great Recession.
- Colorado allocated nearly $8 billion in total program funding (state and local funding from the School Finance Act) for FY 2022, resulting in an average of $8,991 per pupil for a population of 888,538 students. Total program per pupil funding ranges from $8,428 to $19,762 across school districts.
- At the same time, the share of General Fund dollars allocated to education has declined from 42.3 percent to 34.4 percent over the past 15 fiscal years. That eight percentage point drop equates to just under $1 billion in FY 2022.
- By 2022, the contributions to PERA from the school division just to pay down the unfunded liability will be more than $900 million. That $900 million in funds could be available for other spending priorities if it were not committed to pay down the growing unfunded liability. For perspective, this would amount to $16,117 per teacher.
Considering all sources of revenues, beyond the School Finance Act, provides a look at the total investment from taxpayers to K-12 education.
- In FY 2020, the amount of K-12 investment from local, state and federal revenue sources totaled $13.22 billion, for an average of $14,574 per pupil.
- This amount includes mill levy overrides, mills for bonded indebtedness and state and federal grant programs.
Colorado’s current K-12 funding system has serious structural flaws.
- As the School Finance Act stands now, funding for K-12 education is collected from taxpayers and distributed to school districts in an inequitable manner.
- The current funding formula favors district characteristics such as district size and cost of living over student needs.
- Mill levy overrides generate $1.4 billion in funding above and beyond the School Finance Act for 124 out of 178 school districts. The amount of revenue generated varies dramatically among those districts with overrides in place, and 54 districts receive no revenue from override mills.
- Simply increasing revenues without first modernizing the School Finance Act formula is unlikely to improve student outcomes.
There is a downward trend in the share of dollars being spent on instruction, and more specifically, on teacher salaries.
- There has been a decrease in spending on staff and services related to instruction over the past 10 years. Operations, school and district administration and supports for students all saw increases as a share of total spending from 2010 to 2020.
- The share of total spending being allocated to teacher salaries has decreased on average across the state between 2010 and 2020, from 41 percent to 35.6 percent. At the same time, benefits for teachers saw an increase from 9.7 percent to 11.6 percent of total spending.
Teacher salaries vary around the state and within the Metro region.
- In 2020-21, the statewide average teacher salary was $58,219. The state average, however, masks the wide variation in salaries that occurs at the regional and school district level.
- Urban and suburban salaries outpace rural salaries even as the cost of living in the rural areas has increased. The average salary for the metro region in 2020 was $60,656, compared to the Southeast region’s average salary of $40,170.
- Salaries with the Metro region range from a high of $82,150 in Boulder Valley School District to a low of $43,618 in Elizabeth School District on the rural outskirts of the region.
Teacher turnover decreased during the pandemic.
- Teacher and school principal turnover declined during the pandemic while district administrators were more likely to leave their position.
- In FY 2021, the turnover rate for district administrators was 34.4 percent, up 10 percentage points from FY 2019. The teacher turnover rate declined from 16.4 percent in FY 2019 before the pandemic to 14.3 percent in FY 2021 through the thick of COVID-19.
- The district administrator turnover rate is nearly 2.5 times the turnover rate for teachers in FY 2021.
- The average turnover rate in FY 2021 for Colorado employees in all other industries is 2.9 times the turnover rate for teachers—41.5 percent compared to 14.3 percent.
Methodology
This study analyzes spending and revenue at the state level and by region using the field service regions demarcated by the Colorado Department of Education (CDE). See Appendix A for a list of school districts by region. Expenditure and revenue data are from CDE. The timeframe considered in this study is 2009-2010 to 2019-2020, which is the last year for which the data were available during the drafting of this report. The state appropriations section does contain more recent data, which was available from the Joint Budget Committee.[i] However, most of the report is focused on the decade between 2010 and 2020. Data on teacher salaries and turnover are also from CDE.
Figure 1: Colorado Education Regions
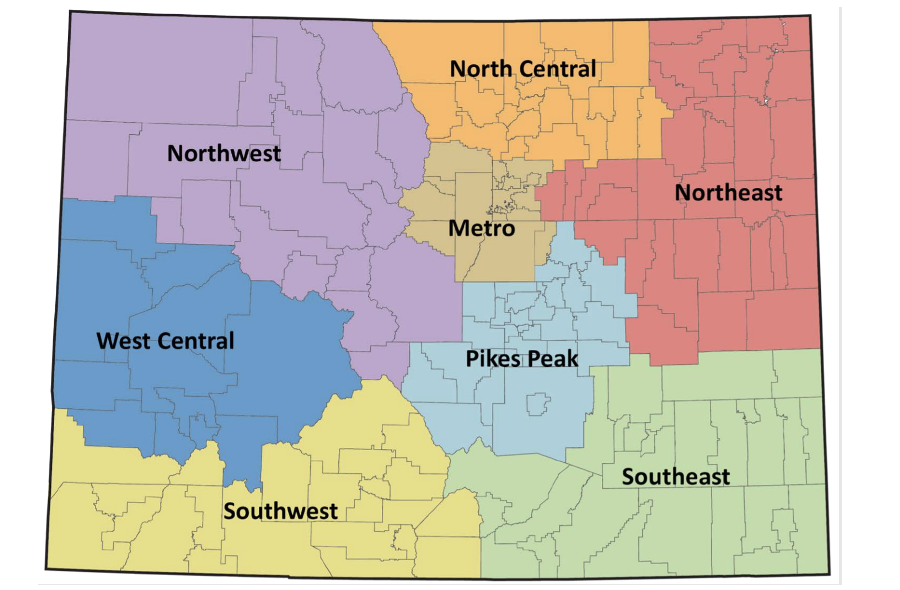
Source: Colorado Department of Education
State Context
Colorado’s school districts receive state and local funds based on a finance formula first established in 1988 and last revised through the Public School Finance Act of 1994.
School Finance Act Overview
The total amount of funding each school district receives through this formula in the School Finance Act is referred to as “total program,” which includes both the state share and local share. The formula starts with a base per pupil funding amount and then adjusts that amount based on the characteristics of each district, sending more funding to those districts with a higher cost of living, a larger share of personnel costs, and a smaller district size.[ii] In addition to per pupil funding, districts receive funding for at-risk, online and extended high school students.[iii]
During the 2021 legislative session, lawmakers added a factor to provide additional funding to schools serving English language learners. Those schools will receive an 8 percent increase in per pupil funding for students with no or limited proficiency in English. Also in 2021, the legislature expanded the definition of at-risk students to include those students eligible for both free and reduced-price lunch. Previously, only students eligible for free lunch were counted as at-risk. The at-risk factor provides school districts with a 12 percent increase in per pupil funding, plus an additional percentage for districts that serve a higher share of at-risk students than the state average.[iv]
The School Finance Act requires that local revenues be used to fund public education before the state contributes any dollars. This means that the legislature first calculates the local share, derived from property taxes and specific ownership taxes, and then determines the amount the state will allocate to each school district. If the local share is short of what the district needs to fund its total program, then the state contributes the remaining amount. It is important to note that some districts collect and spend property taxes above and beyond those that get allocated toward the school finance act. These additional property taxes are known as voter-approved mill levy overrides.
Once all adjustments are made and district funding levels are established as set forth in the School Finance Act, the budget stabilization factor is applied to reduce total funding proportionately across school districts. The budget stabilization factor allows the legislature to generate the savings needed to balance its budget while also complying with Amendment 23. Passed in 2000, Amendment 23 requires the base per pupil funding amount in the school finance formula to increase each year by at least the rate of inflation.[v]
Colorado K-12 Education Funding Summary
State funding for public education is now at an all-time high. Apart from the pandemic year (FY 2020), funding has been steadily increasing since 2013 when the state’s economy began rebounding from the Great Recession. Colorado allocated $7.99 billion in total program funding (state and local funding) for Fiscal Year 2021-22, resulting in an average of $8,991 per pupil for a population of 888,538 students. Total program per pupil funding ranges from $8,428 to $19,762 across school districts.[vi]
Figure 2: Colorado K-12 Per Pupil Funding from School Finance Act Over Time
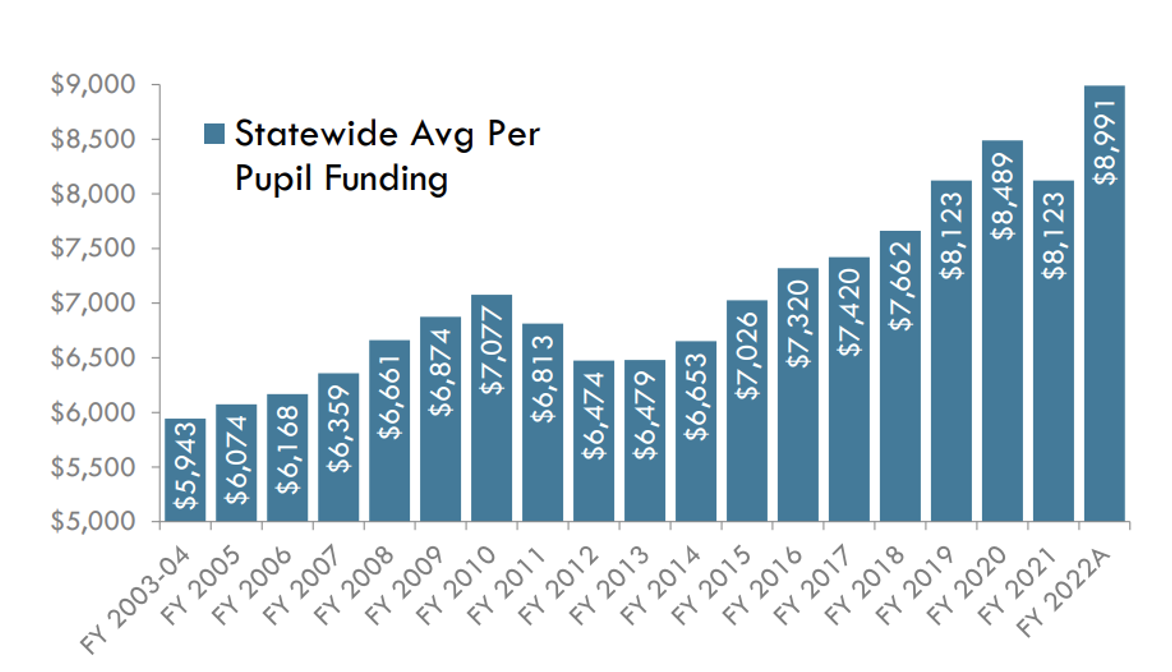
Source: Legislative Council Staff
Student Enrollment
As funding is tied to student enrollment levels, it should generally mirror enrollment trends. Prior to the pandemic, enrollment was still increasing year over year, but the rate of growth has been slowing over time (see Figure 3). From 2010 to 2015 the rate of growth equated to 1.1 – 1.6 percent increase. That rate slowed in 2016-17 and was down to a 0.1 percent increase in 2018. When COVID-19 hit in 2020, the public K-12 system lost over 30,000 students that fall, representing a 3.3 percent decline in enrollment. The Colorado Legislature passed a hold harmless measure to keep funding levels for school districts based on the Fall 2019 enrollment numbers rather than use the lower Fall 2020 numbers. The Fall 2021 student count, conducted in October, will illuminate how many students have returned to the public K-12 system for the 2021-22 academic year.
Figure 3: Colorado K-12 Student Enrollment Over Time
While state funding for education has increased over time, spending on other budget areas has increased at a greater rate, in turn reducing the share of the state’s budget dedicated to K-12 education. Overall, the state’s General Fund spending grew from $6.81 billion in FY 2006-07 to $12.5 billion in FY 2021-22, or by 83.5 percent in nominal dollars (see Figure 4). During that same time period, the amount spent on education grew by 50 percent, or from $2.87 billion to $4.29 billion. As a result, the share of General Fund dollars allocated to education declined from 42.3 percent to 34.4 percent. That eight percentage point drop in the share of general fund dollars equated to about $999.8 million in FY 2022.
Figure 4: Education as a Share of Colorado General Fund Appropriations
Source: Colorado State Legislature, Joint Budget Committee, Appropriations Reports
The decline in the share of General Fund education spending during this timeframe is partnered with an increase in the share of the General Fund dedicated to Health Care Policy and Financing, the administrator of the state’s Medicaid program. From the FY 2006-07 to FY 2021-22, the share of General Fund appropriations dedicated to Health Care Policy and Financing grew from 20.2 percent to 26.8 percent.[vii]
PERA
One major internal cost component to the education system is the funding of employee’s retirement benefits. Colorado’s Public Employees Retirement Association or PERA, manages a defined benefit retirement plan for nearly every employee in public education, which in recent years has seen its unfunded liabilities grow to more than $30 billion. Recent reforms have increased costs to both employees and employers, as well as reduced benefits in an attempt to pay off the unfunded liability more quickly and lower the solvency risk of the entire fund.
By 2022, the contributions to PERA from the school division just to pay down the unfunded liability will be more than $900 million. This is equal to 17.5 percent of covered payroll. Per the 2020 PERA annual report, the projected percent of covered payroll available to amortize the unfunded actuarially accrued liability is 15.13 percent. The school division’s portion of the $225 million direct payment to PERA from the state’s general fund is equal to 2.37 percent of payroll.[viii]
The more than $900 million in funds could be available for other spending priorities if it were not committed to pay down the growing unfunded liability. For perspective, this would amount to $16,117 per teacher.[ix]
Trends in Education Revenue
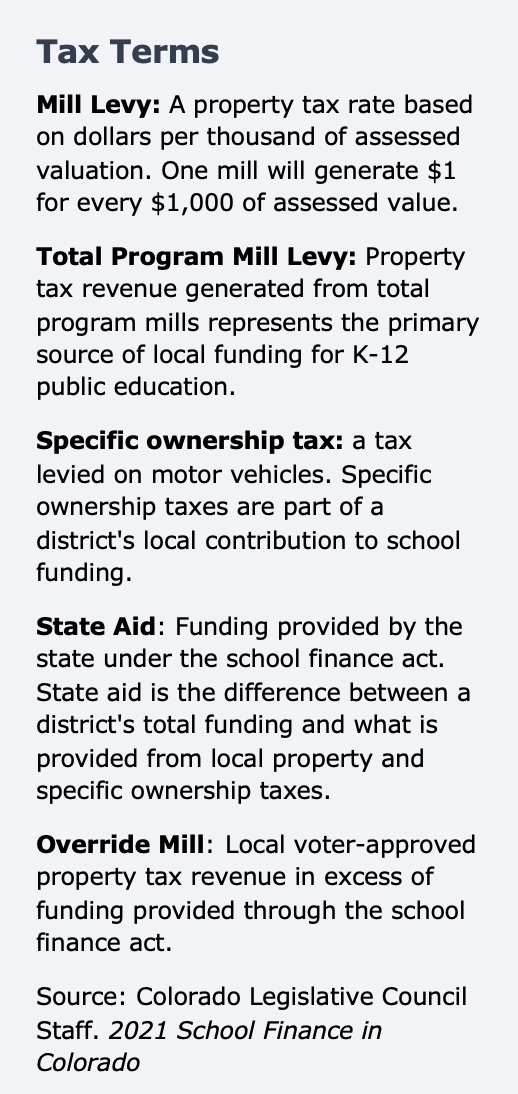
K-12 public education revenue comes from four main funding sources: Local, State, Federal and Other. Local revenue stems from property tax, specific ownership tax and other monies produced within the boundaries of a school district for the purpose of public education. This category includes mill levy overrides (see page 13 for a glossary of terms) and mills for bonded indebtedness. State revenue includes all funds collected by the state government that are then appropriated to school districts, including per pupil funding, program funding and other state grants and projects. Federal revenue is any money that is distributed to the school district from the federal government, whether directly or through an intervening agency such as the Colorado Department of Education. Federal dollars typically have specific regulations around how the money can be spent. Federal funding, for example, is used to support educational services for students with disabilities and English Language Learners and to fund programs at districts and schools that have a high proportion or number of low-income students.
The Bond Sale Proceeds and Other Sources category includes items such as proceeds from the sale of bonds, accrued interest, and capital leases. Funds in this category are volatile year to year and not typically included in calculating annual revenues to a school district. For those reasons, Bond Sale Proceeds and Other Sources revenues are not included in the analysis beyond Figure 5.
Figure 5: Major Revenue Sources for K-12 Public Education
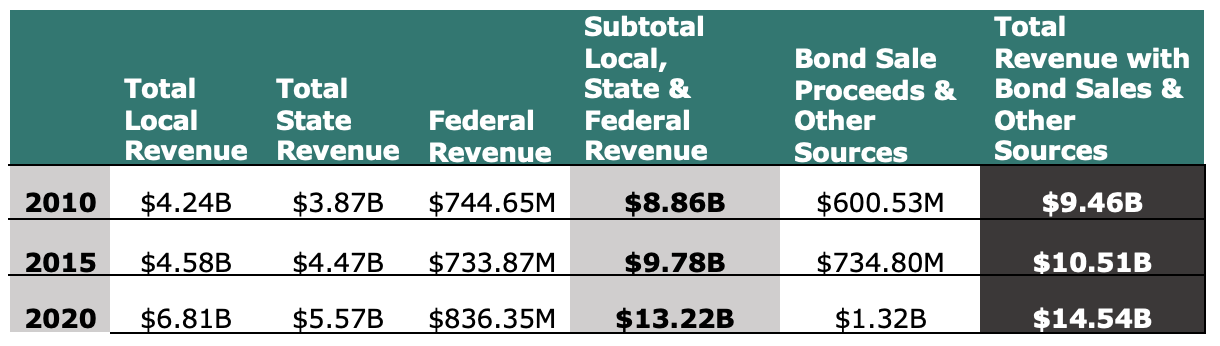
Figure 5 shows education revenues from all major sources for fiscal years 2010, 2015, and 2020. There was an increase in the Federal share of revenue in 2010 as the federal government awarded large educational grants to states in the wake of the Great Recession.
Looking at the Total Revenue with Bond Sale Proceeds and Other Sources, taxpayers invested $14.54 billion in K-12 education in FY 2020. Excluding Bond Sale Proceeds and Other Sources, the amount of K-12 investment from local, state and federal sources was $13.22 billion.
As shown in Figure 6, there was a noticeable growth in the share of revenue coming from local sources from 2015 to 2020, with that category increasing from 46.8% to 51.6%. It is important to note that the federal revenue numbers (equating to 6.3% of Total Revenue in FY 2020) do not include COVID-19 stimulus funding from the American Rescue Plan Act (enacted March 2021) or the Coronavirus Response and Relief Supplemental Appropriations Act (enacted December 2020). Those stimulus packages allocated over $1.5 billion to Colorado’s K-12 public schools to be spent between 2021 and 2024.[x]
Figure 6: Local, State and Federal Revenue as a Share of Total Revenue
The blue line represents Total Revenue.
 Local Funding
For most traditional school districts, property tax revenue from “total program” mills make up the largest source of local funding. This revenue goes towards a school district’s total program funding as set forth in the School Finance Act. The specific ownership tax, which is a tax levied on motor vehicles, makes up a small portion of local revenue and is also included as part of the total program funding. State law allows school districts to collect additional local revenue from voter-approved mill levy overrides and bond redemption mills. Such revenue is not considered in the school finance formula and thus is above and beyond a district’s total program funding.
The amount of education revenue generated from property taxes varies widely across the state due to differing levels of total program mills and property wealth. Figure 7 displays total program mill levies by school district for FY 2020-21. Currently, Primero School District has the lowest mill levy at 1.68 mills. By law, the maximum levy is 27 mills.
HB 1164, enacted in 2021, addresses to a great extent these inequities in total program mill levies by requiring school districts to reset the mills to the lesser of (a) the level the school district was at when it de-Bruced, (b) the level needed to be fully funded locally, or, (c) 27 mills. The average increase in mills under HB21-1164 is 4.2 mills. There are 17 school districts, all rural, that will see steeper increases of 10 to 18 mills, which will be phased in over time as the bill limits the tax increase to no more than 1 mill per year. 125 of 178 districts will end up at 27 mills, up from only 39 districts currently. Figure 8 depicts what the fully reset mills (i.e. when HB21-1164 is fully implemented) will require for a taxpayer contribution on a 2021 median value home compared to current mill levies. There will still be somewhat uneven local contributions to public education because several districts had locked in lower mill levies when they de-Bruced, and other districts can be locally funded at lower mill levels due to high property values.
Figure 7: K-12 Total Program Mill Levies (District Mill Levies for the School Finance Act), FY 2020-21
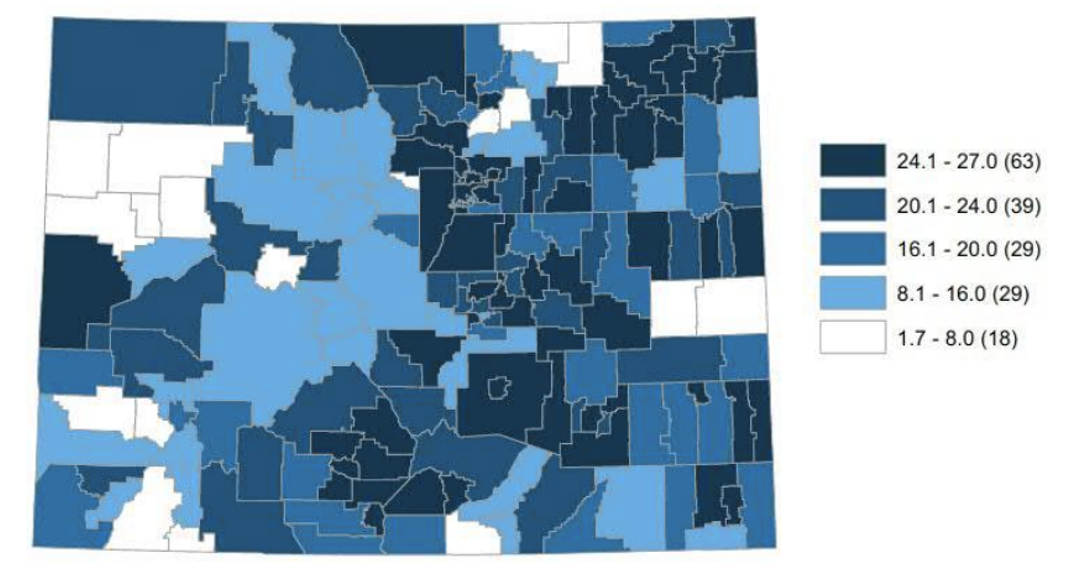
Source: Legislative Council Staff. (2021). 2021 School Finance in Colorado.
Note: Numbers in parentheses indicate the number of school districts in each tier.
Figure 8: Taxpayer Contribution to K-12 Total Program based on Typical Home Value in 2021 ($509,800) over 18 years
Displays the increase in tax contribution under implementation of HB21-1164 when mills are fully reset.
Source: HB21-1164 Fiscal Note, based on a 6.95% assessment rate and a typical home value of $509,800 in Colorado using the Zillow Home Value Index.
As shown in Figure 8, a taxpayer living in Aspen in a $509,800 home (Colorado’s typical value home in 2021)[xi] currently contributes $156 in yearly property taxes for total program funding for K-12 education. A taxpayer in Pueblo City pays $957—over six times the amount of the Aspen taxpayer. Of course, taxpayers would be hard pressed to find a house in Aspen for $509,800. The typical home value in Aspen according to the Zillow Home Value Index was $2,300,190 in 2021. The differing levels of property wealth around the state further complicate the local revenue picture. Aspen, with its current 5.156 mills (for FY 2021-22) is projected to bring in around $11,430 per pupil in local revenue from those total program mills. Pueblo City, at 27 mills, will generate approximately $2,070 per pupil.
Mill Levy Overrides
The goal of the School Finance Act is to equalize disparities in local funding such as the example above of Pueblo City and Aspen. In that scenario, the state share of K-12 funding is significantly higher for Pueblo City than Aspen to help compensate for lower levels of local revenue in Pueblo City.
Mill levy overrides, however, generate funding above and beyond the School Finance Act, and are not subject to such equalization. 124 of the state’s 178 school districts have successfully gained voter approval for mill levy overrides to bring additional funds into their schools by the 2020-21 school year. These override mills collectively bring in $1.4 billion a year, but the amount of revenue generated varies dramatically among those districts with overrides in place—even when the mills are similar and student population size is comparable. Aspen School District’s 1.9 voter-approved override mills generated $6.1 million in FY 2020-21 for 1,600 students, for example, while Eaton School District in northeast Colorado brought in $2.7 million that year for 1,900 students through its 3.8 override mills.
As shown in the map in Figure 9, on a per pupil basis, the Metro region districts bring in lower amounts through their override mills due to comparatively high student enrollment. Those districts generating larger amounts of mill levy override revenue are resort communities and some rural areas with low enrollment.
The passage of HB21-1164 cannot fully address inequitable funding due to these varying levels of mill levy overrides, disparate property wealth and a funding formula that prioritizes district characteristics such as cost of living over the needs of students. Continuing with Aspen School District as an example, and considering all local, state and federal dollars on a per-pupil basis (including mill levy overrides), Aspen far outpaces its neighbor, Lake County School District (see Figure 10). Even though the two districts are just miles apart, their populations are as different as their education funding levels.
In Lake County, 70 percent of students are nonwhite and 59 percent are in poverty, compared with Aspen’s students of whom 16 percent are nonwhite and 3.2 percent are in poverty. With local, state and federal revenues combined, Aspen has approximately $10,000 more per pupil than Lake County to spend on K-12 education. Because of the drastic differences in funding and demographics, the national nonprofit Ed-Build has identified the Aspen/Lake County border as one of the most “divisive borders” in the country.[xii]
Figure 9: Mill Levy Override Revenue Per Pupil
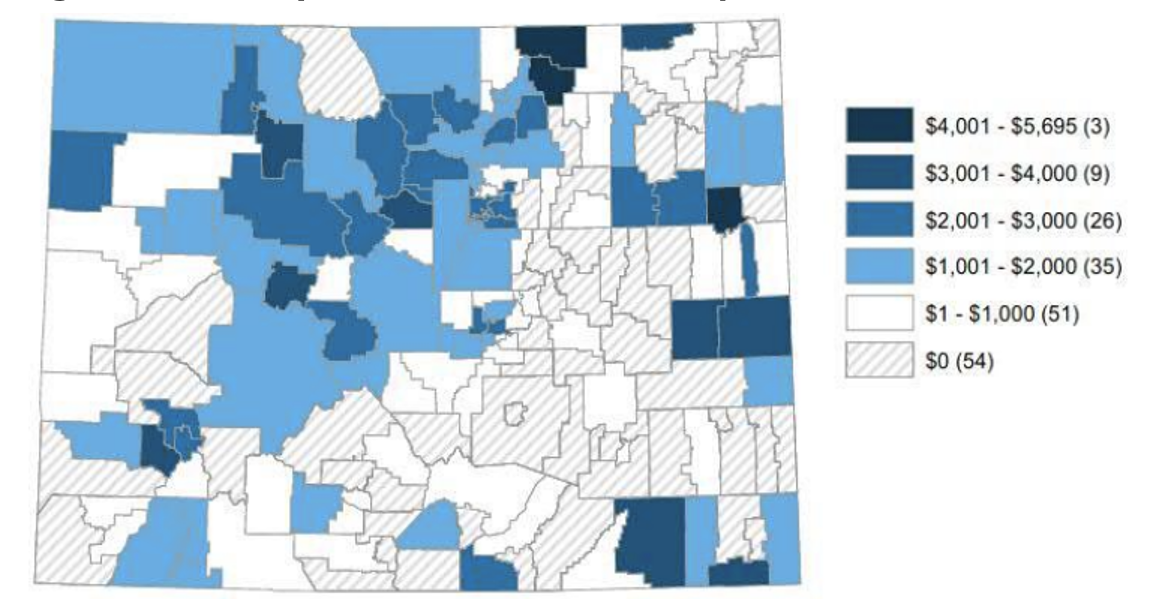
Source: Legislative Council Staff, 2021 School Finance in Colorado.
Note: Numbers in parentheses indicate the number of school districts in each tier.
Figure 10: Estimated FY22 Per-Pupil Funding Comparison between Lake County School District and Aspen School District
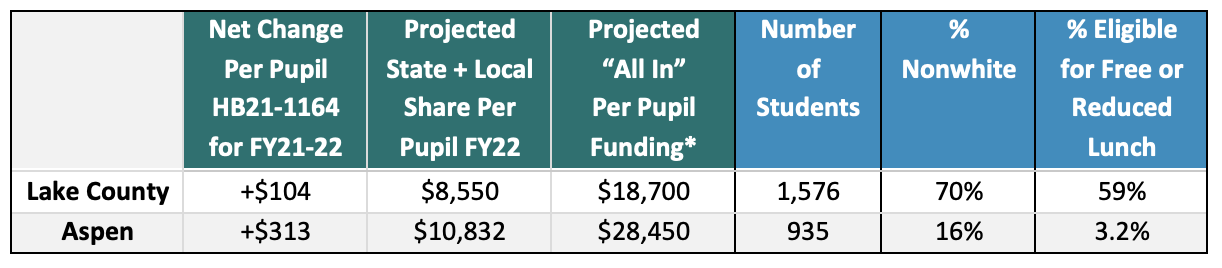
* “All in” funding is calculated by applying the projected net change under HB21-1164 to 2020 total funding, which includes federal funds, mill levy overrides and other sources of local revenue, and state grants. Demographic data is for 2020-21.
Source: HB21-1164 Fiscal Note; Colorado Department of Education
Figure 11 considers the proportions of local, state and federal revenue by region. The Northwest region, which is comprised of school districts with higher total program mill levies, relies the most heavily on local property tax revenue. The region receives nearly a third of their total revenues through local sources (63.8 percent in 2020), and, correspondingly, the Northwest region has the smallest share of state funding of all regions (31.5%).
Given the Charter School Institute’s unique constitution as a statewide charter authorizer, its schools do not have taxing districts and thus do not collect any revenue from property taxes and rely largely on state appropriations. Aside from the Charter School Institute, the Southeast region receives the smallest proportion of revenue from local sources (23.2% in 2020). Accordingly, the Southeast’s share of revenue coming from state sources is the highest among the traditional school districts (69.5%).
Figure 11: Local, State and Federal Revenue as a Share of Total Revenue, By Region
Note: Total revenue includes local, state and federal funding from all sources, including mill levy overrides and state and federal grants. The Charter School Institute does not receive any revenue from property taxes and thus has low proportions of local revenue funding.
Figure 12 displays local, state and federal revenue in nominal and real dollars by region. With adjusting for inflation, total revenue went up for all districts from 2010 to 2020, but 6 districts saw in a dip in revenue in 2015.
Figure 12: Local, State and Federal Revenue, Nominal and Adjusted for Inflation
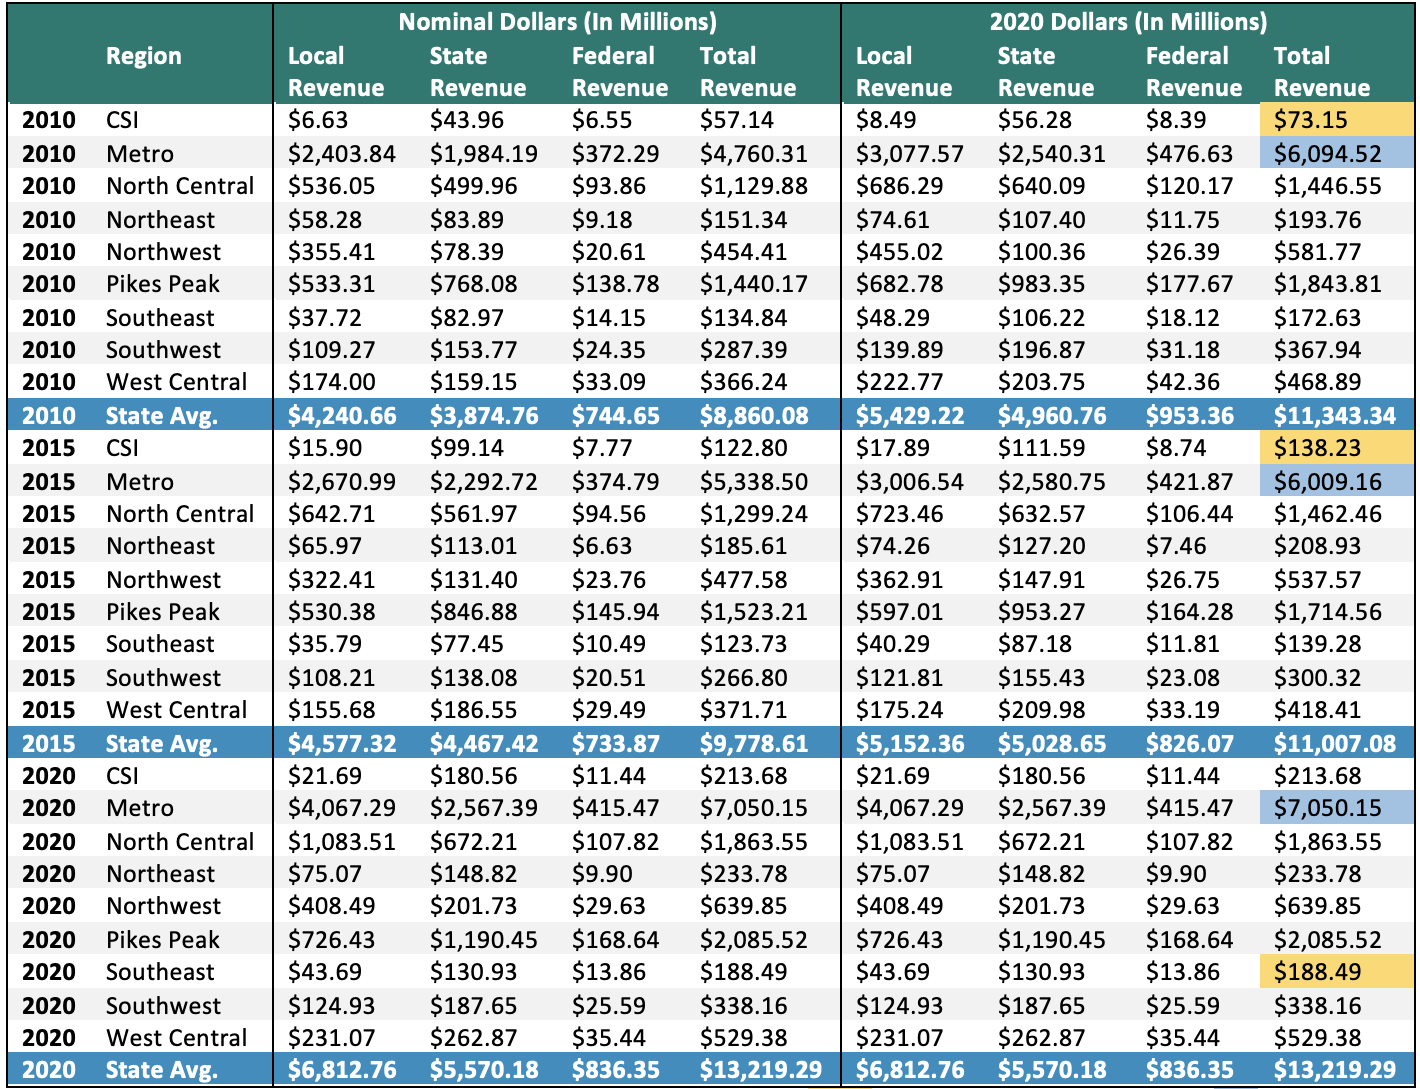
CSI = Charter School Institute; Lowest revenue amounts highlighted in yellow; highest amounts highlighted in blue.
Figure 13 shows total revenue (local, state and federal) per funded pupil by region, adjusted for inflation. In FY 2020, the Northwest region had the highest average per pupil revenue, topping $17,570 per student. The Charter School Institute has the lowest average at approximately $12,000 per student. The statewide average per pupil funding amount when considering all revenue sources was $14,574 in FY 2020.
Figure 13: Total Revenue Per Pupil, By Region
Trends in Education Spending
Total expenditures have increased in nominal dollars across all regions from FY 2010 to FY 2020. The Charter School Institute, which had exponential growth in its student population, saw its expenditures increase 327 percent from FY 2010 to FY 2020. In terms of aggregate spending, the Metro region far exceeds all other regions with a total expenditure of $7.9 billion.
Figure 14: History of Total Expenditures by Region
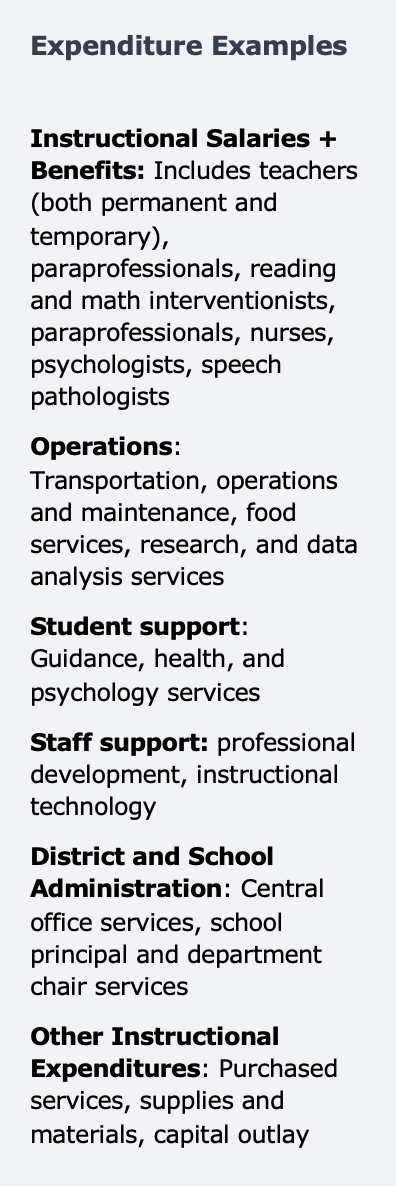
High-level expenditure categories include instruction, support services and other.
- Instructional expenditures include items such as salaries and benefits for instructional staff, supplies and materials and purchased services.
- Support services expenditures include salaries and benefits for school and district administrators, support for students (e.g. guidance counseling, health and psychology services), and support for staff (e.g. professional development). Operational expenses including transportation, maintenance, and food services are also included under the broad support services category.
- The other category consists of construction and facilities acquisitions (e.g. acquiring land and buildings; constructing or remodeling buildings; improving sites), debt (payments of principal or interest; debt issuance costs; fund transfers), and refinancing. Expenditures in the Other category are not typically associated with the day-to-day operation of school activities and are excluded from the analysis in the remainder of this section (after Figure 15).
Figure 15: Percent of Total Expenditures: Instructional, Support and Other
As shown in Figure 15, instructional services accounted for 44 percent of total spending, while support services comprised 30 percent and other spending rounded out the remaining 27 percent. There has been a decrease in spending on instruction and an increase in spending on support services over the past 10 years.
The remainder of the analysis in this section focuses on instruction and support expenditures, looking at the various spending activities within those broad buckets.
Instruction and Support Expenditures
In 2020, average per pupil spending on instruction and support ranged from a low of $10,865 for the Pikes Peak region to an average high of $13,753 for districts in the Northwest region (see Figure 16).
Looking from 2010 to 2020, per pupil spending on instruction and support in nominal dollars grew slowly between 2010 and 2015 due to the recovery from the Great Recession. The five years between 2014-15 and 2019-20 saw more growth in spending, right before the pandemic hit in spring 2020.
Figure 16: Instruction and Support Expenditures Per Funded Pupil, by Regio
 Figures 17 and 18 consider instructional and support spending by category. As shown in Figure 17, the share of total spending being allocated to instructional salaries has decreased on average across the state between 2010 and 2020, from 41 percent to 35.6 percent. At the same time, instructional benefits saw an increase from 9.7 percent to 11.6 percent of total spending. This phenomenon relates back to the problems surrounding K-12 education’s retirement system (PERA). As long as the PERA burden requires increased funding, there will be fewer dollars available for instructor salaries and classroom support.
Operations, school and district administration and supports for students all saw increases as a share of total spending from 2010 to 2020. The other instructional expenditures category, which includes purchased services, supplies and materials, capital outlay and other miscellaneous spending saw a decline in its share of spending.
Figure 18 shows categorical spending for FY 2020 by region. The share of spending on instructional salaries and benefits ranges from 40.1 percent in the Southeast region to 48.8 percent in the Northwest. Spending on school and district administrators as a share of total expenditures ranges from 7.4 percent in West Central region to 13.1 percent in the Southeast region.
Figure 17: Share of Total Spending on Instructional and Support Expenditure Categories Statewide
Figure 18: Share of Total Spending on Instructional and Support Expenditure Categories by Region, 2020
Trends in Teacher Salaries and Turnover
Research consistently points to teachers as the most important school-based factor affecting student success; they are the front-line workers who have the most influence over our children’s education.[xiii] It is critical to ensure that teachers are appropriately compensated. Schools need to pay competitive wages to attract high quality teacher and promote student success. Given that public education is largely dependent on taxpayer dollars, it is also important to maximize the cost efficiency of the system and strategically target resources where most needed.
The issue of whether teachers are adequately compensated is confounded by several factors. Areas with higher costs of living necessitate higher salaries. Harder to staff subject areas such as mathematics and science may demand higher wages.[xiv] Turnaround schools are difficult environments to teach in and research shows offering higher salaries helps boost retention, which may in turn help schools improve quicker.[xv] Offering higher salaries in rural areas could help attract teachers who otherwise would seek out positions in suburban and urban areas.
Teacher Salaries
The following data highlight trends in teacher salaries by region and among school districts in the Metro Denver area to demonstrate local differences.
Figure 19: Average Teacher Salaries Over Time
In 2020-21, the state average teacher salary was $58,219. The state average, however, masks the wide variation in salaries that occurs at the regional and school district level. Urban and suburban salaries outpace rural salaries even as the cost of living in the rural areas has increased. As displayed in Figure 19, the average salary for the metro region in 2020 was $60,656, compared to the Southeast region’s average salary of $40,170. All regions saw a growth in average salaries between 2015 and 2020.
Teacher salaries in 95 percent of the state’s rural districts are below the cost of living for their area, according to the teacher shortage report released by Colorado’s K-12 and higher education agencies. The report states that the wage disparity is negatively affecting hiring and retention efforts in rural areas.[xvi]
Even within the Metro region, average salary levels vary widely (see Figure 20). School districts have discretion over how to allocate their state funds, including how much to pay their teachers (sometimes set through a collective bargaining agreement) and whether to prioritize teacher pay or other expenditures such as administrator pay, operations or support services.
Figure 20: Average Teacher Salaries and Turnover Rates, Metro Region School Districts, 2020-21
Size of bubble represents the number of teachers employed in the district
Figure 20 displays average salaries and turnover rates for teachers at Metro region districts. Boulder had the highest average salary in 2020 at $82,150, while districts that are on the rural outskirts of the metro region had much lower average salaries.
There is a clear correlation between salary level and turnover rates, but the correlation maybe be caused in differing ways. Districts with high turnover may be hiring younger teachers each year who are being paid the lower starting salary wage, thus driving down the average. For example, Sheridan School District No. 2 had 26.9 percent turnover, which is 10 percentage points higher than neighboring districts, and the average salary for teachers in Sheridan is on the lower range for the region.
Boulder, Cherry Creek and Littleton have the highest average salaries and have low turnover, which could reflect having a more veteran workforce and carrying higher wages for those veterans. The data could also reflect that teachers are motivated by the higher salaries to remain in those districts.
Further, there are outlier districts with low turnover and low wages, such as School District 27J, which serves the city of Brighton and parts of Thornton and Commerce City. The average teacher wage at School District 27J was $52,095 in 2020. Despite low average wages, School District 27J has the second lowest turnover rate out of the 18 Metro region districts, just behind Boulder Valley. School District 27J has an average teacher salary that is nearly $10,000 below neighboring Adams 14 School District’s average, but the turnover rate for Adams 14 is twice as high as the rate for School District 27J.
Teacher Turnover
As depicted in Figure 21, average turnover rates for teachers statewide were lower than the average turnover rates for district administrators in FY 19, FY 20 and FY 21. Notably, teacher turnover declined during the pandemic while district administrators were more likely to leave their position. In FY 2020-21, the turnover rate for district administrators was 34.4 percent — nearly 2.5 times the turnover rate for teachers (14.3%). School principals also had a declining turnover rate during the pandemic, going from 17.3 percent in FY 2019 to 13 percent in FY 2021.
The average turnover rate in FY 2021 for Colorado employees in all other industries is 2.9 times the turnover rate for teachers—41.5 percent compared to 14.3 percent. Other industries saw a notable increase in turnover rates from the pandemic as evidenced by the FY 2020 data.
When comparing Colorado’s teachers to education personnel nationwide, their turnover rates are also lower, with the US Educational Services category seeing turnover rates of 26.7 percent in FY 2021.
Figure 21: Teacher Turnover Compared with Other Industries, FY 2019 through FY 2021
According to the Teaching and Learning Conditions Colorado (TLCC) survey, last administered in 2020, 82.2 percent of teachers who responded to the survey intended to remain in the same position as a teacher in their current school (see Figure 22).[xvii] Another 9.5 percent the respondents said they would be continuing to teach at a different school. Only 3.7 percent of teachers responding to the survey stated they were leaving the field of education altogether. This is up from 2.3% in 2018 when the survey was previously administered, but the 3.7% figure remains drastically lower than percent of teachers remaining in the profession.
The TLCC survey also asked teachers what most affects their decision to stay teaching at their school, and over 67.4 percent cited school staff or school leadership. The next most popular response was salary with 12.8 percent of teachers saying that was the biggest factor in their decision to remain a teacher at their current school.[xviii] National research on teacher retention corroborates Colorado’s survey data and finds that salary, while important, is not the leading factor in why teachers choose to leave the profession.[xix]
Figure 22: Future Employment Plans of Teachers Responding to 2020 TLCC Survey
Source: TLCC 2020; n=36,589 for this survey question
The variation in salary trends among regions underscores the point that school districts have discretion over how they spend their funds, and they choose to exercise that discretion in different ways. Further, data and research on teacher turnover highlights that while salaries are a critical component of respecting the profession and rewarding teachers, it is even more important to focus on establishing a positive school culture and developing strong school leaders. Generalizing that all teachers across the state are leaving the profession en masse due to their salary level does not reflect the data and prevents thoughtful, targeted policy solutions from arising.
Conclusion
This report provides a look at trends in K-12 revenues and spending at the state level and by region to build a common understanding of how public education is funded in Colorado. The study also looks at teacher salaries and turnover rates with a goal of providing baseline data and analysis to ground ongoing discussions about public education funding in facts.
The analysis and findings presented here make a case for careful thought to be given to this policy area. The current funding system has serious structural flaws and increasing revenues without addressing those flaws is unlikely to improve student outcomes. As the School Finance Act stands now, funding for K-12 education is collected from taxpayers and distributed to school districts in an inequitable manner, and simply adding more dollars into the system will only perpetuate those inequities. The formula favors district characteristics such as district size and cost of living over student needs.
The Legislative Interim Committee on School Finance is convening throughout fall 2021 and fall 2022 with an intent to consider ways to modernize the school funding formula, better account for student poverty within the funding system and address inequitable mill levy override revenue. These conversations are politically and technically challenging, but it is more important than ever to ensure that students have access to the resources they need as they recover from COVID-19 learning loss.
Education is, and should continue to be, a locally controlled enterprise. Those who are closest to students have the best information about what learning environments are right for their children. At the same time, understanding the differences in education funding that arise at the regional and school district level will allow for more informed policy conversations. With this data, Coloradoans can develop solutions to create a modern and efficient funding system that attracts the best teaching talent and provides high-quality educational experiences for all students.
© 2021 Common Sense Institute.
Endnotes
[i] Joint Budget Committee. Budget in Brief Fiscal Year 2019-20. Retrieved from: https://leg.colorado.gov/sites/default/files/fy19-20bib.pdf
[ii] Colorado Legislative Council Staff. (2021). 2021 School Finance in Colorado. Available at: https://leg.colorado.gov/publications/school-finance-handbook-2021
[iii] Extended high school programs include, ASCENT, or Accelerating Students through Concurrent Enrollment, which is a program that allows students to remain in high school for one year past 12th grade to take college courses. Per pupil funding is provided to school districts to pay for community college tuition for ASCENT students. Only those students who have earned at least 12 credit hours of postsecondary courses prior to completion of the 12th grade year are eligible for the ASCENT Program. School districts receive the same per pupil amount for multidistrict online and extended high school students: $8,130 in FY 2021-22.
[iv] Presentation to the Legislative Interim Committee on School Finance by Legislative Council Staff and the Office of Legislative Legal Services. “School Finance 101.” August 24, 2021. Available at: https://leg.colorado.gov/sites/default/files/images/committees/2017/final_-_2021_school_finance_101_presentation.pdf
[v] Colorado Legislative Council Staff. (2021). 2021 School Finance in Colorado. Available at: https://leg.colorado.gov/publications/school-finance-handbook-2021
[vi] Legislative Council Staff and the Office of Legislative Legal Services, “School Finance 101.”
[vii] Common Sense Institute. (2020) Colorado Budget: Then and Now. Available at: https://commonsenseinstituteco.org/co-budget-then-and-now/
[viii] PERA 2020 Comprehensive Annual Financial Report, Available at: https://www.copera.org/investments/pera-financial-reports
[ix] Colorado Department of Education data. Count of teachers in 2020-21 was 55,842.
[x] Common Sense Institute. (2021). $2.5 Billion in COVID-19 Federal Relief Funding to Colorado’s K-12 Education System, Available at: https://commonsenseinstituteco.org/2-5-billion-in-covid-19-federal-relief-funding-to-colorados-k-12-education-system/
[xi] https://www.zillow.com/co/home-values/
[xii] EdBuild. (2019). Dismissed: American’s most divisive borders. Retrieved from: https://edbuild.org/content/dismissed
[xiii] Hanushek, E. A. (2011). Valuing Teachers: How much is a good teacher worth? EducationNext. Vol. 11, No. 3. Available at: https://www.educationnext.org/valuing-teachers/
[xiv] Hansen, M.; Breazeale, G.; Blankenship, M. (2019). STEM teachers are most in need of additional pay. Brookings Institution. Available at: www.brookings.edu/blog/brown-center-chalkboard/2019/06/17/stem-teachers-are-most-in-need-of-additional-pay/
[xv] Clotfelter, C.; Glennie, E.; Ladd, H.; and Vigdor, J. (2008) Would higher salaries keep teachers in high-poverty schools? Evidence from a policy intervention in North Carolina. Journal of Public Economics, Volume 92, Issues 5–6.
[xvi] Colorado Department of Higher Education. (2017). Teacher Shortages Across the Nation and Colorado: Similar Issues, Varying Magnitudes. Retrieved from: https://highered.colorado.gov/Publications/Reports/teachereducation/2017/TeacherShortages_Nation_Colorado_Dec2017.pdf
[xvii] Cambridge Education. (2020). Teaching and Learning Conditions in Colorado Survey: Summary Report. Retrieved from: https://tlcc-2020-reports.cedu.io/
[xviii] Ibid.
[xix] See, e.g.: Allensworth E.; Ponisciak, S.; Mazzeo, C. (2009). The Schools Teachers Leave: Teacher Mobility in Chicago Public Schools. Chicago, IL: The Consortium on Chicago School Research. Retrieved from: https://consortium.uchicago.edu/sites/default/files/2018-10/CCSR_Teacher_Mobility.pdf.
Phillips, O. (March 30, 2015). Revolving Door of Teachers Costs Schools Billions Every Year. NPR. Retrieved from: https://www.npr.org/sections/ed/2015/03/30/395322012/the-hidden-costs-of-teacher-turnover.