

An In-Depth Look at Graduation Rates for Students of Color
Author: Dr. Brenda Bautsch Dickhoner
ABOUT THE AUTHOR
Dr. Brenda Bautsch Dickhoner is the Common Sense Institute’s Education Fellow. Brenda has spent the last decade working in education policy at the national and state level. Most recently, at the Colorado Department of Education, she developed and implemented policies to ensure all students have access to a high-quality education. Highlights of Brenda’s work include helping Colorado’s Commissioner and the State Board of Education determine actions to take to improve the state’s lowest-performing schools and districts. She supported the Education Leadership Council in crafting a nonpartisan, statewide vision and strategic plan for Colorado. Brenda also successfully drove the adoption of state legislation to bolster supports and accountability for schools.
Prior to CDE, Brenda served as an expert for the Colorado Department of Higher Education on research and policy related to college access and success. She began her career at the National Conference of State Legislatures where she advised state legislators in numerous states on education policy.
Brenda earned a Ph.D. in Public Policy at the University of Colorado Denver School of Public Affairs and studied political science as an undergraduate at Duke University.
ABOUT COMMON SENSE INSTITUTE
Common Sense Institute is a non-partisan research organization dedicated to the protection and promotion of Colorado’s economy. CSI is at the forefront of important discussions concerning the future of free enterprise in Colorado and aims to have an impact on the issues that matter most to Coloradans.
CSI’s mission is to examine the fiscal impacts of policies, initiatives, and proposed laws so that Coloradans are educated and informed on issues impacting their lives. CSI employs rigorous research techniques and dynamic modeling to evaluate the potential impact of these measures on the Colorado economy and individual opportunity.
Common Sense Institute was founded in 2010 originally as Common Sense Policy Roundtable. CSI’s founders were a concerned group of business and community leaders who observed that divisive partisanship was overwhelming policymaking and believed that sound economic analysis could help Coloradans make fact-based and common sense decisions.
Introduction
 The course of one’s life can be dramatically altered for the better by receiving a high-quality education. Reducing academic achievement gaps between students of color and white students results in numerous individual and societal gains. Individual benefits of a high-quality education include higher wages, longer life spans, reduced reliance on social welfare programs, and increased civic participation. Societal benefits include greater economic productivity, reduced income inequality, and a more engaged citizenry. It is a moral and economic imperative that every student has access to a high-quality education that will enable them to thrive as an adult. In fulfilling this imperative, we must support and replicate those educational models that are getting better outcomes for students, and in particular, for students of color.
Our education system has an array of different school types including district-run public schools, charter schools, and private schools. Most students attend district-run public schools, which are becoming increasingly varied in instructional approaches and models. In fact, many parents are using the state’s open enrollment system to “choice” into district-run schools that are not their assigned neighborhood school. In addition, a growing number of families are choosing charter schools. Despite the high numbers of parents participating in school choice of some form, there continues to be a great deal of inaccurate and misleading information and charter schools are taking the brunt of the negative criticism.
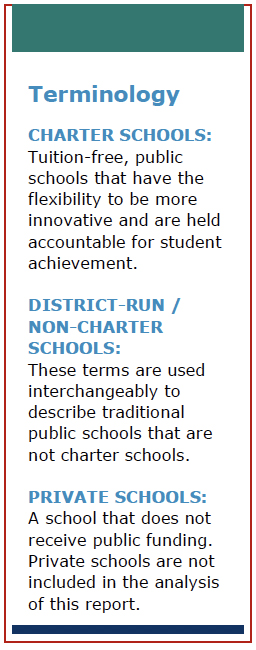
Charter schools are tuition-free, public schools that have autonomy to implement new and innovative educational models in exchange for clear accountability for student achievement.1 Charter schools are located throughout Colorado and vary in size and type of educational model. A charter school can look like a large STEM-focused high school in Denver with over 90 percent students of color, or it can look like a small rural school in North Routt focused on expeditionary learning and outdoor education. Charter schools provide options for parents who are looking for schools best able to meet their child’s individual needs.
This report seeks to add accurate data and research to the conversation on charter schools and school choice. The first section of the report provides an overview of the charter landscape in Colorado, followed by a review of the research on charter schools. The second section takes a detailed look at graduation rates at Colorado’s charter and non-charter high schools. While graduation rates are just one metric of performance, it is a meaningful indicator. Students need a high school diploma to successfully launch the rest of their lives and be productive members of the workforce and society. Importantly, this report considers the effects on students of color when possible. While achievement gaps persist overall, charter schools appear to be closing gaps in some areas across the country and in Colorado.
Charter Schools in Colorado
Charter schools are public schools that operate under a charter, or contract, between the school and its authorizer. In Colorado, an authorizer can be either a local school district or the Charter School Institute, which is a statutorily created statewide charter school authorizer. Charter schools began operating in Colorado after the legislature enacted the Charter Schools Act in 1993. The legislative intent was to “create a legitimate avenue for parents, teachers, and community members to implement new and innovative methods of educating children that are proven to be effective and to take responsible risks and create new and innovative, research-based ways of educating all children within the public education system” (CRS 22-30.5-102). Thus, instead of the local school district operating and managing the school, a charter school is run by a group of families, educators or members of the community. Unlike most district-run schools, which have enrollment boundaries and automatically assign children to schools based on their address, parents must proactively choose to attend a charter school.
Since charter schools are public schools, they are tuition free and open to all students who wish to apply. Funding comes through the state’s education finance formula on a per pupil basis, as it does for district-run schools. When a charter is established, it is generally done so with certain waivers from state regulations that give the charter school more flexibility than non-charter schools in areas such as hiring and talent management, school budget, curriculum, educational program, and general school operations. In exchange for flexibility, the charter school is expected to meet the performance benchmarks that have been specified in its charter. The authorizer and the charter school governing board are expected to hold the school accountable and take actions to correct course if performance expectations are not being met.
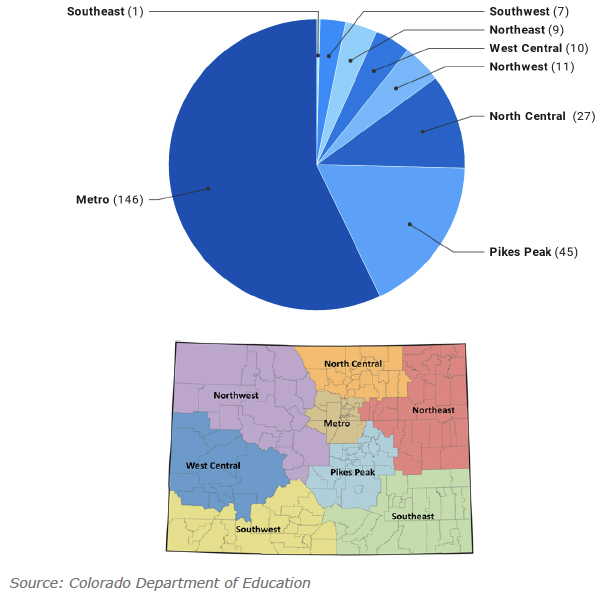
Geographic Distribution of Charter Schools in Colorado
Charter schools operate in all regions of Colorado serving students in grades PreK through 12. Local school districts authorize 85 percent of the state’s charter schools while the Charter School Institute (CSI) authorizes 15 percent of charter schools located throughout the state. As depicted in Figure 1, the Metro Denver region is home to about half of the state’s charter schools. This pattern is true in other states as well. In general, charter schools across the country are more likely to be located in urban areas.2 Relative to other states, though, Colorado has a sizable number of rural charter schools. There is also a significant concentration of charter schools in the urban-suburban settings of the Pikes Peak region and the North Central region, which are home to 18 percent and 11 percent of charter schools in the state, respectively.
Figure 1: Number of Charter Schools by Region, 2018-19
Charter School Enrollment Trends
Since 1993, when the state Charter Schools Act was passed, the number of charters schools operating in Colorado has grown each year. As displayed in Figure 2, the number of charter schools has increased by around 40 to 60 schools every five years. This number accounts for school closures and the opening of new schools.
Figure 2: Number of Public Charter Schools Operating in Colorado Over Time
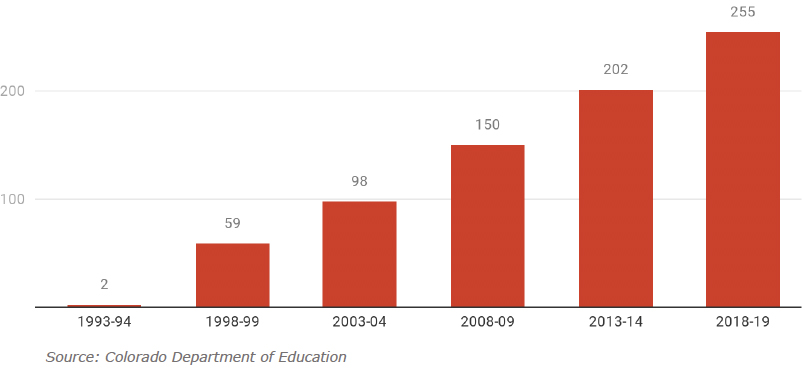
During the 2018-19 school year, charter schools served over 124,500 students in grades PreK through 12 in 255 schools. Over 13 percent of students statewide are attending charter schools. According to the Colorado Department of Education (CDE), “if all charter schools were organized within a single district, it would be the largest school district in the state” (CDE, 2020, 6). For reference, the largest school district in the state in 2018-19 was Denver Public Schools, which enrolled 91,998 students in its schools (including its charter schools). Within Denver Public Schools, over 20,600 students, or 22.4 percent of students, attend charter schools. That constitutes the largest number of students attending charter schools within a traditional school district.3
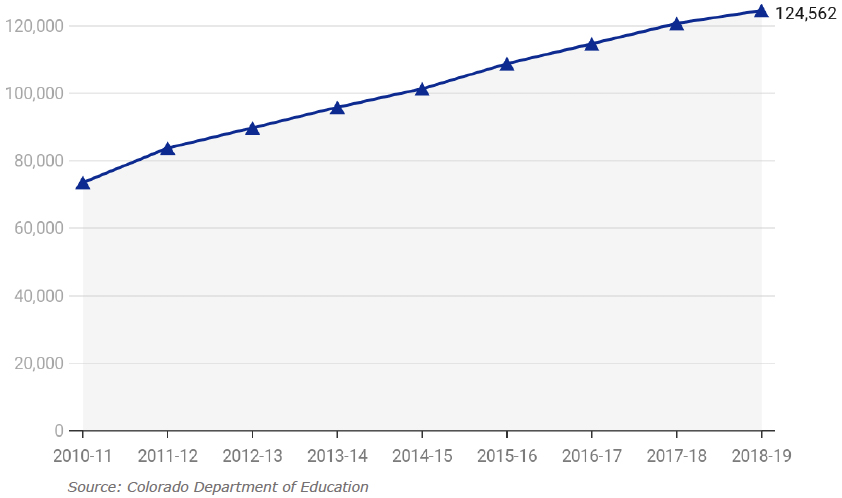
As shown in Figure 3, enrollment in charter schools has increased year over year from 2010-11 to 2018-19. Growth in charter school enrollment has outpaced non-charter school enrollment in real numbers for seven of the nine school years in that time period. For the last three years, enrollment in district-run schools has decreased while charter school enrollment has continued to increase, although at a slower rate.
Figure 3: Charter School Enrollment Over Time
Characteristics of Students at Charter Schools
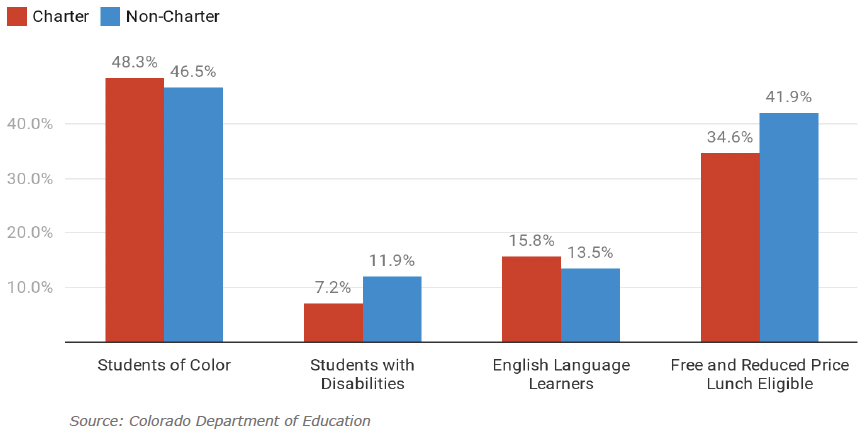
During the 2018-19 school year, charter schools served a higher percentage of students of color and English language learners than non-charter schools statewide (see Figure 4). Charter schools served a lower percentage of students with disabilities and students eligible for free or reduced-price lunch than non-charter schools.
Free and reduced-price lunch eligibility is used as a proxy for income level, but it is an imprecise measure due to the reliance on self-reporting and the fact that most Colorado charter schools do not have a full preparatory kitchen in which to prepare hot meals that qualify for reimbursement under the National School Lunch Program.
According to the Colorado Department of Education, the way Colorado’s charter law is structured, charter schools and their authorizer (the local school district or the Charter School Institute) have shared responsibility for providing special education services.4 Under a shared arrangement there are sometimes limitations on what type of services and programs charter schools can provide. For example, if a district houses a center-based program for autistic students at a non-charter school, that could lower the likelihood that autistic students would enroll at the district’s charter schools. Charter schools have also historically operated at a lower funding level than their district-run counterparts. The Colorado Department of Education notes that they are actively researching the issue to understand the factors at play and how to help charter schools expand access for students with special needs.5
Figure 4: Enrollment in Charter and Non-Charter Schools by Student Characteristics, 2018-19
Literature Review
Two prominent questions arise when discussing charter schools. First, how do students at charter schools perform compared to similar students at non-charter schools? Second, how do charter schools affect district-run schools? That is, do they harm district-run schools? Or alternatively, do they improve the performance of district-run schools through competitive pressure? This section considers the existing research on these questions and summarizes the high-level findings.
Overview of Research on Student Outcomes at Charter Schools
Researchers have used a variety of methods and data sets to analyze the performance of students at charter schools across the country compared to their peers at district-run schools. Overall, findings are mixed but generally indicate that charter schools see greater success in terms of student academic outcomes in many urban areas, whereas their impact is less noticeable in suburban and rural areas or when considering online schools.
Research on charter schools is complicated by the fact that families select into charter schools. There is concern among critics of charter schools that students who choose to attend charter schools are more highly motivated and have better academic performance at the outset. However, it could also be the case that a student has struggled in district schools and is looking to improve academic outcomes by attending a charter school. Thus, without proper statistical controls, the observed difference in performance between students in charter and non-charter schools could be tied to the characteristics of students rather than the instruction being better or worse at charter schools.
To address this problem of selection bias, many researchers have analyzed charter schools that use lottery systems to enroll students. These types of studies are viewed as the most statistically rigorous because of the natural experiment created by a lottery. Nearly all of the lottery-based studies have found that charter schools have positive effects on academic outcomes, with some studies finding large positive effects.6 Lottery-based studies, by definition, only include those charter schools that are oversubscribed, and the high demand from families to attend such schools could be because they are better performing schools. Thus, some argue that the results from lottery-based studies are confirming that better schools get better student outcomes, and that those findings do not necessarily tell us anything about charter schools that are not oversubscribed.7
Research studies of charter schools that look at a broader set of schools, not just those that are oversubscribed, have had mixed findings, and any positive impacts have been smaller than those found in lottery-based studies.8 The more consistently positive findings have been linked to charter schools in urban settings.
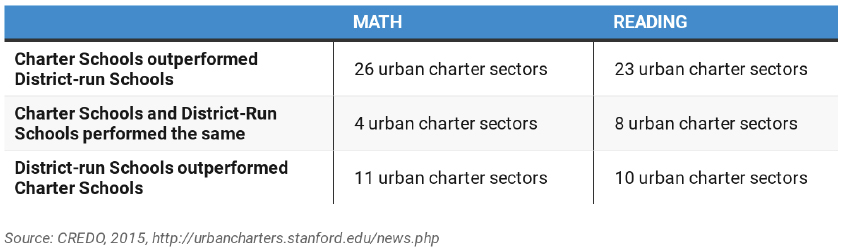
A 2015 study, for example, by Stanford University’s Center for Research on Education Outcomes (CREDO) compared the performance of students at charter schools and district-run schools within 41 urban regions across the country.9 Table 1 depicts the regional findings. In over half of the 41 urban communities charter schools were getting stronger results than district-run schools in math and reading.
Table 1: Findings from the Center for Research on Education Outcomes (CREDO)’s Urban Charter Schools Report, 2015
In the same report, the researchers found significantly higher learning gains in reading and math at urban charter schools across all student subgroups, with minority and low-income students seeing the largest academic gains. The study found that the academic growth experienced by low-income Black students in charter schools equaled 59 days of additional learning in math and 44 days of additional learning in reading as compared to their peers in non-charter schools. Hispanic students in poverty also had large gains equivalent to 48 days of additional math learning and 25 days of additional learning in reading as compared to their peers in district-run schools.10 These results are more positive than studies CREDO has conducted of charter schools nationally, where the lower performance of online and rural charter schools negates the positive performance of urban charter schools.
Other studies of urban areas have also found strong positive effects. A study of charter schools in Boston found that charter schools close the achievement gap entirely between white and Black students in reading and math at the high school level.11 Other researchers found that Harlem charter schools in New York City have closed the Black-white achievement gap at the elementary level in reading and math and at the middle school level for math.12
Considering Denver specifically, a 2019 CREDO study compared learning gains in reading and math of Denver charter school students with that of similar students attending district-run schools, controlling for student characteristics. The study covered the 2014-15, 2015-16, and 2016-17 school years. The results indicate that charter school students in Denver outperformed their peers in district-run schools when considering reading growth in 2014-15 and 2015-16 and math growth in 2014-15. CREDO also found that Black students attending charter schools saw stronger growth in reading than their peers in district-run schools.13
In its triennial report on charter schools, the Colorado Department of Education (CDE) provides a descriptive analysis of charter school performance in the state. While the analysis does not employ robust statistical methods as the studies cited above do, the data describes overall trends for the state. CDE notes that over the past three years, performance on statewide English and mathematics assessments for grades 3-8 and on the PSAT/SAT for grades 9-11 has been higher at charter schools that at non-charter schools—both for students overall and for disaggregated groups of students (i.e. students of color, low-income students, English Language Learners, and students with disabilities). CDE also notes that charter schools, on most metrics, have smaller achievement gaps between subgroups of students (for example, between students of color and white students).14
Overview of Research on the Effect of Charter Schools on District-Run Schools
Education policy is frequently discussed in terms of a zero-sum game. Critics of charter schools claim that if a family chooses to leave their district-run school and enroll in a charter school, the district-run school is harmed because funding follows the student to the charter school. Further, critics argue that because charter schools “cherry pick” the best students, this results in compounded harm by leaving district-run schools to serve lower-performing students with less funding.
Regarding claims that charter schools cream the best students from district-run schools, multiple research studies have found no evidence to support that claim when analyzing test score data. Similarly, researchers have found little evidence to support claims that charter schools push out low-performing students.15
In addition, Colorado has an open enrollment system that allows families to “choice” into district-run schools beyond their assigned neighborhood school. In fact, over 145,000 students choice into district-run schools through open enrollment—more than the number of students enrolled in charter schools.16 Thus, when the debate over school choice focuses solely on charter schools, it misleads the public and hides the current reality that many parents participate in Colorado’s robust open enrollment system to find a school best suited for their child’s unique needs. That school may be a charter school, or it could also be one of the many different types of district-run schools (innovation, magnet, STEM, arts, etc).
Many researchers, however, have analyzed test data to determine if charter schools impact the outcomes of students at nearby district schools. Researchers have done this to investigate both the notion that charter schools harm district-run schools and the opposite theory from proponents of charter schools that competition will improve performance at district-run schools. A dozen research studies have used various methodologies to try to assess any such indirect effects. Most of the studies have found no significant impact of charter schools on the performance of district-run schools, and some have found positive effects.17 To date, only one study of one school district has found negative effects of charter schools on district-run schools.18 A researcher that thoroughly surveyed the literature on this topic concluded: “It appears that charter schools need not represent a zero-sum game. Instead, most of the research implies that charter schools do no harm to students in district schools and may even promote improved outcomes for all students” (Gill, 2016).
Adding to the evidence that the education ecosystem is not a zero-sum game, a recent study by the Fordham Institute considered the effects of higher levels of “charter market share” within subgroups of students.19 The author looks at, for example, whether having more Hispanic students enrolled in charter schools within a geographic region has any effects on the overall achievement levels of all Hispanic students, including those attending district-run schools.
The findings indicate that in large urban districts, high levels of charter school enrollment of Black and Hispanic students result in higher levels of academic performance on average for all Black and Hispanic students (including those in non-charter schools).20 If the education market constitutes a zero-sum game, the better outcomes seen in charter schools in urban areas would theoretically be negated by the lower outcomes seen at district-run schools. The Fordham study thus concludes that their findings of overall increases in achievement in districts with a higher concentration of charter schools “implies that the additional learning that’s happening in charter schools is not coming at the expense of less learning in district schools. It’s additive. And that implies that kids in charters really are learning more—not because of who the kids are, but because of what the schools are doing.” (Griffith, 2019, 5).
Lastly, the research base on the financial impacts of charter schools on district-run schools is not as large, but it is the case that charter school students draw funding away from district-run schools when they transfer over. The impacts of charter school enrollment will vary based on the local context and the levels of charter enrollment. If a charter school draws a few students from several district-run schools, it is likely that those district-run schools can absorb the slight drop in their enrollment without making significant adjustments. If charter schools enroll a greater share of students from district-run schools, districts may have to make more difficult adjustments such as laying off teachers or consolidating schools with low enrollments.21 Researchers have found little evidence that the pressure of potentially losing students has changed the behavior of school districts to focus more intently on improving student achievement.22
Graduation Rates at Colorado Charter Schools
This section of the report provides an analysis of graduation rates at charter high schools as compared to non-charter, public high schools. This is just one metric of school performance. Additional information on the performance of students at charter schools can be found in CDE’s report entitled “2019 State of Charter Schools Triennial Report”.23
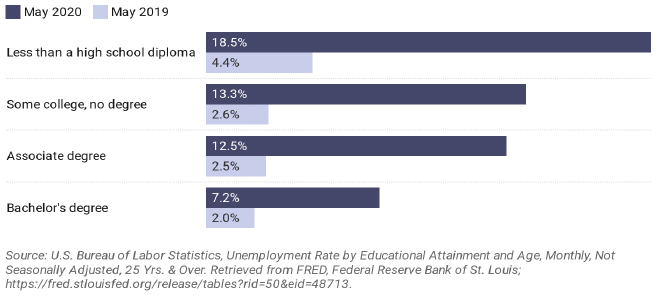
Graduation rates are an important component when measuring the performance of schools, because without a high school diploma the odds of young adults securing employment that provides life-sustaining wages is low. As seen in the recent COVID-19-induced economic devastation, individuals with less than a high school diploma are experiencing astounding levels of unemployment (see Figure 5).
Figure 5: Unemployment Rates by Educational Attainment
Statewide Graduation Rate Trends
The Colorado educational ecosystem includes an array of different high school models. For the purposes of this analysis, we will largely focus on the graduation rates of “traditional brick and mortar” high schools, which comprise over 75 percent of high schools in Colorado. These high schools vary immensely in terms of school size, location setting (urban, rural, suburban) and model (e.g. STEM focused, performing arts focused, comprehensive high school). The commonality is that students attend these traditional brick and mortar high schools in person (during normal times), and these high schools do not have a specialized focus on alternative education and are not designated as Early Colleges.
Figure 6: Charter and Non-Charter Graduation Rates by School Type, 2019
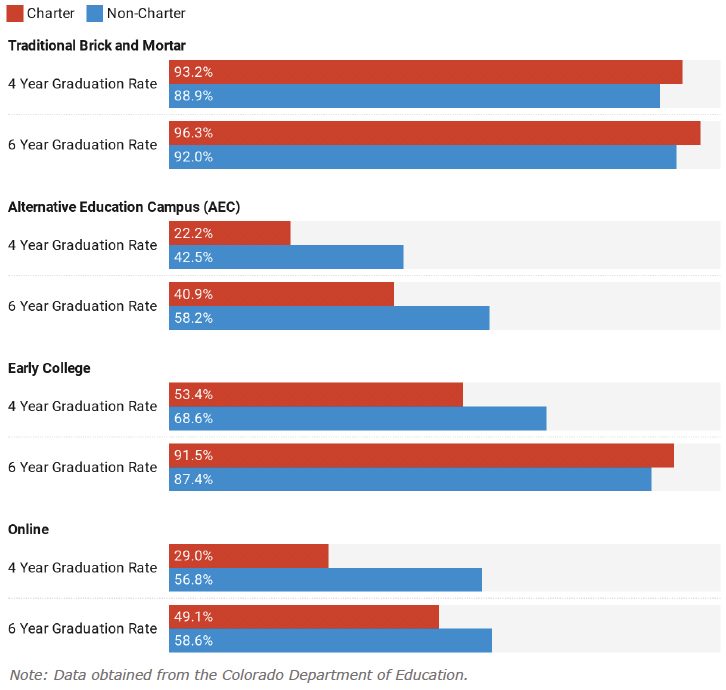
When considering traditional brick and mortar high schools, charter schools have higher graduation rates than non-charter schools (see Figure 6). The four-year graduation rate for brick and mortar charter schools was 93.2 percent in 2019 compared with 88.9 percent at brick and mortar non-charter high schools. The six-year graduation rates increase slightly from the four-year rates, with the rate for charter schools remaining 4 percentage points higher than non-charter schools.
When considering other school types, graduation rates vary. Non-charter alternative education campus (AEC) schools and online schools have better four- and six-year graduation rates than their counterparts in the charter sector. Alternate Education Campuses (AECs) are schools that have been designated by the Department of Education as serving high-risk student populations. Given the population they serve, AEC graduation rates are typically low, and as Figure 6 displays, the rates are even lower at AEC charters as compared to AEC non-charters. The four-year graduation rate for AEC charter schools is only 22.2 percent compared with 42.5 percent at non-charter AECs. Graduation rates are similarly low for online schools.
Early Colleges are high schools that receive special approval from the State Board of Education to provide a curriculum for students to complete both a high school diploma and an associate degree. A recent law change requires that the curriculum at an Early College must be designed to be completed within four years. As the data indicates, however, many Early College students are still taking more than four years to graduate. Non-charter Early Colleges have a higher graduation rate at the four-year mark, while Early College charter schools have a better six-year graduation rate.
Given that the unique circumstances of AECs, online schools and Early Colleges directly impact the graduation rates of those schools, the remainder of the analysis in this report is focused on traditional brick and mortar high schools, which serve over three quarters of the state’s public high school students.
Regional Graduation Rate Trends
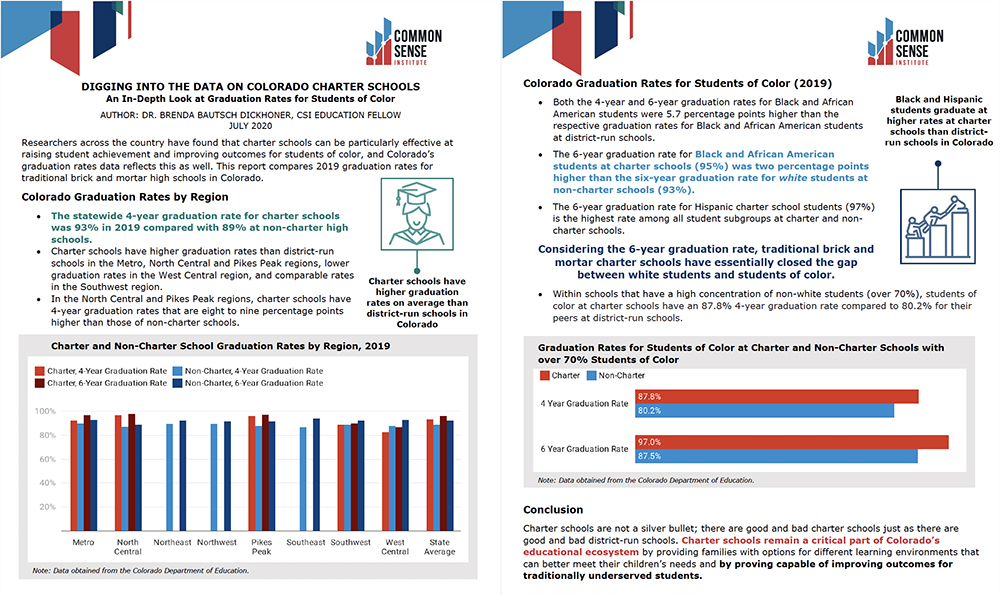
Brick and mortar charter high schools can be found in five of the eight regions of the state. Figure 7 displays 2019 graduation rates by region for charter and non-charter schools. Charter schools have higher graduation rates than non-charter schools in the Metro, North Central and Pikes Peak regions and lower graduation rates in the West Central region. District-run schools and charter schools perform comparably in the Southwest region.
Figure 7: Charter and Non-Charter School Graduation Rates by Region, 2019
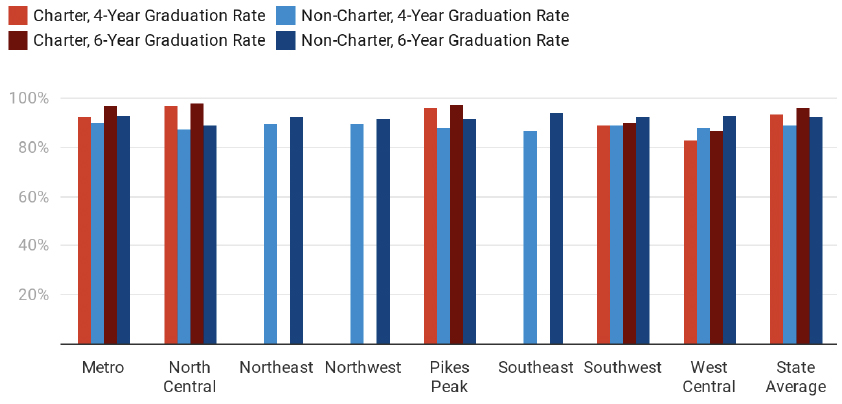
Table 2: Detailed Table of Charter and Non-Charter School Graduation Rates by Region, 2019
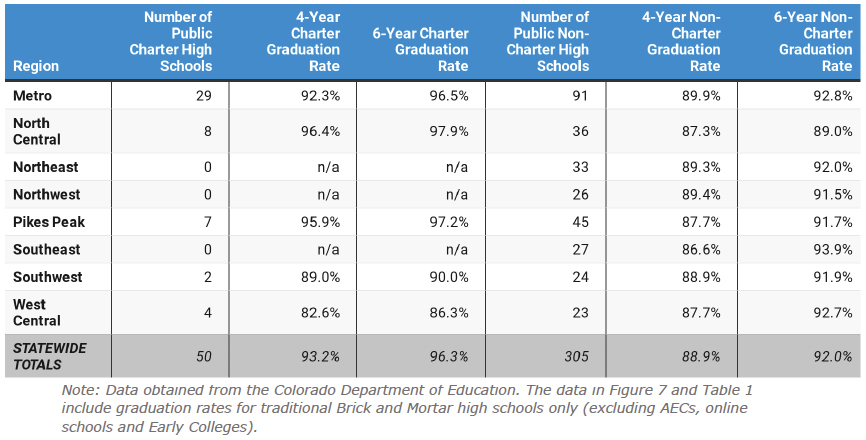
The 29 charter schools that are authorized by school districts in the Metro region have graduation rates that are two to three percentage points higher than those of the 91 non-charter schools in the region (see Table 2). Notably, the gap is wider in the North Central and Pikes Peak regions, which are collectively home to 15 charter schools. Charter schools in the North Central region have four- and six-year graduation rates that are nine percentage points higher than those of non-charter schools. In the Pikes Peak region, charter school graduation rates are five to eight percentage points higher than graduation rates at non-charter schools.
Graduation Rate Trends for Students of Color
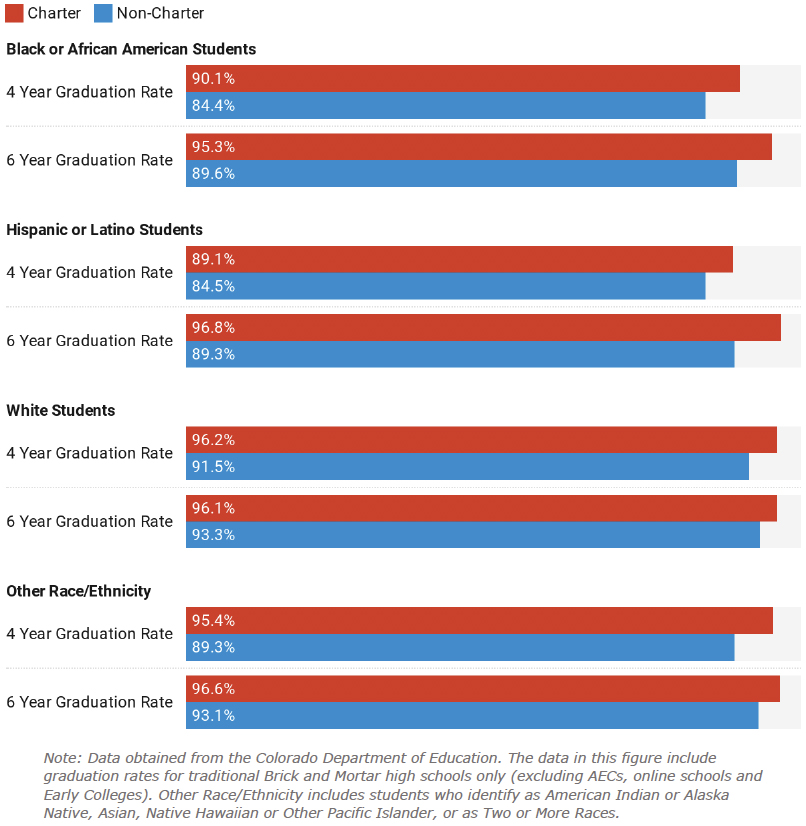
When considering traditional brick and mortar high schools, charter schools have higher graduation rates for students of all races and ethnicities than non-charter public schools (see Figure 8).
Both the four-year and six-year graduation rates for Black and African American students are 5.7 percentage points higher than the respective graduation rates for their peers at district-run schools. It is also notable that, in 2019, the six-year graduation rate for Black and African American students at charter schools was two percentage points higher than the six-year graduation rate for white students at traditional public schools (95.3 percent compared to 93.3 percent, respectively) and less than 1 percentage point below the six-year graduation rate of white students at charter schools (96.1 percent). Hispanic students at charter schools also have higher graduation rates than their peers at non-charter schools. In fact, the six-year graduation rate for Hispanic charter school students (96.8 percent) is the highest rate among all of the subgroups displayed in Figure 8. Overall, considering the six-year graduation rate, traditional brick and mortar charter schools have essentially closed the achievement gap between their white students and their students of color.
Figure 8: Charter and Non-Charter School Graduation Rates by Race/Ethnicity, 2019
In the aggregate data displayed in Figure 8, some schools have very few students of color while other schools have high proportions of non-white students. Another way to look at the data is to consider comparing charter schools that serve high proportions of students of color with non-charter schools that have similarly diverse populations. Figure 9 highlights the graduation rates for students of color at charter and non-charter schools where at least 70 percent of students identify as non-white. These schools are all located in the Metro and Pikes Peak regions or are authorized by CSI. When looking at all high schools in those regions or those authorized by CSI, the average percentage of students of color is approximately 45%. Thus, the schools analyzed here have an above average share of students of color.
Figure 9: Graduation Rates for Students of Color at Charter and Non-Charter Schools with over 70% Students of Color
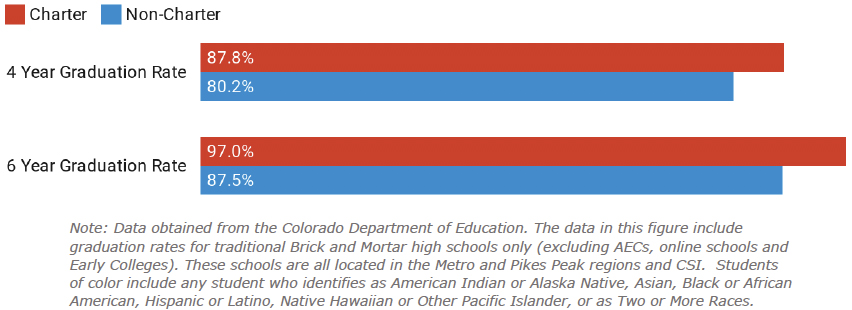
Within this cluster of schools, students of color at charter schools have an 87.8 percent four-year graduation rate compared to 80.2 percent for their peers at district-run schools. Six-year graduation rates for students of color are also higher at charter schools that serve a high proportion of non-white students than non-charter schools with a similar population.
Postsecondary Access and Readiness
Graduation from high school is critically important, but now more than ever it is also important for students to earn a postsecondary credential of value, whether a technical certificate, an associate degree, a bachelor’s degree or higher. Before the COVID-19 pandemic, about 75 percent of Colorado’s jobs required education or training beyond high school. Nearly all (97 percent) of the “top jobs” in Colorado, which pay well and have high numbers of openings, require postsecondary education.24 Further, a recent analysis found that on average, Colorado workers with an associate degree earn 11 percent more than those with only a high school diploma, while earning a bachelor’s degree nets a 71 percent premium.25
It is not enough to merely enroll in college—students need to complete a postsecondary credential to be most prepared for the job market. Students who enter a postsecondary institution unprepared for college-level work are placed into “developmental” or “remedial” education courses and are far less likely to complete a credential or degree.26
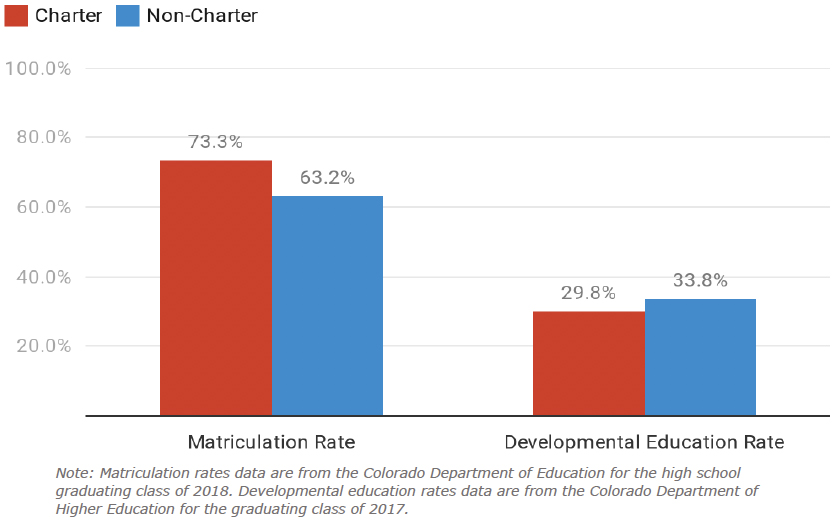
Figure 10 displays matriculation rates and developmental education rates for charter and non-charter school students. Students at brick and mortar charter schools attend a postsecondary institution, immediately following high school graduation, at higher rates than their peers at non-charter schools. These data capture students attending a postsecondary career and technical education (CTE) program or a two or four-year higher education institution. Seventy three percent of graduates from charter schools matriculate to a postsecondary institution compared to 63 percent of graduates from district-run high schools.27 Of the high school graduates who attend a postsecondary institution in Colorado, approximately 30 percent of charter school graduates need developmental education compared to 34 percent of non-charter school graduates.28
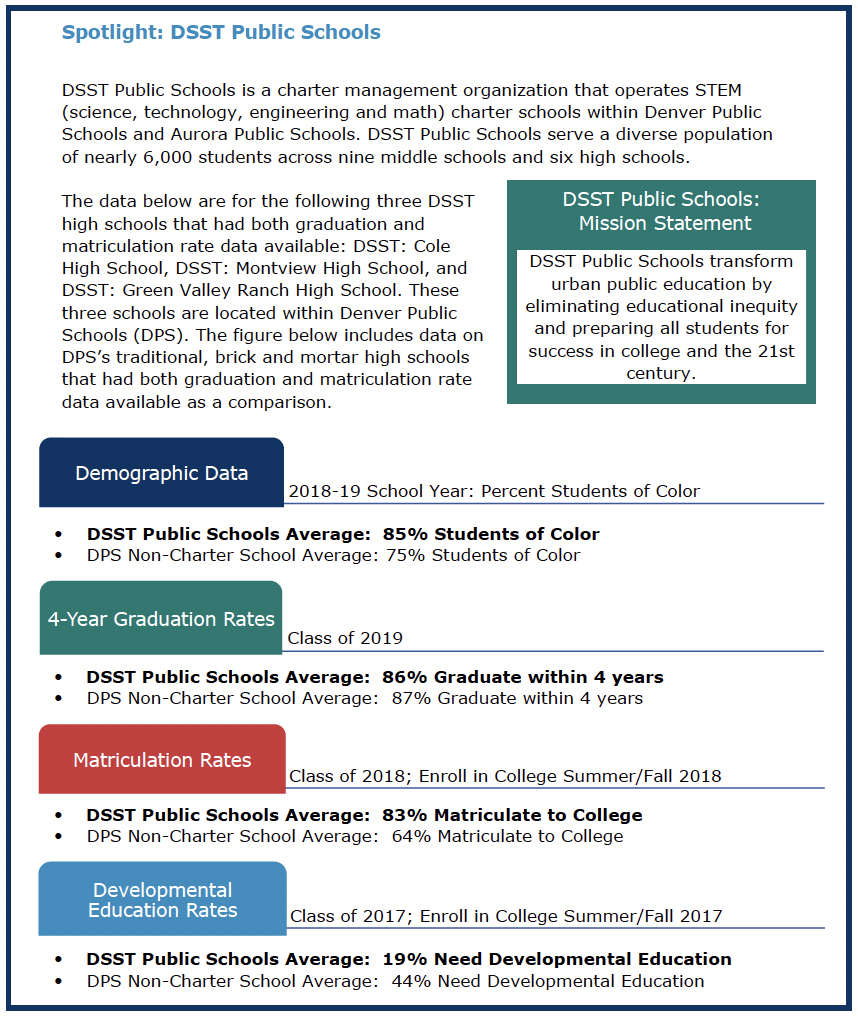
This study did not have access to disaggregated data at the school level for these data points, but statewide data shows that students of color are less likely to enroll in college, and if they do enroll, they are more likely to need developmental education. In 2018, 46 percent of Hispanic public high school graduates and 54 percent of Black or African American graduates enrolled in college compared to 78 percent of white graduates.29 In 2017, 53 percent of Hispanic students and 59 percent of Black or African American students needed developmental education compared to 26 percent of white students.30 These are statewide averages that do not reflect whether students attended a district-run school or a charter school. For a case study that considers charter and non-charter performance, see the Spotlight section on DSST Public Schools, which is a prominent charter network in Denver serving high proportions of Hispanic and Black students. While DSST graduation rates mirror those of traditional schools within Denver Public Schools, the matriculation and developmental education rates are significantly better.
Figure 10: Charter and Non-Charter School Postsecondary Matriculation and Readiness
Conclusion
Researchers across the country have found that charter schools can be particularly effective at raising student achievement for students of color. In some urban areas, including Boston and New York City, charter schools have closed the Black-white achievement gap. In Colorado, when looking at six-year graduation rates, charter schools have closed the gap between white students and Hispanic students. Additionally, Black students at charter schools have higher six-year graduation rates than white students at non-charter schools. It is clear from national research and from Colorado-specific data that charter schools are a valuable component of our education system.
This does not mean that charter schools are the silver bullet for our public education system’s woes. There are good and bad charter schools just as there are good and bad district-run schools. Charter schools, however, remain a critical part of Colorado’s educational ecosystem by providing families with options for learning environments that can better meet their children’s needs and by proving capable of improving outcomes for traditionally underserved students.
As our society faces insurmountable challenges in the COVID-19 era, now is the time for schools to share strategies and innovations rather than pitting one school type against another. Families, educators, policymakers and community members must work together to ensure that all students have access to a learning environment that is personalized, engaging, relevant and that prepares them to graduate high school ready for a fulfilling career and life.
Data Notes
The data used in this report are from the Colorado Department of Education, with the exception of the remedial education rates in Figure 10, which are from the Colorado Department of Higher Education. Since the bulk of the analysis focuses on the graduating class of 2019, the data used in this report include public high schools that have been open since at least 2015-16 and are currently in operation. All high schools in the analysis thus have had the opportunity to educate at least one cohort of students for four years. In this analysis, charter and non-charter schools refer to public high schools only; this dataset does not include private schools. This presentation of observational, descriptive data does not purport to make conclusions about causality.
References
Abdulkadiroğlu, A., Angrist, J. D., Dynarski, S. M., Kane, T. J., & Pathak, P. A. (2011). Accountability and flexibility in public schools: Evidence from Boston’s charters and pilots. The Quarterly Journal of Economics, 126(2), 699-748. www.nber.org/papers/w15549
Arsen, D. & Ni, Y. (2012). The effects of charter school competition on school district resource allocation. Educational Administration Quarterly. 48(1), 3-38. Published, 09/2012.
Bettinger, E. P. (2005). The effect of charter schools on charter students and public schools. Economics of Education Review, 24(2), 133-147.
Bifulco, R., & Ladd, H.F. (2006). The impacts of charter schools on student achievement: Evidence from North Carolina. Education Finance and Policy, 1(1), 50-89.
Booker, T. K., Gilpatric, S. M., Gronberg, T. J., & Jansen, D. W. (2008). “The effect of charter schools on traditional public school students in Texas: Are children who stay behind left behind?” Journal of Urban Economics, 64(1): 123-145.
Colorado Department of Education [CDE]. (2020). 2019 State of Charter Schools Triennial Report. Denver, CO. Retrieved from: cde.state.co.us/cdechart/2019charterschooltriennialreport
Colorado Department of Higher Education [CDHE]. (2019). 2019 Legislative Report: The Postsecondary Progress and Success of High School Graduates: Developmental Education Needs. Denver: CDHE. highered.colorado.gov/Publications/Reports/Remedial/FY2018/2018_Remedial_relJuly2019.pdf
Cordes, Sarah (2018). “In Pursuit of the Common Good: The Spillover Effects of Charter Schools on Public School Students in New York City, Education Finance and Policy 13(4): 484-512.
Center for Research on Education Outcomes [CREDO]. (2015). Urban Charter School Study. San Francisco: Stanford. urbancharters.stanford.edu/download/Urban%20Charter%20School%20Study%20Report%20on%2041%20Regions.pdf
CREDO. (2019) City Study 2019 – Denver. San Francisco: Stanford. cityschools.stanford.edu/cities/denver
Cremata, E.J., & Raymond, M.E. (2014). “The Competitive Effects of Charter Schools: Evidence from the District of Columbia” Association for Education Finance and Policy Conference Working Paper.
Curto, V.E., & Fryer, R.G. Jr. (2011). “Estimating the Returns to Urban Boarding Schools: Evidence from SEED.” National Bureau of Economic Research (NBER) Working Paper 16746.
Dennis Epple & Richard Romano & Ron Zimmer, 2015. “Charter Schools: A Survey of Research on Their Characteristics and Effectiveness,” NBER Working Papers 21256, National Bureau of Economic Research, Inc. Retrieved from: www.nber.org/papers/w21256.pdf
Dobbie, W., & Fryer, R. G., Jr. (2011). “Are High-Quality Schools Enough to Increase Achievement Among the Poor? Evidence from the Harlem Children’s Zone,” American Economic Journal: Applied Economics 3: 158–187 www.nber.org/papers/w15473
Epple, D.; Romano, R. & Zimmer, R. (2015). “Charter Schools: A Survey of Research on Their Characteristics and Effectiveness,” NBER Working Papers 21256, National Bureau of Economic Research, Inc. Retrieved from: https://www.nber.org/papers/w21256.pdf
Hoxby, C. (2003), School choice and school productivity (or, could school choice be a tide that lifts all boats?), in C. Hoxby (ed.), The Economics of School Choice, University of Chicago Press, Chicago.
Gill, B. P. (2016). “The Effect of Charter Schools on Students in Traditional Public Schools: A Review of the Evidence.” EducationNext. www.educationnext.org/the-effect-of-charter-schools-on-students-in-traditional-public-schools-a-review-of-the-evidence/
Griffith, D. (2019). Rising Tide: Charter School Market Share and Student Achievement. Washington, DC: Thomas B. Fordham Institute (September 26, 2019). https://fordhaminstitute.org/national/research/rising-tide-charter-market-share.
Hulse, C. & Ragland, L. (2018). Open Doors, Open Districts: School Choice in Colorado’s Traditional Public Schools. Denver: ReadyColorado.
Hoxby, C., Kang, J., & Murarka, S. (2009). “How New York City’s Charter Schools Affect Achievement, August 2009 Report.” Second report in series. Cambridge, MA: New York City Charter Schools Evaluation Project. www.achievehartford.org/wp-content/uploads/2016/09/NYC-Charter-Schools-Project-How-NYCs-Charter-Schools-Affect-Achievement-2009.pdf
Imberman, Scott A. 2011. “The Effect of Charter Schools on Achievement and Behavior of Public School Students.” Journal of Public Economics 95: 850-863.
Jinnai, Yusuke. 2013. “The Impact of Charter Schools’ Entry on Traditional Public Schools: New Evidence from North Carolina.” Rochester, NY: University of Rochester.
Nisar, H. (2012). “Heterogeneous Competitive Effects of Charter Schools in Milwaukee,” NCSPE working paper.
Sass, T. R. (2006). Charter schools and student achievement in Florida. Education Finance and Policy, 1(1), 91–122.
Torpey, E. & Watson, A. (2014), “Education level and jobs: Opportunities by state,” Career Outlook, U.S. Bureau of Labor Statistics. www.bls.gov/careeroutlook/2014/article/education-level-and-jobs.htm?
Tuttle, C. C., Gill, B., Gleason, P., Knechtel, V., Nichols-Barrer, I., & Resch, A. (2013). KIPP middle schools: Impacts on achievement and other outcomes. Washington, DC: Mathematica Policy Research. www.mathematica.org/our-publications-and-findings/publications/kipp-middle-schools-impacts-on-achievement-and-other-outcomes-full-report
Winters, J. (2020). What You Make Depends on Where You Live: College Earnings across States and Metropolitan Areas. Washington, DC: Thomas B. Fordham Institute. https://fordhaminstitute.org/national/research/what-you-make-depends-on-where-you-live
Winters, M.A. (2012). Measuring the effect of charter schools on public school student achievement in an urban environment: Evidence from New York City. Economics of Education Review, 31(2): 293-301
Zimmer, R. & Buddin, R. (2009). “Is Charter School Competition in California Improving the Performance of Traditional Public Schools?” Public Administration Review 69(5): pp. 831-845.
Zimmer, R., Buddin, R., Chau, D., Gill, B., Guarino, C., Hamilton, L.,…Brewer, D. (2003). Charter school operation and performance: Evidence from California. MR-1700. Santa Monica, CA: RAND.
Zimmer, R.; Buddin, R. Smith, S. A.; & Duffy, D. (2019). Nearly three decades into the charter school movement, what has research told us about charter schools?. (EdWorkingPaper: 19-156). Retrieved from Annenberg Institute at Brown University: www.edworkingpapers.com/ai19-156.
Zimmer, R., & Engberg, J. (2016). Can broad inferences be drawn from lottery analyses of school choice programs? An exploration of appropriate sensitivity analyses. Journal of School Choice, 10:1, 48-72.
Zimmer, R., Gill, B., Booker, K., Lavertu, S., Sass, T., & Witte, J. (2009). Charter Schools in Eight States: Effects on achievement, attainment, integration, and competition. MG-869. Pittsburgh: RAND.
1 Definition from the Colorado League of Charter Schools: coloradoleague.org/page/charterschoolfacts
2 Epple, Romano & Zimmer, 2015.
3 For more detail on enrollment statistics for CSI and for school districts that authorized more than three charter schools in 2018-19, see Tables 2 and 3 (pp. 9-10) in CDE’s “2019 State of Charter Schools Triennial Report”, accessible at: http://cde.state.co.us/cdechart/2019charterschooltriennialreport
4 CDE, 2020.
5 CDE, 2020, 21.
6 Hoxby, Kang, & Murarka, 2009; Abdulkadiroglu, et al., 2011; Curto and Fryer, 2011; Dobbie and Fryer, 2011; Tuttle, et al., 2013.
7 Zimmer & Engberg, 2016.
8 Zimmerman, Buddin, Smith & Duffy, 2019.
9 CREDO, 2015.
10 CREDO, 2015.
11 Abdulkadiroglu, et al., 2011.
12 Dobbie and Fryer, 2011.
13 CREDO, 2019.
14 CDE, 2020.
15 Zimmerman, Buddin, Smith & Duffy, 2019.
16 Hulse & Ragland, 2018.
17 Bettinger, 2005; Bifulco & Ladd, 2006; Booker et al., 2006; Cremata & Raymond, 2014; Cordes, 2018; Hoxby, 2003; Jinnai, 2003; Nisar, 2012; Sass, 2006; Winters, 2012; Zimmer & Buddin 2009; Zimmer et al., 2009.
18 Imberman, 2011.
19 Griffith, 2019.
20 Ibid.
21 Zimmerman, Buddin, Smith & Duffy, 2019.
22 Zimmer et al., 2003; Zimmer and Buddin, 2009; Arsen and Ni, 2012.
23 The report can be accessed at: cde.state.co.us/cdechart/2019charterschooltriennialreport
24 CDHE, 2019.
25 Winters, 2020.
26 CDHE, 2019.
27 CDE, 2020.
28 Analysis of data procured from the Colorado Department of Higher Education. highered.colorado.gov
29 CDHE, 2019, 4.
30 CDHE, 2019, 11. Data is for the 2017 high school graduating class.