

The recent changes in state government employment vary greatly across each department. Though the Governor’s FY23 budget request proposes a 0.85% increase in the overall level of the state government’s workforce, five agencies are proposed to grow above 6%.
The significant growth in full time equivalent employment (FTE) for some agencies follows a clear historic trend. Over the last 10 state budgets, including the Governor’s FY23 proposal, the cumulative growth rate of state government employment (20.3%[i]) is projected to be lower than private-sector employment growth (23.3%[ii]). However, over that same period several state departments have grown significantly faster or slower.
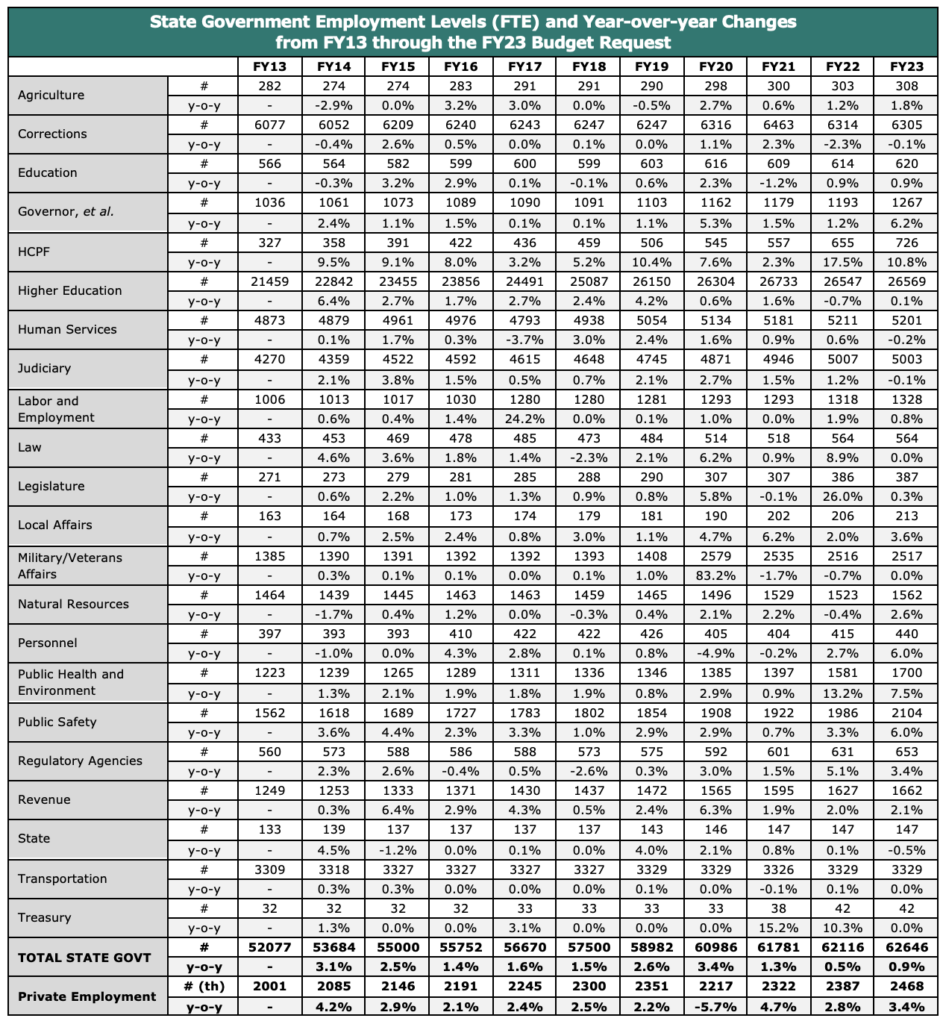
The following charts and key findings track the changes in state government FTE employment levels across departments. FTE employment excludes seasonal and contract workers,[iii] and therefore, tends to be less volatile than appropriations and can help understand long-term budgetary commitments.
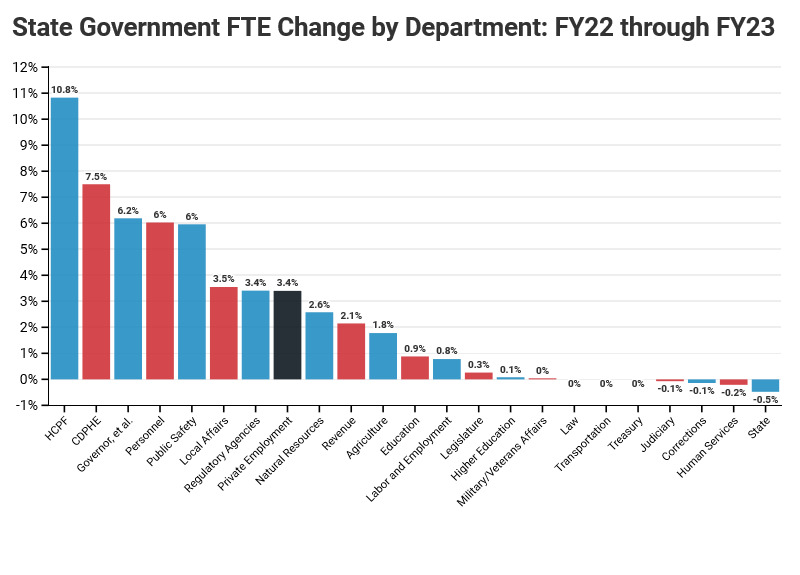
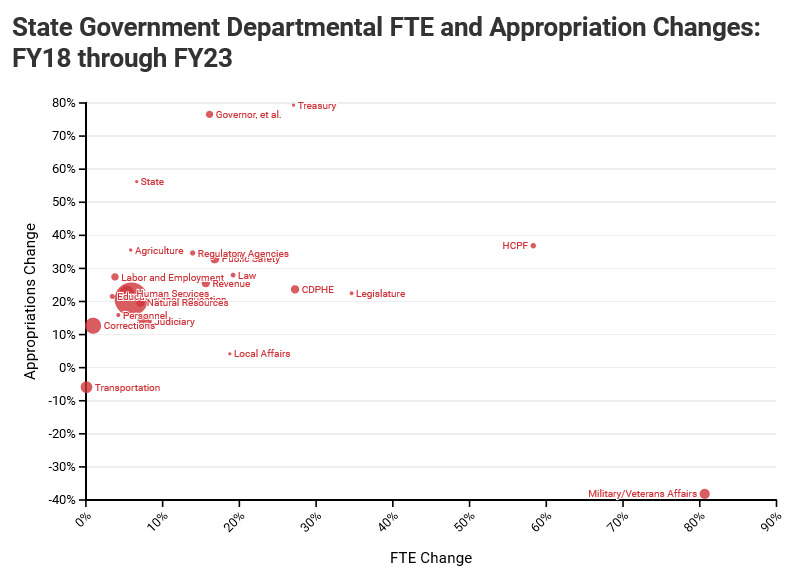
FTE Changes in the Governor’s FY23 Budget Request
- Although private sector employment is projected to grow by 3.4%, government FTE would increase by 0.85% in FY23 under the Governor’s Budget request.
- The Departments of Health Care Policy and Financing and Public Health and Environment would receive the largest proportional FTE growth in FY23. They would grow by over 10% and over 7%, respectively.
- Seven of the 22 state-government departments would receive either no FTE growth or negative FTE growth in FY23. Among these are the state’s 2nd- through 5th-largest departments.
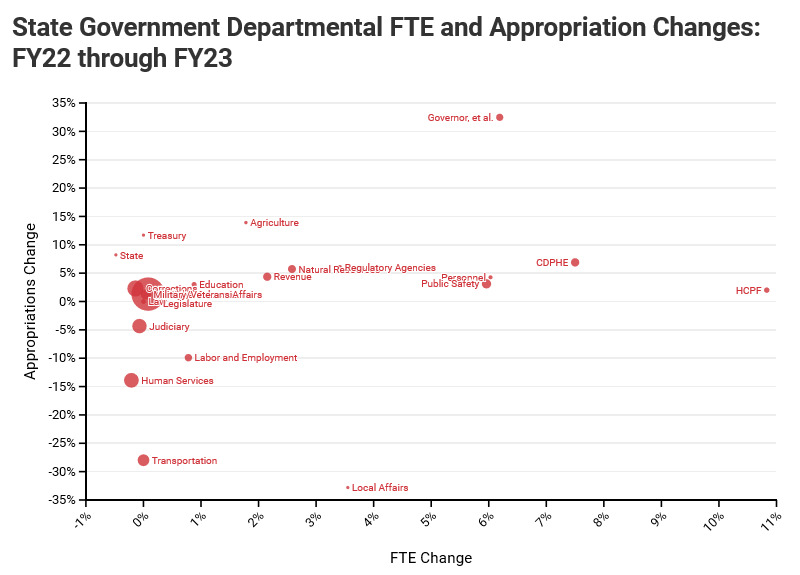
- Only the Departments of Local Affairs and Labor and Employment would receive any FTE growth out of the six state government departments appropriated less money in FY23 than in FY22.
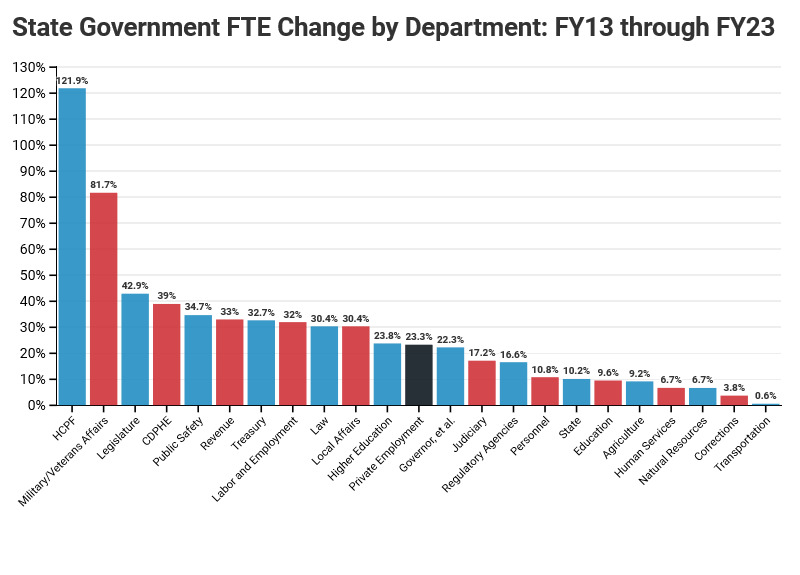
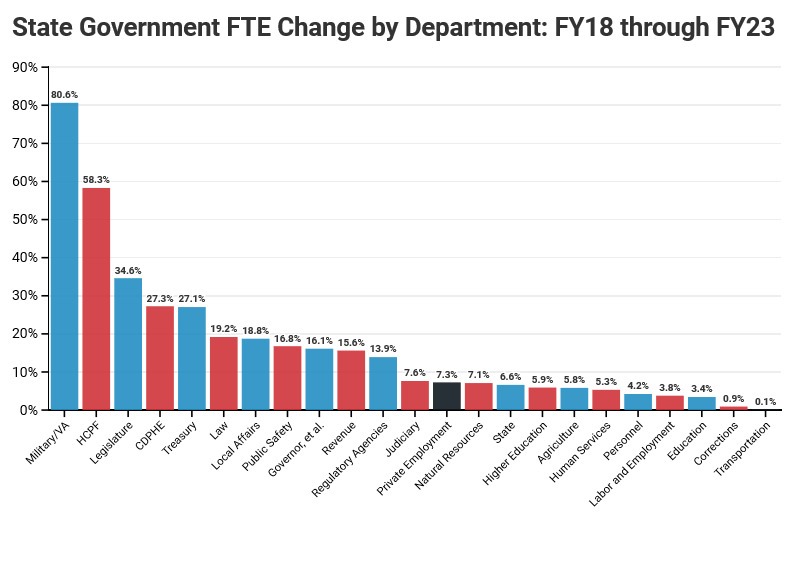
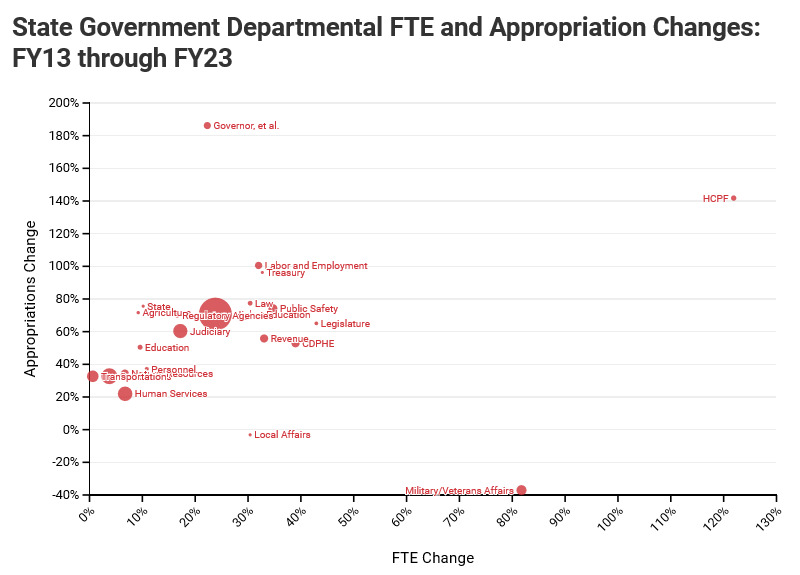
The Change in State Government FTE Over Last 5 and 10 Years
- Between FY13 and FY23, total state government FTE will have grown by 20.3% under the Governor’s latest proposal and private-sector employment is projected to have grown by 23.3%. Before 2020, private employment grew by an annual average of 2.7% and total government FTE grew by an annual average of 2.1%.
- In 2020, private sector employment dropped by 5.7% while state government FTE increased by 3.4%.
- The Department of Health Care Policy and Financing’s workforce increased by 122% since FY13 and its total appropriation has increased by 142%.
- Although the Department of Military and Veteran Affairs’ employment growth rate has been the second highest since FY13, its FY23 appropriation is almost 40% lower than its FY13 appropriation.
- The Department of Transportation’s FY23 appropriation is 33% higher than its FY13 appropriation (4th lowest among all departments) and its employment growth over that time has been almost zero.
[i] Derived from annual Joint Budget Committee Appropriations Reports (https://leg.colorado.gov/appropriations-reports)
[ii] Private employment from BLS (2013 through 2021) and projections from the December 2021 Economic Forecast produced by CO Legislative Council Staff (https://leg.colorado.gov/publications/forecast-december-2021)
[iii] CRS § 24-75-112 (1)(d)(II)
© 2022 Common Sense Institute