

Author: Steven L. Byers, Peter LiFari
Colorado Springs Housing Affordability Study: April 2024
Since 2005, an estimated 117,000 new residents have come to the city of Colorado Springs.[i] Over the same period, the average priced home rose 119% from $218,707 to $449,123, as of February 2024. Increased demand and lagging development have created a shortage of housing and a tight housing market. Recent increases in mortgage rates have reduced affordability for those looking to purchase a home. Although higher mortgage rates tend to reduce demand for homes and provide some relief in terms of availability, permitting for new housing units is tapering off and actual home completions are likely to decline as builders respond to a slowing economy. Without an increase in the construction of new housing at all price levels, Colorado Springs will continue to have a housing supply shortage.
This report analyzes housing affordability trends and estimates whether there is a deficit or surplus of housing units in Colorado Springs. The study encompasses the period from 2000 through 2022. Data sources used and most recent availability include the American Community Survey (2022), the National Association of Homebuilders (2020), U.S. Department of Housing and Urban Development (March 2024), Zillow (February 2024), and the Colorado State Demography Office (2023). The housing deficit/surplus in 2023 is estimated using forecasts of population and average household sizes. It is important to note that the housing deficit/surplus estimates may change with each new U.S. Census data release.
KEY FINDINGS
- The housing deficit in 2023 is in the range of 16,554 to 27,360 units. To meet population growth by 2028 and close the housing deficit, between 32,000 and 43,000 housing units will need to be built.
- Due to elevated housing prices and rising interest rates, the affordability of purchasing a home in Colorado Springs is at an all-time low. In just the past ten years, the cost (purchase price plus mortgage cost) of purchasing a home has increased by 82.6%. A large part of that increase has occurred over the last three years.
- Household incomes have not kept pace with rising housing costs. Between February 2015 and February 2024, the average hourly wage increased by 38% from $24.84 to $29. However, due to the rapidly increasing cost of housing, the number of hours of work required to cover the median monthly mortgage payment increased from 43 hours to 86 hours, a 100% increase, as seen in Figure 2.
- Between 6,403 and 8,564 permits are needed annually through 2028 to close the current housing supply deficit in Colorado Springs and meet the demands of future population growth. Projected permitting for new housing in 2023 was strong in the summer months but tapered off as home builders continue to assess the demand for housing in a higher interest rate environment. Over the period from 2020 through 2023, the average annual number of permitted units issued was 4,879. This historical average is 76% to 57% of the number of permits necessary to close the deficit and meet new housing demand by 2028.
- The current level of permitting for new housing is not enough. Based on permit data through January 2024, Colorado Springs is projected to issue 3,432 permits in 2024, which, if its pace is sustained, is not enough to close the deficit plus new housing demand by 2028
- Based on current mortgage rates there is a mismatch between household mortgage capacity and the value of housing. There is a shortage of housing valued below $300,000 and an excess supply of homes valued between $300,000 and $1,000,000.
AFFORDABILITY AS MEASURED BY THE HOMEBUYER MISERY INDEX
The “Colorado Springs Homebuyer Misery Index,” developed by Common Sense Institute,[ii] captures the impact of housing prices and mortgage rates on the affordability of purchasing a new home. The Colorado Springs, Colorado, and U.S. Homebuyer Misery Indices are based on 30-year mortgage rates and Zillow home prices. This does not include taxes, insurance, utilities, association, and lot fees, which have no available state- or county-level averages.
The Homebuyer Misery Index converts mortgage rates into an indexed value with 2000 as its base year. The mortgage rate index is then added to the Zillow price index and normalized. Figure 1 shows the Colorado Springs Homebuyer Misery Index, the Colorado Homebuyer Misery Index, and the U.S. Homebuyer Misery Index. The Colorado Springs Index is below the Colorado Index after 2013 and above the U.S. Index after 2019. The substantial increase from 2012 to the end of 2020 was primarily a function of home prices increasing. Beginning in 2021, home prices in Colorado Springs rose dramatically, and mortgage rates more than doubled by November 2022; consequently, the cost to purchase an average-priced home in Colorado Springs went up by 121% from 2012 to 2022. In the last two months of 2022, the misery index declined as home prices and mortgage rates fell. The graph of the Homeowner Misery Index is useful for evaluating and comparing trends to the Colorado and U.S. Homebuyer Index, but to determine the degree to which a region became more or less affordable relative to others the change in the indices must be calculated between two points in time as is shown in Figure 3.
Figure 1- Colorado Springs, CO Homebuyer Misery Index
The change in home affordability, based on the Homebuyer Misery Index, has declined in Colorado Springs by 101% since January 2014, about the same as Colorado overall but below the change for the U.S. Since May of this year, home prices have leveled off or decreased slightly, but affordability has continued to worsen as mortgage rates have increased. Figure 2 shows falling affordability in Colorado Springs, Colorado, and the U.S.
Figure 2 – Percent Change in Housing Affordability for Colorado Springs, Colorado, and the U.S.
| Percent Change in Housing Affordability Based on the Homebuyer Misery Index for Colorado Springs, Colorado, and the U.S. | |||
| % Change as of
Dec. 2022 Since: |
Colorado Springs | Colorado | United States |
| Jan 2014 | -93% | -100% | -85% |
| Jan 2015 | -97% | -97% | -87% |
| Jan 2016 | -85% | -77% | -76% |
| Jan 2017 | -70% | -62% | -66% |
| Jan 2018 | -60% | -53% | -60% |
| Jan 2019 | -46% | -43% | -49% |
| Jan 2020 | -44% | -43% | -50% |
| Jan 2021 | -38% | -38% | -44% |
| Jan 2022 | -14% | -16% | -23% |
| Jan 2023 | -1% | -1% | -4% |
| Jan 2024 | 0% | 0% | 0% |
The following graph shows changes in affordability, based on the Homebuyer Misery Index, for the average home in Colorado Springs over time. Half of the total change has occurred since January 2020, and 45% has occurred since the beginning of 2021.
Figure 3 – Changes in Housing Affordability
The Wall Street Journal and Realtors.com began producing their Emerging Housing Markets Index in spring 2021 and have now published six quarterly estimates. The index identifies the top metro areas for home buyers seeking an appreciating housing market, strong local economies, and appealing lifestyle amenities. Three hundred of the most populous core-based statistical areas as measured by the U.S. Census Bureau are evaluated on two criteria: real-estate markets (50%), and economic health (50%). It utilizes 11 key indicators that are weighted and summed to create a single measure: real-estate supply (16.6%), real-estate demand (16.6%), medium home listing price trend (16.6%), unemployment (6.25%), wages (6.25%), regional price parities (6.25%), amenities (6.25%), small businesses (6.25%), and property taxes (6.25%).[iii]
Figure 4 shows the rankings of the major MSAs in Colorado relative to all three hundred most populous areas included in the index. The Colorado Springs MSA is in the top 25% (ranked 75 or higher) of all metro areas in terms of future home price appreciation. This index provides the perspective that, though housing affordability in the city is near record lows according to latest data, Colorado Springs is generally ranked in the top 25% of MSAs in the Emerging Housing Market Index and is viewed as relatively attractive given the potential for prices to continue to rise, in addition to other quality of life and economic factors. Nevertheless, expectations for future home price appreciation have decreased significantly from 2022, reflecting the large increases in home prices over the last few years.
Figure 4 – WSJ/Realtor.com Emerging Housing Markets Index
| Wall Street Journal/Realtor.com Emerging Housing Markets Index, Ranked Relative to 300 Metropolitan Statistical Areas | ||||||||||
| Spring 2021 | Summer 2021 | Fall 2021 | Spring 2022 | Summer 2022 | Fall 2022 | Spring 2023 | Summer 2023 | Fall 2023 | Winter 2023 | |
| Colorado Springs | 32 | 14 | 11 | 25 | 20 | 14 | 66 | 50 | 84 | 76 |
| Boulder | 31 | 46 | 20 | 6 | 14 | 33 | 46 | 26 | 72 | 83 |
| Denver-Aurora-Lakewood | 115 | 88 | 59 | 52 | 66 | 38 | 114 | 63 | 134 | 129 |
| Grand Junction | 60 | 39 | 90 | 126 | 50 | 43 | 118 | 125 | 146 | 118 |
| Fort Collins | 96 | 68 | 24 | 8 | 11 | 47 | 64 | 57 | 106 | 128 |
| Pueblo | 86 | 55 | 83 | 102 | 78 | 98 | 160 | 198 | 200 | 235 |
| Greeley | 153 | 140 | 93 | 108 | 113 | 168 | 147 | 144 | 192 | 196 |
| In this table, Colorado cities are ranked among the three hundred most populous metro areas in the U.S. The index identifies the top metro areas for home buyers seeking an appreciating housing market, a strong local economy, and appealing lifestyle amenities. | ||||||||||
Figure 5 shows the relative rank of major MSAs in Colorado. Though prices in Colorado Springs are historically high, among the other MSAs in Colorado, the city is considered one of Colorado’s highest-ranking in terms of future home appreciation.
Figure 5 – WSJ/Realtor.com Emerging Housing Markets Index, Ranked for Colorado MSAs
| Wall Street Journal/Realtor.com Emerging Housing Markets Index, Ranked Relative to 300 Metropolitan Statistical Areas – Future Home Appreciation | ||||||||||
| Spring 2021 | Summer 2021 | Fall 2021 | Spring 2022 | Summer 2022 | Fall 2022 | Spring 2023 | Summer 2023 | Fall 2023 | Winter 2023 | |
| Colorado Springs | 2 | 1 | 1 | 3 | 3 | 1 | 3 | 2 | 2 | 1 |
| Boulder | 1 | 3 | 2 | 1 | 2 | 2 | 1 | 1 | 1 | 2 |
| Grand Junction | 3 | 2 | 6 | 7 | 4 | 4 | 5 | 5 | 5 | 3 |
| Fort Collins | 5 | 5 | 3 | 2 | 1 | 5 | 2 | 3 | 3 | 4 |
| Denver-Aurora-Lakewood | 6 | 6 | 4 | 4 | 5 | 3 | 4 | 4 | 4 | 5 |
| Greeley | 7 | 7 | 7 | 6 | 7 | 7 | 6 | 6 | 6 | 6 |
| Pueblo | 4 | 4 | 5 | 5 | 6 | 6 | 7 | 7 | 7 | 7 |
| In this table, Colorado cities are ranked among the three hundred most populous metro areas in the U.S. The index identifies the top metro areas for home buyers seeking an appreciating housing market, a strong local economy, and appealing lifestyle amenities. | ||||||||||
HOME PRICES
Figure 6 shows home price indices for Colorado Springs, Colorado, and the United States. Home prices in Colorado Springs have increased by 130% since 2012 through February 2024. Home prices peaked in Colorado Springs in July 2022 but have since tapered off 5.1%.
Figure 6 – Colorado Springs Home Price Index
HOURS OF WORK NEEDED TO AFFORD A HOME MORTGAGE
To measure the impact on the average homeowner in Colorado Springs, the Common Sense Institute calculated the number of hours that one would have to work while earning the average hourly wage in Colorado Springs in November of each year from 2013 to 2022 to cover the monthly mortgage payments shown in Figure 7. Over just the last 12 months, driven primarily by the increase in mortgage rates, an additional 37 hours of work has become necessary to cover the monthly mortgage payment on a newly purchased average-price home. Note that the monthly mortgage payment only includes principal and interest and not taxes and insurance. The inclusion of taxes and insurance would increase the number of hours required.
Figure 7 – Hours of Work Required to Afford a Home Mortgage
|
Colorado Springs Home Prices, Mortgage Raes, Monthly Payment, Wage Rates, and Hours Required to Cover Monthly Mortgage Payment |
||||||
| Date | Average Home Price | 30-year Mortgage Rate | Mortgage Payment | Average Wage Rate | Hours of Work at the Average Wage Rate Required to Cover Mortgage Payment | % Annual Change in Hours of Work Required |
| 2/2013 | $195,753 | 3.89% | $922 | $23.11 | 40 | |
| 2/2014 | $213,046 | 4.30% | $1,055 | $22.19 | 48 | 19.1% |
| 2/2015 | $223,007 | 3.71% | $1,028 | $23.84 | 43 | -9.3% |
| 2/2016 | $239,691 | 3.66% | $1,098 | $24.38 | 45 | 4.5% |
| 2/2017 | $261,509 | 4.17% | $1,274 | $25.00 | 51 | 13.2% |
| 2/2018 | $286,802 | 4.33% | $1,424 | $25.99 | 55 | 7.6% |
| 2/2019 | $310,931 | 4.37% | $1,552 | $29.22 | 53 | -3.1% |
| 2/2020 | $333,912 | 3.47% | $1,493 | $28.66 | 52 | -1.9% |
| 2/2021 | $373,365 | 2.81% | $1,536 | $28.49 | 54 | 3.5% |
| 2/2022 | $446,400 | 3.76% | $2,071 | $30.38 | 68 | 26.4% |
| 2/2023 | $447,529 | 6.26% | $2,758 | $32.64 | 84 | 24.0% |
| 2/2024 | $449,123 | 6.78% | $2,921 | $33.93 | 86 | 1.9% |
Freddie Mac, 30-Year Fixed Rate Mortgage Average in the United States [MORTGAGE30US], retrieved from FRED, Federal Reserve Bank of St. Louis; https://fred.stlouisfed.org/series/MORTGAGE30US,
Colorado – May 2023 OEWS State Occupational Employment and Wage Estimates (bls.gov).
Figure 8 below shows the evolution of monthly mortgage payments on an average-price home in Colorado Springs and the required hours of work necessary to cover each payment. Required hours fluctuated around 40 from January 2007 until the summer of 2020, after which they increased dramatically as home prices rose. Beginning in the spring of 2022, mortgage rates increased as the Federal Reserve began raising interest rates to address inflation.
As of February 2024, 86 hours of work are required to pay the average monthly mortgage payment. This is up from 39 hours in July 2022, a 121% increase. At the peak in October 2022, 98 hours were required.
Figure 8 – Colorado Springs Mortgage Affordability Index
COLORADO SPRINGS HOUSING SUPPLY SHORTAGE
Colorado Springs has failed to build enough housing to keep pace with demand. Standard housing market reports like those developed by the National Association of REALTORS® track inventory based on homes listed for sale. What those reports do not capture is the total stock of homes needed to maintain a healthy housing market.
CSI estimated the number of homes needed in Colorado Springs to achieve a healthy housing market under two scenarios. Each scenario is intended to measure the difference between the actual number of homes in the city relative to the number of homes needed to maintain a stable market for the local population. The first scenario averages the values of a housing deficit or surplus based on a low estimate of homes held off the market for purchase by the local population. The second scenario averages the values of a housing deficit or surplus based on a high estimate of homes held off the market for purchase by the local population.
Housing units and households – Each scenario uses estimations of housing units and households from the U.S. Census Bureau’s American Community Survey (ACS) and the Colorado State Demography Office. The number of housing units is adjusted by removing those that are considered uninhabitable by virtue of having no kitchen or no plumbing. The U.S. Census defines a housing unit as “a housing unit is a house, an apartment, a mobile home, a group of rooms, or a single room that is occupied (or if vacant, is intended for occupancy) as separate living quarters.”[iv]
Homes held off the market – Homes held off the market are existing housing units not available for purchase or long-term leasing. The estimate of the total number of such homes includes a range of second homes at the county level released by the National Association of Homebuilders[v] along with an estimate of uninhabitable homes from ACS. Colorado Springs has between 0% and 4.99% of the housing stock allocated to second homes.
Desired ratio of total units to local population – To estimate the target number of housing units, the value of 1.1 housing units per household was used to represent a healthy market. This value is derived from the historic average vacancy rates in the U.S.[vi] Figure 9 shows the forecasted change in population and the projected numbers of households in 2028 and 2033.
Figure 9 – Change in Population and Households in Colorado Springs
| Change in Population and Households in Colorado Springs, in 2028 and 2033 | ||||
| Region | Population | Households | ||
| 2028 | 2033 | 2028 | 2033 | |
| Colorado Springs | 43,331 | 80,275 | 18,416 | 34,117 |
Using the scenarios discussed above, the housing unit deficit in 2023 is estimated to have been between 16,554 and 27,360 units (average deficit equals 21,957). Figure 10 presents summary results for the Colorado Springs housing supply deficit. CSI will continue to monitor new data as it becomes available and will amend the estimates and methodology as required.
Figure 10 -Housing Deficit/Surplus in Colorado Springs in 2023
| Housing Deficit/Surplus in 2023 | |||||
| Region | Housing Stock 2023 | Housing Deficit/Surplus in 2023 | Deficit/Surplus as a Percent of 2023 Existing Stock of Housing Units | ||
| Scenario One | Scenario Two | Scenario One | Scenario Two | ||
| Colorado Springs | 216,561 | -16,554 | -27,360 | 7.64% | 12.63% |
| Scenario One uses the NAHB low estimate of the share of homes held off the market.
Scenario Two uses the NAHB high estimate of the share of homes held off the market. |
|||||
BUILDING PERMITS AND THE HOUSING SUPPLY DEFICIT
As shown in Figure 11, new residents continued to arrive in Colorado Springs and the housing supply deficit, based on scenarios 1 and 2, grew from 2006 through 2021, before falling slightly in 2022. Annual permitting steadily rose after 2009, but not enough to reduce the supply deficit. Despite the shortage of housing, people still live in Colorado Springs and as such the vacancy rate is very low, which creates the market pressure that causes home prices to increase more rapidly. Without the necessary supply, residents may need to live in denser arrangements with additional roommates, live with relatives, or commute from greater distances.
Figure 11 – Colorado Springs Population Growth, New Permits, and Housing Supply Deficit/Surplus
To erase the estimated deficit in Colorado Springs and meet new population-driven demand for housing by 2028, an additional 32,014 to 42,281 permitted units are required in total, equating to 6,403 to 8,564 per year (see Figure 12). CSI tracks building unit permits by county on a monthly basis to evaluate whether the level of issuance is sufficient to close the existing housing deficit and meet new demand for housing. Housing permit data is based on the U.S. Department of Housing and Urban Development (H.U.D) COCDS Building Permit Database for states and county CBSAs. This database only has data disaggregated down to the county level. Therefore, to get an estimate of permitting in the City of Colorado Springs, we scaled permits by the relative share of population in the City of Colorado Springs to the County of El Paso.[vii]
Figure 12 – Permits Required to Close the 2023 Deficit and Meet New Housing Demand in Colorado Springs in 2028
| Permits Required to Close the 2023
Deficit and Meet New Housing Demand in Colorado Springs in 2028 |
|||||
| Region | Number of Permits Required to Close the Deficit Plus New Demand for Housing in Colorado Springs by 2028 | Estimated Permits Issued per Year in Colorado Springs in 2023 | Deficit/Surplus in Permitted Units Issued in Colorado Springs in 2023 | ||
| Scenario One | Scenario Two | Scenario One | Scenario Two | ||
| Colorado Springs, CO | 32,014 | 42,821 | 3,321 | (3,082) | (5,244) |
| Scenario One uses the NAHB low estimate of the share of homes held off the market.
Scenario Two uses the NAHB high estimate of the share of homes held off the market. |
|||||
To erase the estimated deficit in Colorado Springs and meet new demand for housing by 2033, an additional 47,716 to 58,522 permitted units are required in total, equating to 4,772 to 5,852 per year (see Figure 13). Closing the deficit and meeting new housing demand by 2033 requires fewer permits per year than does closing the deficit by 2028, because filling the 2022 housing deficit is spread out over an additional five years.
Figure 13 – Permits Required to Close the 2023 Housing Deficit and New Housing Demand in Colorado Springs in 2033
| Permits Required to Close the 2023 Deficit and New Housing Demand in Colorado Springs in 2033 | |||||
| Region | Number of Permits Required to Close the Deficit Plus New Demand for Housing in Colorado Springs by 2033 | Permits Issued per Year in Colorado Springs in 2023 | Deficit/Surplus in Permitted Units Issued in Colorado Springs in 2022 | ||
| Scenario One | Scenario Two | Through November | Scenario One | Scenario Two | |
| Colorado Springs | 47,716 | 58,522 | 3,321 | 1,451 | 2,532 |
| Scenario One uses the NAHB low estimate of the share of homes held off the market.
Scenario Two uses the NAHB high estimate of the share of homes held off the market. |
|||||
Figure 14 shows the number of monthly housing unit permits needed to close the deficit by 2028 for two scenarios and the number of permits issued monthly in 2023. The red line shows the average monthly required permits to close the 2023 deficit and meet new housing demand by 2028 under scenario one. The blue line is for scenario two. Under scenario one, enough permits have been issued in one month in 2023 to cover the housing deficit and meet new demand for housing by 2028. Under scenario two, not enough permits have been issued in 2023 to cover the housing deficit and new housing demand by 2028. Recently, permitting is trending up but high interest rates are reducing affordability and builders are responding by applying for fewer permits than needed to erase the deficit plus new housing demand by 2028.
Figure 14- Monthly Housing Permits Analysis
TYPES OF PERMITS ISSUED
Figure 15 shows the number of housing unit permits issued in total and the percentage of each type issued from 2012 through November 2022. Annual permitted units issued have increased 67% from 1,991 in 2012 to 3,321 in 2023. The share of permitted units issued has gone from 80% single-family in 2012 to 50.5% in 2023. The share of permits for multi-family structures has increased from 20% in 2012 to 49.5% in 2023. The majority, 92%, of permits for multi-family structures contain five or more units.
Figure 15 – Types of Permits Issued in Colorado Springs
| Colorado Springs Permits by Percentage of Type Issued | ||||||
| Year | Total Units | Units in Single-Family Structures | Units in All Multi-Family Structures | Units in 2-unit Multi-Family Structures | Units in 3- and 4-unit Multi-Family Structures | Units in 5+ Unit Multi-Family Structures |
| 2012 | 1,991 | 80% | 20% | 0% | 0% | 20% |
| 2013 | 2,345 | 81% | 19% | 1% | 0% | 18% |
| 2014 | 2,374 | 73% | 27% | 1% | 0% | 26% |
| 2015 | 2,423 | 82% | 18% | 0% | 0% | 18% |
| 2016 | 3,402 | 70% | 30% | 0% | 0% | 30% |
| 2017 | 3,256 | 77% | 23% | 0% | 0% | 23% |
| 2018 | 3,698 | 73% | 27% | 0% | 0% | 26% |
| 2019 | 3,577 | 73% | 27% | 2% | 1% | 24% |
| 2020 | 4,499 | 72% | 28% | 4% | 0% | 23% |
| 2021 | 6,025 | 54% | 46% | 3% | 0% | 43% |
| 2022 | 5,672 | 40% | 60% | 3% | 0% | 57% |
| 2023 | 3,321 | 50% | 50% | 5% | 0% | 45% |
HIGHER MORTGAGE RATES AND HOMEBUILDER CONFIDENCE
As shown in Figure 16, as mortgage rates (red line) have increased since March 2022, demand for housing has begun to taper off and, in response, many home builders are re-evaluating their plans for new housing. The March 2024 Housing Market Index (HMI) (blue line) released by the National Association of Homebuilders, which reflects builder confidence in the market for newly-built single-family homes, has risen from a low of 25 in December 2022 to 45 in March 2024.[viii]
If builders in Colorado Springs do not increase new construction, which looks uncertain based on the HMI, the housing unit deficit will increase. If population growth continues as forecasted, absent sufficient new housing units, the deficit in Colorado Springs will grow. Developers might consider changes to the mixture of housing they build such as a transition to building higher-density and less-expensive housing so that the deficit can be reduced even in a high–interest rate environment.
Figure 16 – NAHB/Wells Fargo Housing Market Index and Mortgage Rates
VALUE OF AVAILABLE HOUSING VERSUS MORTGAGE CAPACITY
There is a mismatch in the value of owner-occupied housing and households mortgage capacity in Colorado Springs. Figure 17 shows that based on current mortgage rates there is a shortage of housing valued below $300,000 and an excess supply of home valued between $300,000 and $1,000,000.
Figure 17 – Colorado Springs – Value of Housing Stock vs. Household Mortgage Capacity
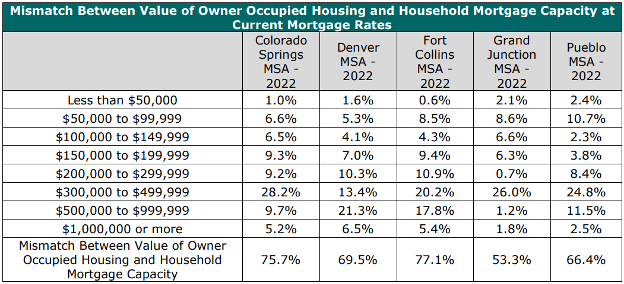
Figure 18 shows estimates of the mismatch in the value of owner occupied housing and household mortgage capacity at current interest rates for five of the largest MSA’s in Colorado. The total mismatch in the Colorado Springs MSA is 75.7%, second only to the Fort Collins MSA at 77.1%. The largest mismatch in the Colorado Springs MSA is in the $300,000 to $499,999 range and the smallest is in the less than $50,000 range.
Figure 18 – Mismatch Between Value of Owner-Occupied Housing and Household Mortgage Capacity at Current Mortgage Rates
GOING FORWARD
People desire to live in Colorado Springs and rightfully so, job growth is strong, unemployment is low, and its economy is better off because of it. The same cannot be said for the cost of housing, which due to the acute housing unit deficit, coupled with persistent strong demand, has pushed prices out of reach for many residents. It comes as no surprise to engaged observers that Colorado Springs must increase and maintain the number of homes permitted annually but this is easier said than done, as inflationary conditions in the capital markets are constraining market-rate development as demonstrated by the reduction in 2023 permits compared to 2021-2022. With a housing supply deficit ranging between 16,554 and 27,360 units, to close the existing deficit by 2028 and meet new demand for housing, 6,403 to 8,564 housing unit permits need to be issued per year, the shortfall appears daunting but alas, hope springs eternal.
It is important to note that Colorado Springs leadership has been working diligently to address housing affordability, updating their Comprehensive plan (PlanCOS) in 2019, increasing density around transit and the city’s urban core, and just recently in 2023 as an offshoot of PlanCOS the city launched a process to create twelve community plans to engage residents, facilitate discussion between neighborhoods and help guide the cities development and funding strategies.[ix] The city has also updated its zoning code.[x]
So, what can Colorado Springs leaders do? They must stay the course, trust their extensive planning efforts, harness the feedback from the forthcoming community plans, and scale what is driving results on a community-by-community basis, taking gains in allowable density and design standard reforms where it is supported as is the ethos of PlanCOS. If construction litigation reforms as contemplated by pending legislation such as SB106 Right to Remedy make it to the governor and he signs it into law, Colorado Springs leadership should mobilize to evaluate the creation of an incentive package that entices owners of existing and/or multifamily rental units in the entitlement process to convert them into for-sale condominiums. Tax exemptions, fast-track approval processes, density bonuses, and increased height allowances are all tools that may be considered in such a package.
In closing Colorado Springs can do little to positively impact the mismatch in the value of the housing stock vs the existing household mortgage, as absent a significant financial correction akin to the global economic crisis of 2007-2008, something we should never hope to see again, the value of existing housing stock will not decline to meet the existing mortgage capacity. However, Colorado Springs can push this gap even wider, while simultaneously decreasing renter affordability if it retreats from its well-laid plans that have positioned the city to increase annual housing permits in 2021 and 2022, be they rental or for-sale as all new housing starts are beneficial. Believe in the power of filtering in the housing market.
Meaning – don’t retreat, continue to allow housing development at levels that the current capital market environment will allow, while concurrently building affordable housing utilizing state and federal resources. Then as you complete the two community plans per cycle, take those communities that demonstrate openness to gentle density zoning conditions, such as lot size and setback reductions, increases in allowable height, and greater unit density per acre that allow for duplexes, quads, and cottage courts. These zoning and design standards reforms are proven to provide greater housing affordability and deploy them with urgency as you concurrently move to the next community plans.
[i] Based on U.S. Census American Community Survey and Colorado State Demography Office.
[ii] https://commonsenseinstituteco.org/
[iii] https://www.wsj.com/articles/see-the-full-rankings-for-wsj-realtor-coms-summer-emerging-housing-markets-index-11658779946?mod=article_relatedinline
[iv]https://www.census.gov/quickfacts/fact/note/US/HSG010222#:~:text=A%20housing%20unit%20is%20a,occupancy)%20as%20separate%20living%20quarters.
[v] The Nation’s Stock of Second Homes, Zhao, Na., May 2013, National Association of Home Builders
[vi] Implementing a Regional Housing Needs Methodology in Oregon: Approach, Results, and Initial Recommendations. August 2020. ECONorthwest.
[vii] https://socds.huduser.gov/permits/
[viii] https://www.nahb.org/news-and-economics/press-releases/2022/07/builder-confidence-plunges-as-affordability-woes-mount
[ix] https://coloradosprings.gov/plancos
[x] https://coloradosprings.gov/project/retoolcos-zoning-ordinance-update