

In November, Colorado’s population-adjusted employment continued to recover. Colorado added 4,300 jobs in November and the unemployment rate fell to 3.5%. October’s employment estimate was revised downward by 3,200 jobs, bringing the prior month’s growth to 14,500 jobs. Government employment increased by 2,300 jobs in November and private-sector employment grew by 2,000. The leisure and hospitality sector lost 2,600 jobs and education and health services grew by 2,800 jobs, while construction decreased by 3,400 jobs. The number of unemployed decreased by 2,700 and the labor force decreased by 4,730 to 3,252,051.
The labor force participation rate of prime-age workers increased by 1.29 percentage points to 89.49 percent—the highest it’s been since December 2021. Over the year, the average workweek for Coloradoans on nonfarm payrolls was 33.2 hours, slightly below the national average of 34.4 hours, and average hourly earnings increased to $35.88, which is higher than the national average hourly earnings of $32.82.
If a Federal Reserve induced recession occurs in Colorado, and the unemployment rate reacts as it has in past recessions, then based on the recent increase in the fed funds rate, the unemployment rate could increase by 5.9 percentage points and there could be up to 171,000 job losses.
Key Findings—Colorado November 2022 Employment Data (BLS CES Survey and LAUS)
- Colorado added 4,300 total nonfarm jobs in November
- Private-sector employment increased by 2,000 while government employment increased by 2,300.
- October job growth was revised downward from a gain of 17,700 to 14,500 jobs.
- The total employment level is up 92% (82,400 jobs) above its pre-pandemic level, ranking Colorado 11th in terms of November ‘22 job levels relative to Jan. ’20.
- Twenty-seven states have employment levels above what they were at the start of the pandemic. Texas has the highest differential (+716,700 jobs).
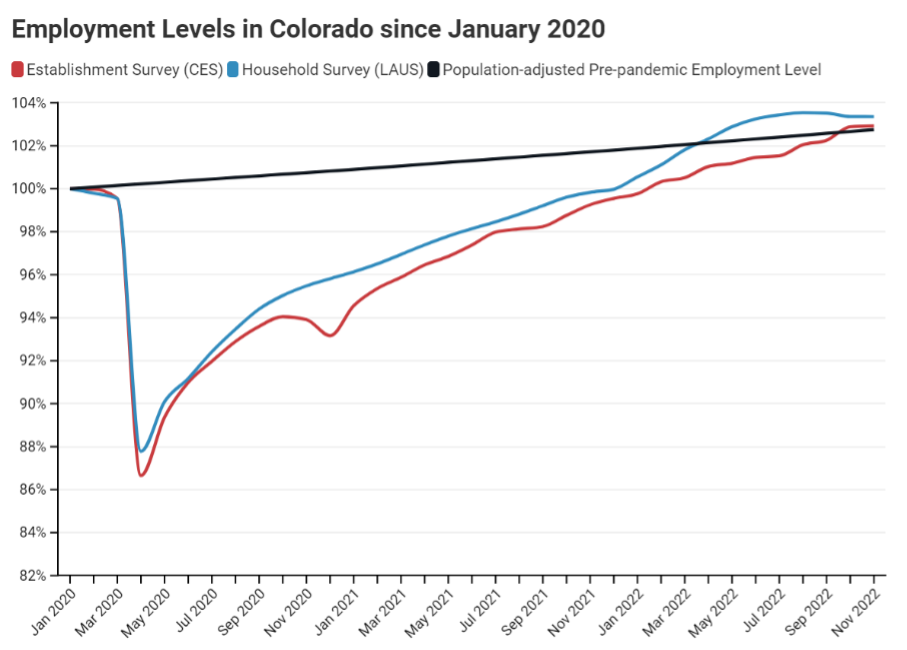 Colorado’s labor market continues to recover from the pandemic according to both measures of employment.
- According to the BLS survey of the number of jobs (CES), Colorado recovered to a pre-pandemic employment-to-population ratio for the first time in October.
- According to the BLS household survey (LAUS), which captures both traditional jobs and self-employment, the percentage of people employed fell in November but remains above its pre-pandemic value.
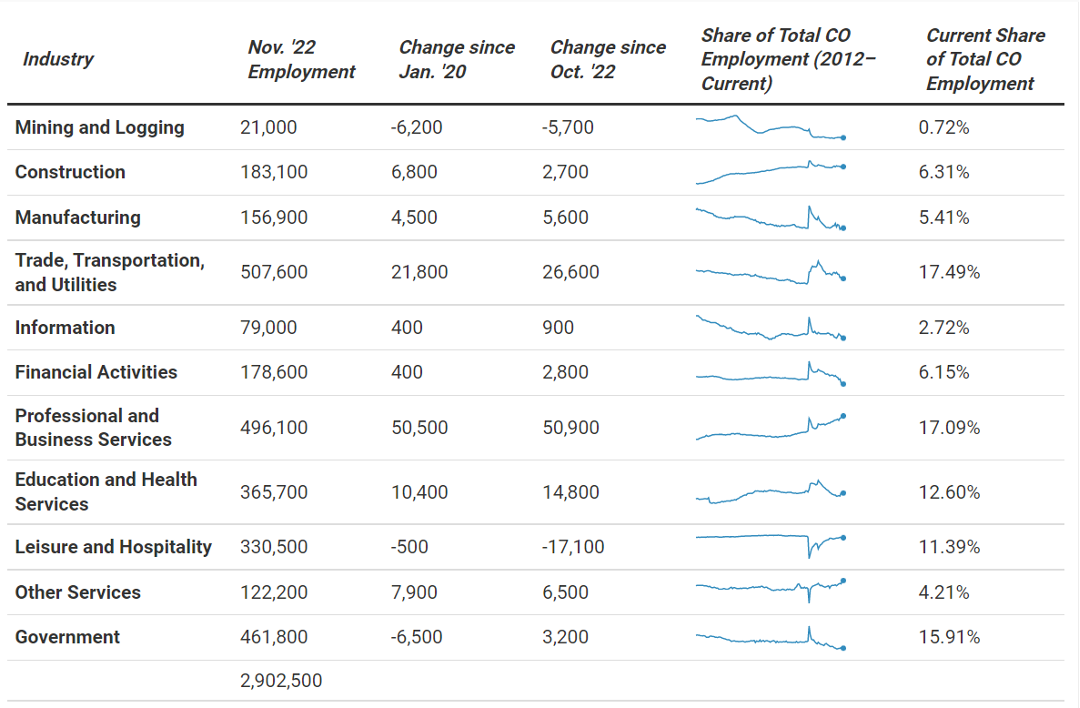
A Deeper Dive into Colorado Industries (BLS CES Survey)
- There was a wide range of job growth across sectors in November.
- The professional and business services industry added 2,200 jobs and financial activities employment grew by 2,000.
- The education and health services industry lost 2,800 jobs.
- The leisure and hospitality industry added 64,400 jobs between Jan. ‘21 and Nov. ‘22, but is still down 6,500 jobs, or 5.7%, relative to Jan. ‘20.
- Construction is up 1.67% (2,700 jobs).
- Manufacturing is up 3.56% (5,600 jobs).
- The pandemic caused a major shock to the composition of Colorado’s job market in early 2020 and may have induced some structural change in the long run.
- As a share of Colorado’s total employment, the professional and business services sector has grown by 7.91% since the start of 2020.
- The mining and logging sector has declined as a share of state employment by 23.6% since Jan. ‘20, though this is likely the result of a combination of global trends and state policy.
Colorado Labor Force Update
Colorado’s LFPR (labor force participation rate) rose to 72.03% in November; the state’s unemployment rate, however, decreased to 3.5%. The LFPR of retirement-age (65 years and older) workers, after declining last month, rebounded in November and is now below its pre-pandemic level by 0.44%.
Key Findings—Colorado November ‘22 Labor Force Data (FRED)
- The LFPR grew to 69.2%, which is 0.6 percentage points above Jan. ’20’s LFPR of 68.6%.
- The unemployment rate fell to5% in November, down 0.8 percentage points from a year ago.
- The LFPR of Colorado women increased from 25% to 65.85%. It is now 1.09 percentage points below its pre-pandemic level.
- The national female LFPR fell by .1 percentage points to 5%, which is 1.3 percentage points below its pre-pandemic level.
- There are now 24,336 fewer women in the workforce than there would be if Colorado’s November LFPR of women was the same as it was before the pandemic.
Monthly trends may be volatile and should be interpreted cautiously.
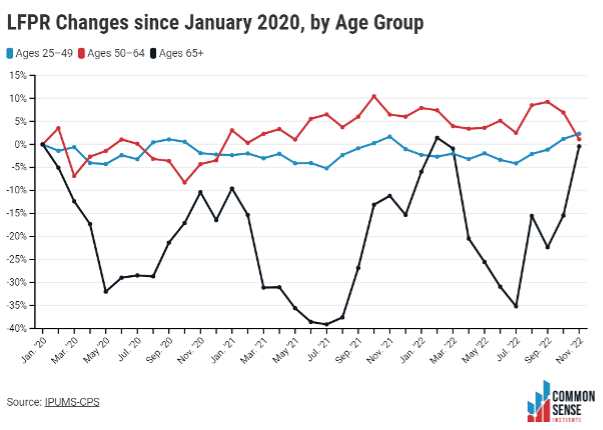
Prime-age, Older, and Retirement-age People in the Labor Force
- Since Jan. ’20, the labor force participation rate of all 50–64-year-old workers, regardless of sex, has increased by 1.11%.
- There are 2,865 fewer retirement-age workers in the labor force today than there would be at the pre-pandemic participation rate. After several months of decreasing labor force participation, this group’s LFPR has rebounded in recent months and sits just 0.18 percentage points below its March benchmark, and now sits at 28.50%.
- The LFPR of prime-age workers (25–49) grew by 1.29 percentage points and is now 2.32% above its Jan. ’20 level.
What Would a Recession Potentially Look Like in Colorado in Terms of Employment
Historically in Colorado, when the Federal Reserve (Fed) raised the fed funds rate, the state’s unemployment rate has risen in response. Looking at the historical data since 1977, CSI found nine periods when the Fed raised the fed funds rate, the rate at which commercial banks borrow and lend their excess reserves to each other overnight. Total rate hikes ranged between 1.91% and 13.0% and averaged 4.88%. The change in unemployment ranged between 0.6% and 5.9% and averaged 2.58%. The last time the Fed raised rates similar to the same magnitude as today, was between January 2004 and August 2007 when it raised rates 4.02%. The impact on the labor market in Colorado was a 5.9% increase in the unemployment rate.
As of October 2022, there are 2.9 million non-farm employees in Colorado. If the current rate hikes produce similar increases in the unemployment rate, Colorado could see an increase in unemployment of approximately 171,000 workers.
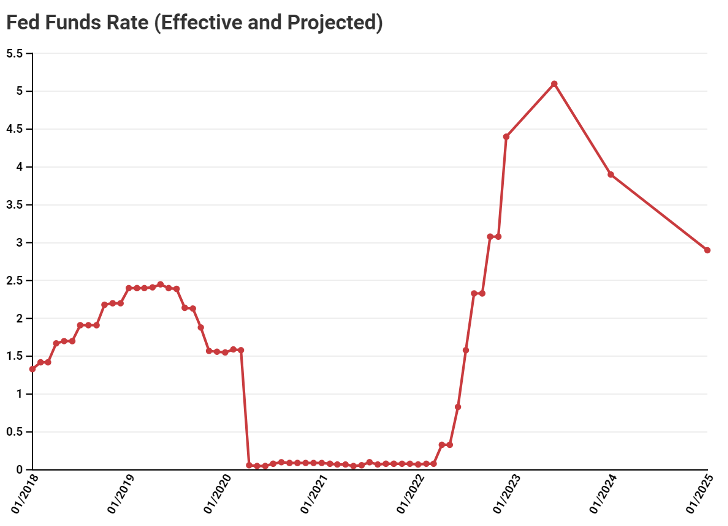
Recent Changes in the Fed Funds Rate
In March of 2022, the Federal Reserve began raising the federal funds rate to tackle high inflation. As of December 14, 2022, the federal funds rate has increased from 0.08% in March, to 3.83% and the Federal Reserve raised them at the December FOMC meeting once again. Current projections for the median federal funds rate are shown in the following graph. By the end of 2022, expectations are for the rate to reach between 4.25% and 4.5%. After the December FOMC meeting the Fed indicated that further rate hikes are penciled in for 2023, eventually topping out around 5.25% and then begin to tape off in 2024 and 2025.
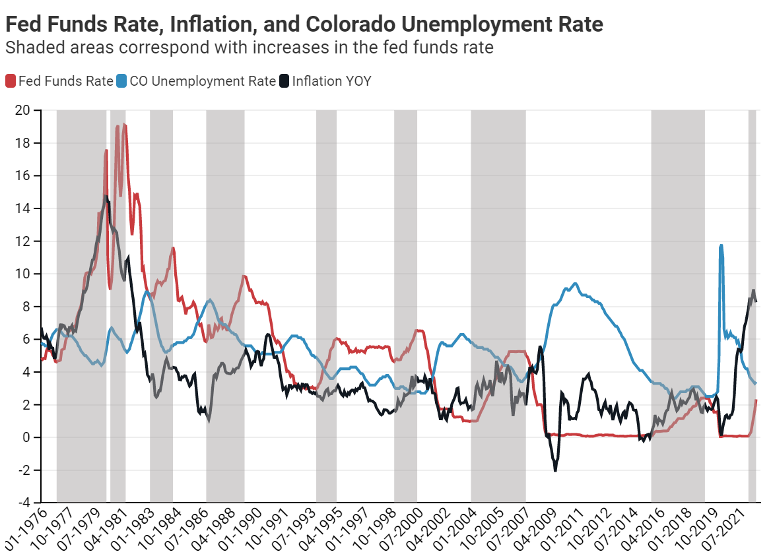
Historical Response of the Unemployment Rate in Colorado to Fed Funds Rate Increases
In the past, increases in the federal funds rate resulted in increases in the unemployment rate. As shown in the following graph and table, since 1976, Colorado has experienced 8 prior periods of sustained increases in the Fed Funds Rate as the Federal Reserve tackled rising inflation. The range of fed fund increases varies from 191 and 1300 basis points. All of these Fed Funds rate increases resulted in a direct increase in the unemployment rate between 60 to 370 basis points and the elevated unemployment rate went down after a range of 244 days to 1,310 days.
Past Periods of Fed Funds Rate Increases and Changes in the Colorado Unemployment Rate
| Period of Raised Fed Funds Rate | Period of Increased Unemployment Rate Following the Fed Funds Rate hikes | Total Effective Fed Funds Rate Hike | Total Increase in the Unemployment Rate | Length of Period Between beginning of Rate Hikes and Increased Unemployment Rate (Days) | Length of Time Before UR Fell (Days) |
|---|---|---|---|---|---|
| Jan 77 to Apr 80 | Dec 79 to Aug 80 | 13.00% | 2.30% | 1064 | 244 |
| Jul 80 to Jul 81 | Aug 81 to Dec 82 | 10.01% | 3.70% | 396 | 487 |
| Feb 83 to Aug 84 | Mar 84 to Jan 87 | 3.13% | 3.20% | 394 | 1036 |
| Oct 86 to Apr 89 | Oct 91 to Jun 92 | 3.99% | 0.80% | 1826 | 244 |
| Dec 93 to Apr 95 | Jan 95 to Aug 96 | 3.09% | 0.60% | 396 | 578 |
| Jan 99 to Jul 00 | Jan 01 to Aug 03 | 1.91% | 3.50% | 731 | 942 |
| Jan 04 to Aug 07 | May 07 to Dec 10 | 4.02% | 5.90% | 1216 | 1310 |
| Oct 15 to Apr 19 | May 17 to Dec 18 | 2.30% | 0.60% | 578 | 579 |
| Feb 22 to Sep 22 | n/a | 2.48% | n/a | 242 | n/a |
| Average | n/a | 4.88% | 2.58% | 767 | 678 |