

The cost of housing in Colorado—and particularly the Denver metro area—has made the state an increasingly expensive place to live. Since 2015, the price of housing in metro Denver has exceeded the U.S. average, hindering its regional competitiveness. Significant fluctuations in demand during the pandemic, coupled with a growing supply shortage due to lagging development over the last decade, have created the conditions for a highly strained market. Though mortgage interest rates have moderated slightly this month, consensus expectations are that they will continue to rise as the Federal Reserve tackles inflation. Higher mortgage rates will raise the cost of new home purchases, slowing demand. While this may provide some relief, there are some indications that, despite a large increase in recent permitting, actual home completions will decline as builders gauge the impact of a slowing economy on housing demand.
Key Findings
- Due to elevated prices and rising interest rates, the affordability of purchasing a home is at the lowest point in more than 33 years. In just the past 7 years, the cost of purchasing a home has doubled, with half of that increase occurring over the last two years.
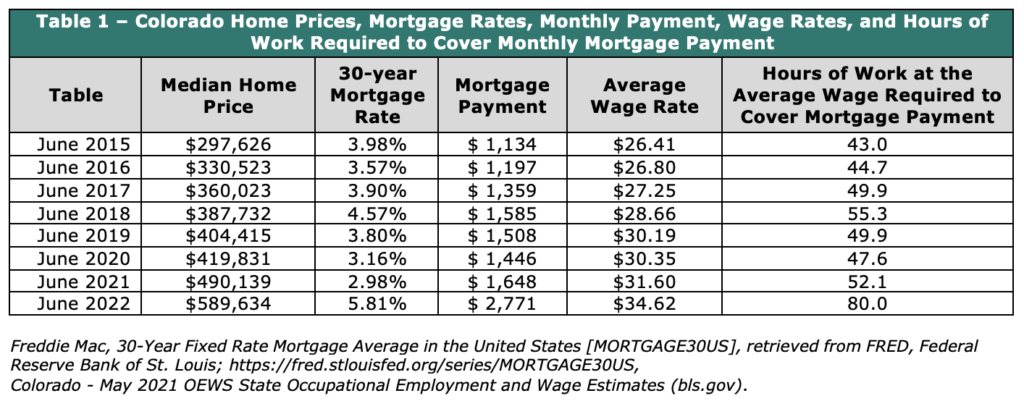
- Household incomes have not kept pace with rising housing costs. Between June 2015 and June 2022, the average hourly wage increased 31% from $26.41 to $34.62. However, due to the rapidly increasing cost of housing, the number of hours of work required to cover the median mortgage payment increased from 43 hours to 80 hours, an 86% increase.
- 98% of Coloradans live in a county with an aggregate housing supply shortage. Through 2020, the deficit in housing was between 93,000 and 216,000 units. The shortage grew following the financial crisis, reaching a peak a few years before the pandemic. Home buyer preferences coming out of the pandemic combined with easy monetary and expansionary fiscal policy led to excessive strain on the market causing home prices to soar.
- Between 46,600 and 72,600 permits are needed annually through 2025 to close the statewide housing supply deficit and meet the demands of future population growth. Permitting for new housing in 2021 was 40 percent higher than in the previous 5 years and permitting in 2022 is on pace to remain within the targeted range. Still, 35 counties in 2021 failed to issue enough annual permits to close the housing deficit and meet future demand for housing through 2025. Recent reports indicate that the homebuilding market may be contracting. To avoid a similar collapse in new home building that followed the last recession, permitting must remain at elevated levels for the next several years.
Declining Affordability as Measured by the Homebuyer Misery Index
The “Colorado Homebuyer Misery Index”, as developed by CSI, captures the impact of housing prices and mortgage rates on the affordability of purchasing a new home. The homebuyer index is based on 30-year mortgage rates and the S&P CoreLogic Case-Shiller Home Price Index for the Denver metro area.[i][ii] The mortgage rates are converted into an index with 2000 as its base year; it is then added to the Case-Shiller index and normalized. The following graph shows the evolution of the Colorado Homebuyer Misery Index since 1989. The significant increase in the index value over the last two-and-a-half years reflects the drastic decrease in home affordability.
Home affordability has decreased by 92% since 2015. Stated another way, purchasing a home in May 2022 was twice as expensive as it was in 2015.
Fifty percent of the decline in affordability from 2015 occurred since 2020 alone, as both home price and mortgage rates have grown.
Hours of Work Needed to Afford a Home Mortgage
To measure the impact on the average homeowner in Colorado, we calculated the number of hours that one would have to work while earning the average hourly wage ($34.62 in May 2022) to cover the monthly mortgage payments shown in Table 1. Over just the last 12 months, an additional 27 hours of work per month has become necessary to cover the mortgage on a median priced home.
The graph above shows the evolution of monthly mortgage payments on a median-price home and the required hours of work necessary to cover the payment. Required hours fluctuated around 60 until 2006 before declining to 33 in 2012 and then gradually increasing until 2019, just prior to the pandemic.
Since the start of the pandemic the hours of work required to afford a mortgage on a median priced home climbed to 80 hours. This is 12 hours and 18% above the previous peak in 2006.
Colorado’s Housing Supply Shortage
Colorado has failed to build enough housing to keep pace with demand. Standard housing market reports like those developed by the Colorado Association of REALTORS ® track inventory based on homes listed for sale. What those reports don’t capture is the total stock of homes that are needed to maintain a healthy housing market.
CSI estimated the number of homes by select Colorado counties needed to achieve a healthy housing market under two scenarios. Each scenario is intended to measure the difference between the actual number of homes in a county relative to the number of homes needed to maintain a more stable market for the local population. The first scenario averages the values of a housing deficit or surplus based on the low estimate of homes held off the market for purchase by the local population. The second scenario averages the values of a housing deficit or surplus based on the high estimate of homes held off the market for purchase by the local population.
Housing units and households – Each scenario averaged the values generated using both the estimate of housing units and households from U.S. Census Bureau’s American Community Survey (ACS) and the Colorado State Demography Office.
Homes held off the market – Total homes held off the market reflect existing housing units not available for purchase by the local population. The estimate includes a range of second homes at the county level released by the National Association of Homebuilders,[iii] along with an estimate of uninhabitable homes from ACS.
Desired ratio of total units to local population – To estimate the target number of housing units, the value of 1.1 housing units per household was used to represent a healthy market. This value is derived from the historic average ratio of vacancy rates for the U.S. and was the basis for a housing supply report done for the state of Oregon.[iv]
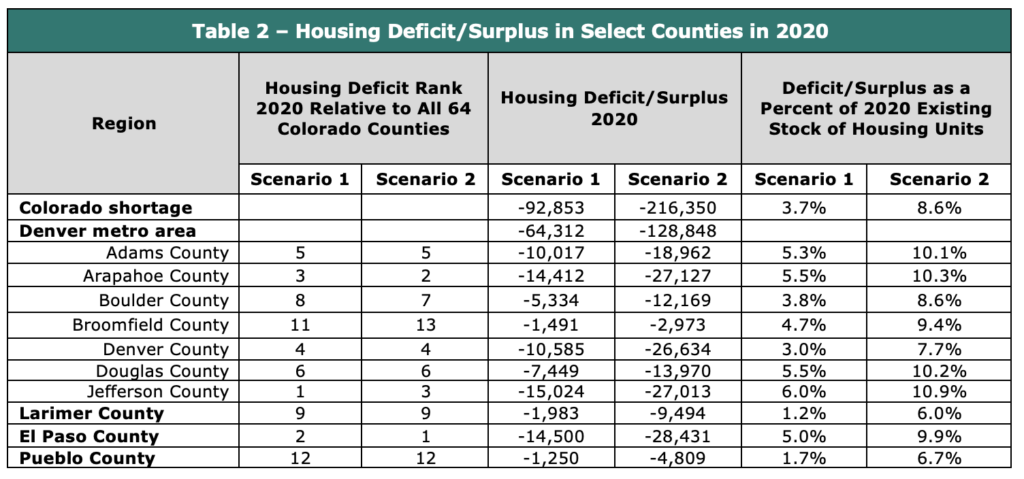
Using the scenarios discussed above, the deficit in housing units in 2020 is estimated to have been between 92,853 and 216,350 units. Table 2 presents summary results across Front Range counties with the largest deficits. CSI will continue to monitor new data as it becomes available and will amend the estimates and methodology as required.
Estimates of the housing shortfall produced by other organizations and previous CSI estimates fall within the range presented in this paper:
- The State of Colorado estimated the statewide housing deficit at 225,000.[v]
- Up For Growth estimated the statewide housing deficit at 127,000.[vi]
- CSI estimated the statewide deficit at 175,000 in a June 2021 Report.[vii]
- CSI estimated the statewide deficit at 195,000 in June 2022 Report on housing affordability.[viii]
In the Denver metro area, the deficit ranges between 64,000 and 129,000 units. All seven counties in the Denver metro area have deficits, with Jefferson County experiencing the largest deficit relative to the existing housing stock at between 6% and 11%. The other large counties along the Front Range of Larimer, El Paso, and Pueblo all have housing supply deficits.
In many mountain counties, the composition of housing, not just the overall level of supply is an important issue. In future iterations of this analysis, CSI will estimate the deficit/surplus in housing at differing levels of affordability, with a focus on affordable housing for local residents.
Just to cover the population increases by 2025 as projected by the Colorado State Demography Office, an additional 139,000 housing units need to be built. To cover the 2020 deficit plus new demand for housing by 2025, between 227,000 and 353,000 housing units need to be built. New housing demand will occur in counties with deficits and some with surpluses, so merely adding the 2020 housing deficit with new demand for housing does not accurately depict the number of new housing units required to be built. In counties with surpluses some of the surplus homes will be occupied by the new demand.
Building Permits and the Housing Supply Deficit
The housing supply deficit began to accumulate in the 1990s as Colorado experienced a substantial increase in population. After a short period between 2002 and 2007, when permitting kept pace with changes in population, the deficit began to decline. In 2008 the deficit began to build and continued to increase through 2017 as, once again, the number permitted building units issued were not keeping pace with annual increases in population (see the following graph).
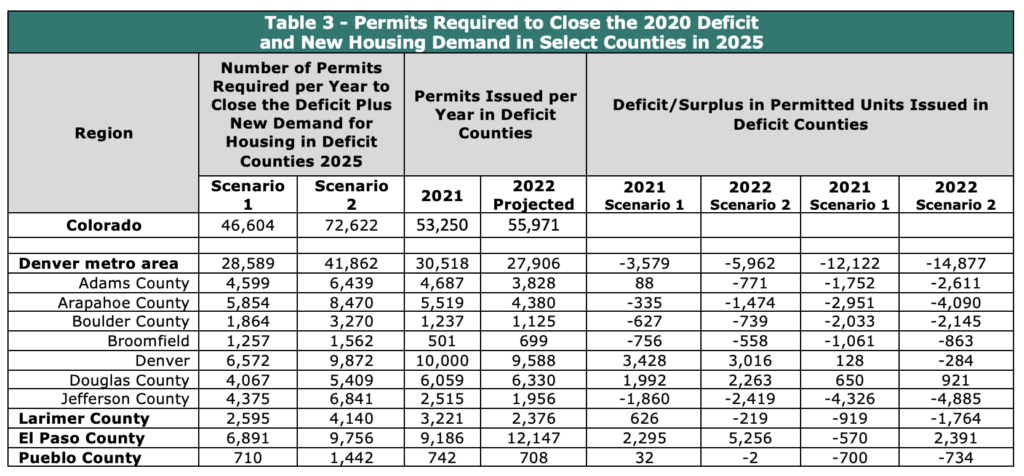
To erase the estimated statewide deficit and meet new population-driven demand for housing by 2025, an additional 47,000 to 73,000 permitted units are required per year. CSI is tracking building unit permits by county on a quarterly basis to evaluate whether the level of issuance is sufficient to close the existing housing deficit and meet new demand for housing as the population grows. See Table 3 to see the scenario estimates for Colorado, the Denver metro area, Larimer, El Paso, and Pueblo.
In 2021, 35 counties failed to issue enough annual permitted units to close the housing deficit and meet new housing demand by 2025. In 2022, based on the annualization of permitted unit data through April, 44 counties are on track to issue an insufficient number of permitted units to close the 2020 housing deficit and meet new housing demand by 2025.
Some counties with housing deficits, like Denver, are currently issuing more than enough annual new building unit permits to address deficits in their county and future housing needs, however, these surplus permits do not help alleviate deficits in other counties. In many counties where there are housing deficits, not enough new building unit permits are being issued to cover current deficits let alone new housing demand. Should this continue, the housing supply deficit will continue to grow.
Going Forward
As mortgage rates have increased recently, housing prices have begun to taper off and in response, many home builders are re-evaluating their plans for new housing development. The July Housing Market Index (HMI) released by the National Association of Homebuilders, which reflects builder confidence in the market for newly built single-family homes, fell for the 7th straight month to lowest point since May 2020.[ix] However, the deficit in housing remains and if builders do reduce annual production, the existing deficit will not be overcome. If population growth continues, the deficit will grow. Developers should transition to building higher density and less expensive housing so that the deficit can be erased even in a falling price environment.
[i] S&P Dow Jones Indices LLC, S&P/Case-Shiller CO-Denver Home Price Index [DNXRSA], retrieved from FRED, Federal Reserve Bank of St. Louis; https://fred.stlouisfed.org/series/DNXRSA, June 22, 2022.
[ii] Freddie Mac, 30-Year Fixed Rate Mortgage Average in the United States [MORTGAGE30US], retrieved from FRED, Federal Reserve Bank of St. Louis; https://fred.stlouisfed.org/series/MORTGAGE30US, July 12, 2022.
[iii] The Nation’s Stock of Second Homes, Zhao, Na., May 2013, National Association of Home Builders
[iv] Implementing a Regional Housing Needs Methodology in Oregon: Approach, Results, and Initial Recommendations. August 2020. ECONorthwest.
[v] Affordable Housing Transformational Task Force: Recommendation Report, January 2022 – Wellstone Collaborative Strategies.
[vi] Housing Underproduction in the U.S. 2022, Up for Growth
[vii] From Conflict to Compassion: A Colorado Housing Development Blueprint for Transformational Change | Common Sense Institute (commonsenseinstituteco.org)
[viii] The Uncertain Future Cost of Colorado’s Energy Infrastructure and Housing Affordability | Common Sense Institute (commonsenseinstituteco.org)
[ix] https://www.nahb.org/news-and-economics/press-releases/2022/07/builder-confidence-plunges-as-affordability-woes-mount