

The cost of housing in Colorado—and particularly the Denver metro area—has made the state a more expensive place to live. Since 2015, the price of housing in metro Denver has exceeded the U.S. average, hindering its regional competitiveness. Significant fluctuations in demand during the pandemic, coupled with a growing supply shortage due to lagging development over the last decade, have created the conditions for a highly strained market. Consensus expectations for mortgage rates are that they will continue to rise as the Federal Reserve tackles inflation. Higher mortgage rates will raise the cost of new home purchases, undoubtedly slowing demand. While this may provide some relief, there are some indications that, despite a large increase in recent permitting, actual home completions will decline as builders gauge the impact of a slowing economy on housing demand.
This quarterly report analyzes trends in affordability and estimates whether there is a deficit or surplus in housing units across select Colorado counties. Since CSI’s July release, census data on the number of housing units and households for 2021 have become available. It is important to note that the housing unit deficit/surplus estimates change with each new data release. Despite this, there remains a substantial deficit in the supply of housing.
Key Findings
- Due to elevated prices and rising interest rates, the affordability of purchasing a home is near the lowest point in more than 33 years. In just the past 7 years, the cost of purchasing a home has doubled, with half of that increase occurring over the last two years.
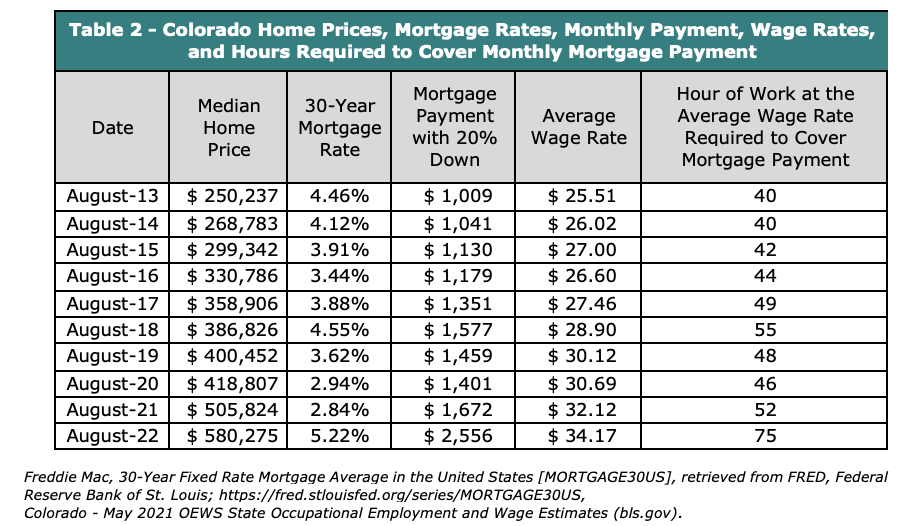
- Household incomes have not kept pace with rising housing costs. Between August 2015 and August 2022, the average hourly wage increased 27% from $27 to $34.71. However, due to the rapidly increasing cost of housing, the number of hours of work required to cover the median mortgage payment increased from 40 hours to 75 hours, an 89% increase as seen in Table 1.
- In 2021, 80% of Coloradans live in a county with an aggregate housing supply shortage. Through 2021, the deficit in housing was between 25,000 and 117,000 units. The shortage grew following the financial crisis, reaching a peak a few years before the pandemic. Home buyer preferences coming out of the pandemic combined with easy monetary and expansionary fiscal policy led to excessive strain on the market causing home prices to soar.
- Between approximately 20,000 and 46,000 permits are needed annually through 2025 to close the statewide housing supply deficit and meet the demands of future population growth. Projected permitting for new housing in 2022 is 15 percent higher than in the previous 5 years but it is tapering off as home builders reassess the demand for housing in a higher interest rate environment. Based on permit data through August, counties with supply deficits are projected to be 5,000 permits short of the required annual amount to close the deficit plus new housing demand by 2025. Recent reports indicate that the homebuilding market may be contracting. To avoid a similar collapse in new home building that followed the last recession, permitting must remain at elevated levels for the next several years.
- Homebuilder confidence has declined 75% since a recent high in November 2020. The National Association of Home Builders/Wells Fargo Housing Market Index for the Western Region is now 25, after falling for 8 straight months indicating a decrease in the rate of new housing creation going forward.
- Home affordability has decreased by 86% since 2015. Stated another way, purchasing a home in September 2022 was nearly twice as expensive as it was in 2015.
Declining Affordability as Measured by the Homebuyer Misery Index
The “Colorado Homebuyer Misery Index”, as developed by CSI, captures the impact of housing prices and mortgage rates on the affordability of purchasing a new home. The homebuyer index is based on 30-year mortgage rates and the S&P CoreLogic Case-Shiller Home Price Index for the Denver metro area.[i][ii] The mortgage rates are converted into an index with 2000 as its base year; it is then added to the Case-Shiller index and normalized. The following graph shows the evolution of the Colorado Homebuyer Misery Index since 1989. The significant increase in the index value over the last two-and-a-half years reflects the drastic decrease in home affordability.
Forty-one percent of the decline in affordability from 2015 occurred since 2020 alone, as both home price and mortgage rates have grown. Since May of this year home prices have leveled off or decreased slightly. However, mortgage rates have increased, offsetting a portion of the change in home prices.
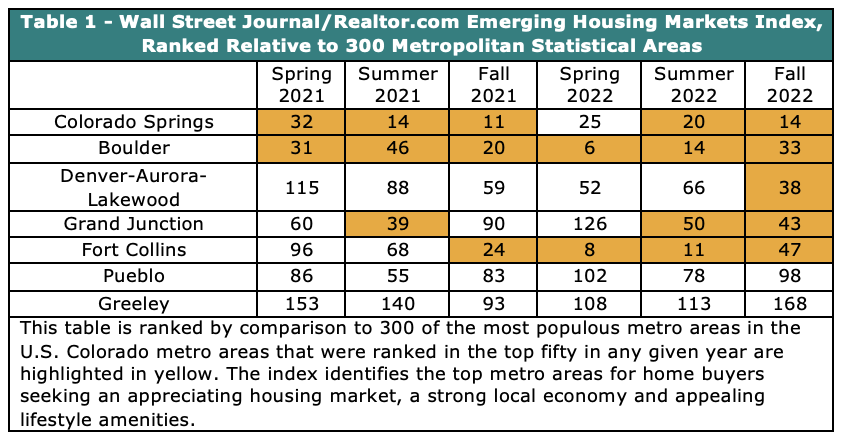
The Wall Street Journal and Realtors.com began producing their Emerging Housing Markets Index in spring 2021 and has now published 6 quarterly estimates. The index identifies the top metro areas for home buyers seeking an appreciating housing market, strong local economies, and appealing lifestyle amenities. Three hundred of the most populous core-based statistical areas as measured by the U.S. Census Bureau are evaluated using two main areas: real-estate markets (50%) and economic health (50%). It utilizes 11 key indicators that are weighted and summed to create a single measure: real-estate supply (16.6%), real-estate demand (16.6%), medium home listing price trend (16.6%), unemployment (6.25%), wages (6.25%), regional price parities (6.25%), amenities (6.25%), small businesses (6.25%), and property taxes (6.25%).[iii]
Table 1 shows the rankings of the Colorado core-based statistical areas relative to all three hundred most populous areas included in the index. Colorado Springs and Boulder (with the exception of summer 2021) are ranked consistently in the top 10 percent, and five Colorado cities are usually in the top 20 percent. This index provides some perspective that while housing affordability is near record lows, Colorado’s housing markets are viewed as relatively attractive given the potential for prices to continue to rise and for other quality of life amenities and economic factors
Home Prices
Shown in the following figure below, home prices as measured by the S&P/Case-Shiller Home Price Indices for low-tier, mid-tier, and high-tier rose 38%, 38.6%, and 40.9% respectively from the beginning of the Covid-19 pandemic through April 2022. Since May 2022, home prices have all begun to decline. Through October, home prices in the Denver MSA have retreated 2.5%, 2.6%, and 3.8% for the low, mid, and high tier homes. Nationally, home prices increased 40% from the beginning of the Covid-19 pandemic through April 2022 and have declined 1.1% since May 2022. The decline in home prices is offset by the increase in mortgage rates and therefore has done little to improve affordability.
Hours of Work Needed to Afford a Home Mortgage
To measure the impact on the average homeowner in Colorado, CSI calculated the number of hours that one would have to work while earning the average hourly wage ($34.17 in August 2022) to cover the monthly mortgage payments shown in Table 2. Over just the last 12 months, an additional 23 hours of work per month has become necessary to cover the mortgage on a median priced home.
The graph above shows the evolution of monthly mortgage payments on a median-price home and the required hours of work necessary to cover the payment. Required hours fluctuated around 60 until 2006 before declining to 33 in 2012 and then gradually increasing until 2019, just prior to the pandemic.
Since the start of the pandemic the hours of work required to afford a mortgage (with 20% down) on a median priced home climbed to 75 hours. This is 12 hours and 11% above the previous peak in 2006.
Colorado’s Housing Supply Shortage
Colorado has failed to build enough housing to keep pace with demand. Standard housing market reports like those developed by the Colorado Association of REALTORS® track inventory based on homes listed for sale. What those reports do not capture is the total stock of homes needed to maintain a healthy housing market.
CSI estimated the number of homes by select Colorado counties needed to achieve a healthy housing market under two scenarios. Each scenario is intended to measure the difference between the actual number of homes in a county relative to the number of homes needed to maintain a more stable market for the local population. The first scenario averages the values of a housing deficit or surplus based on the low estimate of homes held off the market for purchase by the local population. The second scenario averages the values of a housing deficit or surplus based on the high estimate of homes held off the market for purchase by the local population.
Housing units and households – Each scenario uses both the estimate of housing units and households from U.S. Census Bureau’s American Community Survey (ACS).
Homes held off the market – Total homes held off the market reflect existing housing units not available for purchase by the local population. The estimate includes a range of second homes at the county level released by the National Association of Homebuilders,[iv] along with an estimate of uninhabitable homes from ACS.
Desired ratio of total units to local population – To estimate the target number of housing units, the value of 1.1 housing units per household was used to represent a healthy market. This value is derived from the historic average ratio of vacancy rates for the U.S. and was the basis for a housing supply report done for the state of Oregon.[v]
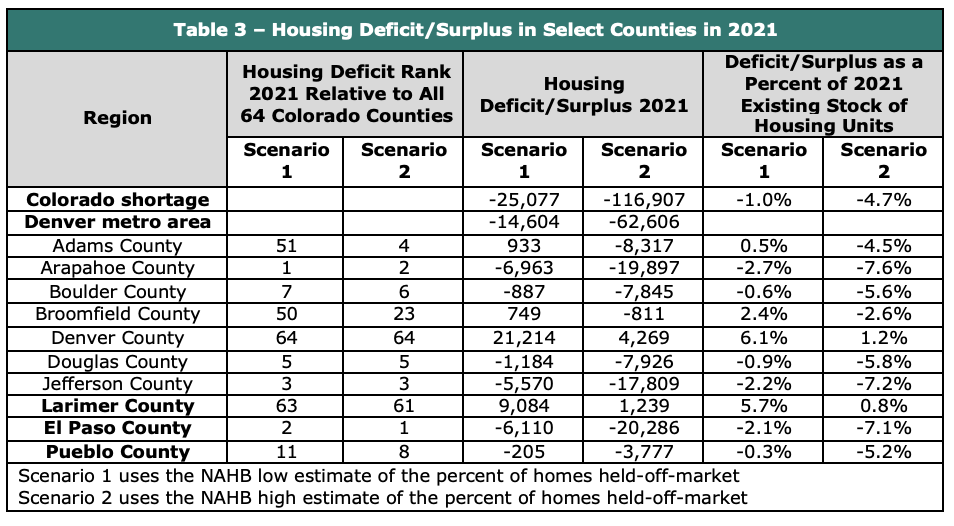
Using the scenarios discussed above, the deficit in housing units istimated to have been between 25,077 and 116,907 units. Table 3 presents summary results across Front Range counties with the largest deficits. CSI will continue to monitor new data as it becomes available and will amend the estimates and methodology as required.
In the Denver metro area, the deficit ranges between 14,604 and 62,606 units. In scenario 1, three counties, Arapahoe, Douglas, and Jefferson have a housing deficit. In scenario 2, only Denver County has a surplus of housing. Among the other large counties along the Front Range, Larimer has a surplus in both scenarios and El Paso, and Pueblo both have housing supply deficits.
In many mountain counties, the composition of housing, not just the overall level of supply, is an important issue. In future iterations of this analysis, CSI will estimate the deficit/surplus in housing at differing levels of affordability, with a focus on affordable housing for local residents.
To cover the 2021 deficit and new demands for housing due to population growth by 2025, between 97,000 and 220,000 new housing units need to be built. New housing demand will occur in counties with deficits and some with surpluses, so merely adding the 2021 housing deficit with new demand for housing does not accurately depict the number of new housing units required to be built. In counties with surpluses a portion of the surplus homes will be occupied by the new demand.
Building Permits and the Housing Supply Deficit
The housing supply deficit began to accumulate in the 1990s as Colorado experienced a substantial increase in population. After a brief period between 2002 and 2007, when permitting kept pace with changes in population, the deficit began to decline during the Great Recession. In 2008 the deficit began to build and continued to increase through 2016, as, once again, the number permitted building units issued were not keeping pace with annual increases in population. After decreasing through 2020, the deficit once again began to rise.(see the following graph).
To erase the estimated statewide deficit and meet new population-driven demand for housing by 2025, an additional 19,951 e whether the level of issuance is sufficient to close the existing housing deficit and meet new demand for housing as the population grows. See Table 4 to see the scenario estimates for Colorado, the Denver metro area, Larimer, El Paso, and Pueblo.
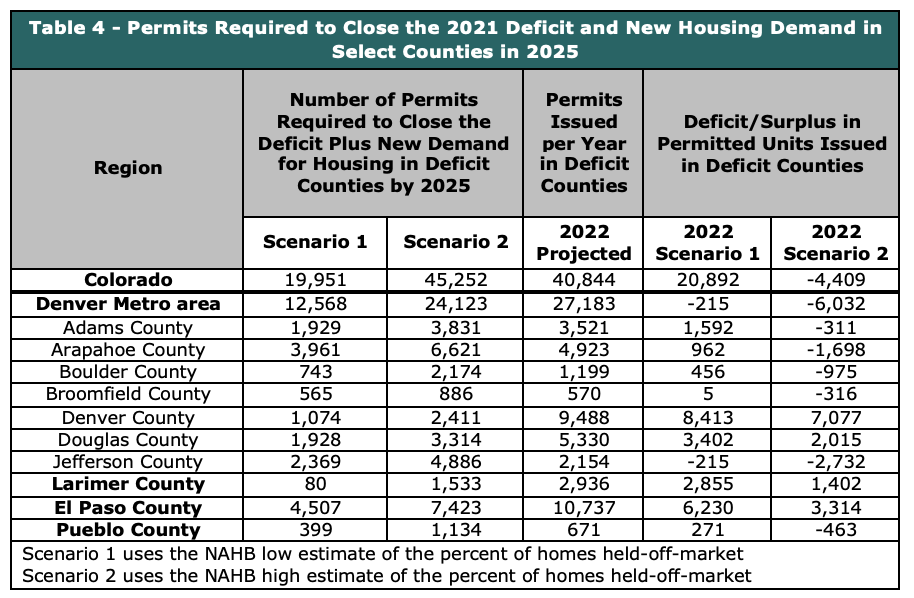
In 2022, based on the annualization of permitted unit data through April, under scenario 1 two counties are on track to issue an insufficient number of permitted units to close the 2021 housing deficit and meet new housing demand by 2025. Under scenario 2, fifty counties are on track to issue an insufficient number of permitted units to close the 2021 housing deficit and meet new housing demand by 2025.
Some counties with housing deficits, like Denver, are currently issuing more than enough annual new building unit permits to address deficits in their county and future housing needs, however, these surplus permits do not help alleviate deficits in other counties. In many counties where there are housing deficits, not enough new building unit permits are being issued to cover current deficits let alone new housing demand. Should this continue, the housing supply deficit will continue to grow.
The following graph shows the number of housing units in deficit counties to close the deficit by 2025 for 2 scenarios, and the number of permits issued monthly so far. The red line shows the average monthly required permits to close the 2021 deficit and meet new housing demand by 2025 for scenario 1. The blue line is for scenario 2. In scenario 1, enough permits have been issued in four months, January, March, May, and June to cover the housing deficit and meet new demand for housing by 2025. However, permitting is trending down as high interest rates are dampening demand for housing and builders are applying for fewer permits. The opposite is true for scenario 2, in this case, enough permits were issued in only one month, March. After March, insufficient permits have been issued to close the deficit and meet new housing demand by 2025. The number of permits issued in deficit counties varies between scenario 1 and 2 because under scenario 2, more counties have supply deficits. Therefore, we are tracking the permits in the additional deficit counties.
Going Forward
As shown in the following graph, as mortgage rates (black line) have increased since March 2022, demand for housing has begun to taper off and in response, many home builders are re-evaluating their plans for new housing development, thus, new housing starts (blue line) have declined by 25 percent since March 2021. The October Housing Market Index (HMI) (red line) released by the National Association of Homebuilders, which reflects builder confidence in the market for newly built single-family homes, fell for the 10th straight month to the lowest point since April 2020.[vi]
The housing deficit remains and if builders reduce annual production, which looks increasingly likely based on the HMI, the deficit will not decrease. If population growth continues, absent sufficient new housing units, the deficit will grow. Developers should transition to building higher density and less expensive housing so that the deficit can be erased even in a high interest rate environment.
[i] S&P Dow Jones Indices LLC, S&P/Case-Shiller CO-Denver Home Price Index [DNXRSA], retrieved from FRED, Federal Reserve Bank of St. Louis; https://fred.stlouisfed.org/series/DNXRSA, June 22, 2022.
[ii] Freddie Mac, 30-Year Fixed Rate Mortgage Average in the United States [MORTGAGE30US], retrieved from FRED, Federal Reserve Bank of St. Louis; https://fred.stlouisfed.org/series/MORTGAGE30US, July 12, 2022.
[iii] https://www.wsj.com/articles/see-the-full-rankings-for-wsj-realtor-coms-summer-emerging-housing-markets-index-11658779946?mod=article_relatedinline
[iv] The Nation’s Stock of Second Homes, Zhao, Na., May 2013, National Association of Home Builders
[v] Implementing a Regional Housing Needs Methodology in Oregon: Approach, Results, and Initial Recommendations. August 2020. ECONorthwest.
[vi] https://www.nahb.org/news-and-economics/press-releases/2022/07/builder-confidence-plunges-as-affordability-woes-mount