

The following series of figures show the impact of policies in response to COVID-19 on Colorado’s economy. Most figures show the changes from February 2020, a full month prior to Colorado’s stay-at-home order, through November 2020, the most current month of data. Following the most severe shocks brought on by the stay-at-home orders in March, the Colorado economy had been on a general trend of recovery through October. However, the November data shows a reversal in growth as the number of jobs in the state declined for the first time since April. While labor force participation has been more volatile than employment levels, the statewide labor force participation rate also declined in November after consecutive months of improvement since July. Given the increased restrictions on businesses through Thanksgiving and the holidays, and the surge in both initial and continued unemployment insurance claims, it is likely that December data will only show this trend to have worsened.
The figures included in this report cover labor force participation rates, unemployment rates, employment levels, and unemployment insurance claims. The data used in this report is sourced from the U.S. Bureau of Labor Statistics (BLS), U.S. Census Bureau (CENSUS), U.S. Department of Labor, and the Integrated Public Use Microdata Series – Consumer Population Survey (IPUMS – CPS).
Key Findings and Trends:
Colorado Labor Force
- The Colorado labor force participation rate (LFPR) was 67.5% in November. This rate was 2 percentage points below the February level of 69.4%, indicating approximately 90,000 fewer people in the Colorado labor force. (Figure 1).
- The labor force participation rates for both men and women above the age of 35 were lower in November than in February, whereas the labor force participation rates for men and women below 35 were above February levels. (Figures 5 and 6).
- As of November 2020, the LFPR for women with kids was 8.6 percentage points below the LFPR in February of 79%. (Figure 8) This was just .4 percentage points higher than the 2020 low-point in October. This means that just over 1 in every 10 mothers who was in the labor force before the pandemic, was no longer actively participating in the labor force in November. The LFPR for men with or without kids was less than 2 percentage points below its February level and women without kids was up 3 percentage points.
Colorado Unemployment Rate
- The Colorado unemployment (UE) rate remained at 6.4%, virtually unchanged since September. It remained flat as both the number of jobs and the size of the labor force declined at a similar rate. It peaked at 12.2% in April, 9.7 percentage points above the February rate of 2.5% (Figure 2).
- Through the worst economic shocks in March, April and May, the gap in UE rates between those above and below age 35 increased, indicating large employment losses by younger workers. While the gap in UE rates between the two groups shrank through September and October, the November data indicates the gap may be widening again. (Figure 9)
- The decline in employment from October to November seemed to disproportionately impact those with a bachelor’s degree and higher. This group’s UE rate jumped significantly from 4.3% in October to 6.4% in November, while other groups remained more constant or even declined. (Figure 13)
Economic Health of Colorado
- While the November labor force and jobs reports indicate early signs of a declining economy, the weekly unemployment insurance claims show the economic health of Colorado worsening through the holidays. Regular continued unemployment insurance claims fell from the peak in May of 265,000 to 79,000 during the week of November 21st. However, total continued claims increased to 280,000 as of the week of December 19th, and initial claims climbed from 7,000 weekly claims during week of October 24th to 44,000 initial claims during the week of Christmas, however, CDLE has suggested this value will be revised due to fraud.
- The November women’s average monthly wage (AMW) was $1,063, up $84 from October. Despite this growth, the gap between the male and female AMW dropped 14% as the AMW for men increased to $1,706, up $434 from October.
- November was the first month since April to see a decline in the total number of jobs. Private sector employment declined by 6,000 jobs in November, as the leisure and hospitality industry continued to be the most impacted sector. (Figure 17)
When respondent results are broken into sub-groups, there may be different trends from the aggregated level.
Colorado History
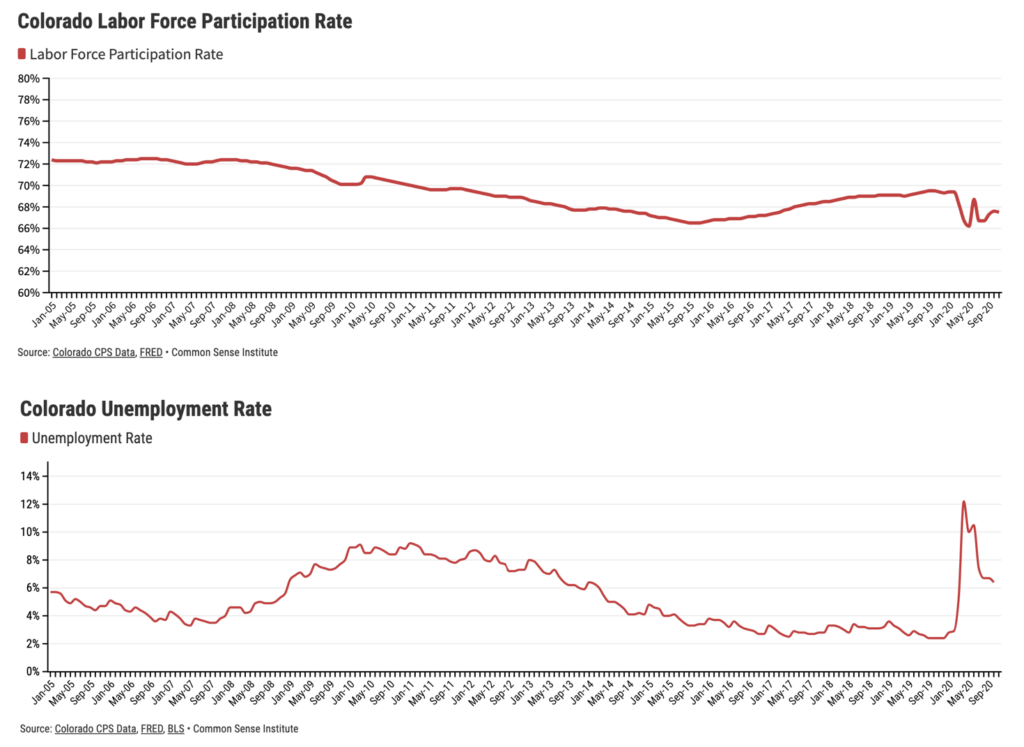
Figures 1 and 2: Labor Force Participation Rate and Unemployment Rate History – 2005 to November 2020
The LFPR and UE rates shown in Figure 1 and 2 reflect high level trends in the Colorado workforce from January of 2005 through November of 2020. The Federal Reserve Economic Data (FRED) has been reporting the data from the Current Population Survey (CPS). Here we can see the trends before and after the Great Recession in 2008 along with the COVID-19 pandemic.
The Colorado LFPR was 67.5% in November. This rate was 2 percentage points below where it was in February at 69.4%. This equates to 90,000 fewer people in the labor force as of November. The Colorado UE rate was 6.4% in November, 3.9 percentage points above the February level of 2.5%.
Labor Force Participation Rate Charts
Figures 3 and 4: Colorado and National Labor Force Participation Rate by Gender
During the pandemic Colorado’s LFPR has remained higher than the US national average, which is consistent with historic trends.
When breaking data down by gender we see different trends. The Colorado male LFPR in November was 73.5%; this was 2.4 percentage points below what it was in February. The National LFPR for men was 67.4% in October; this is 1.9 percentage points lower than in February. The LFPR for women in Colorado was 62.9% in November; this was .1 percentage points lower than in February. The National LFPR for women was 1.9 percentage points lower in November than in February. These trends suggest that as of November, the LFPR for men in Colorado were doing worse than the national average and women were doing better. 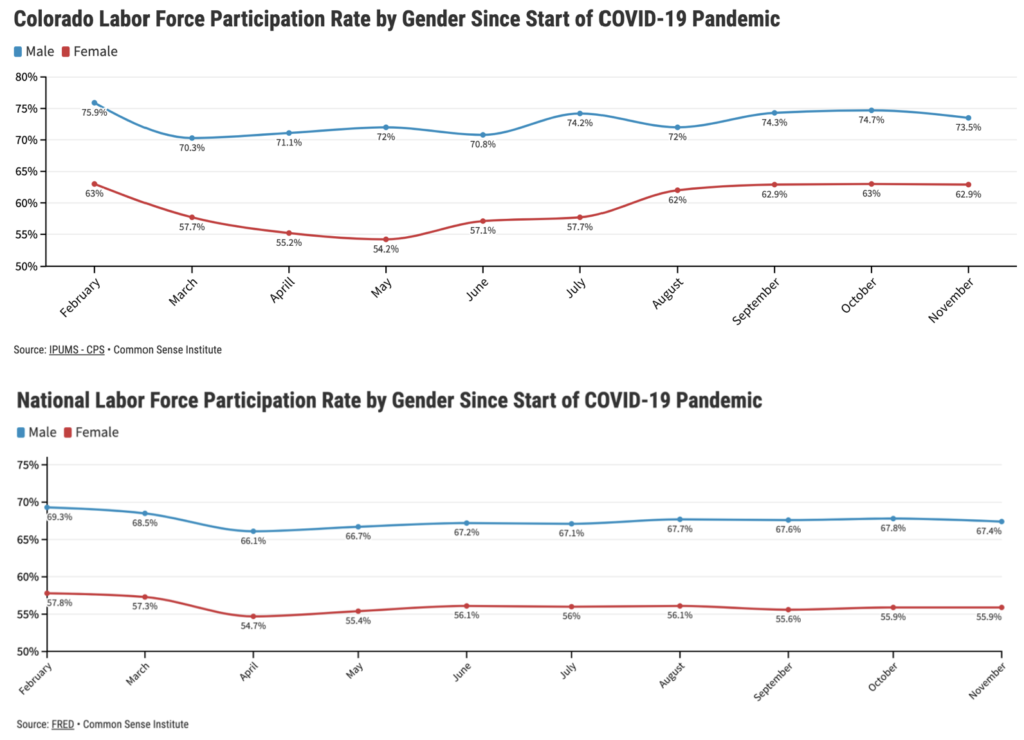
Figures 5 and 6: Colorado Labor Force Participation Rate by Age and Gender
The LFPR trends have varied across age and gender. Both men and women above 35 had lower LFPR in November when compared to February. The obverse was true for both men and women below 35 years old, as their LFPR were slightly higher in November when compared to February.
The LFPR for men above 35 years old was 2.6 percentage points less in November than February. The LFPR for women above 35 was 4.1 percentage points lower in November than February. The LFPR for men below 35 years old was 80.4%, .9 percentage points above the February level. The LFPR for women below 35 years old was 76.7%, 7.7 percentage points above the February level.
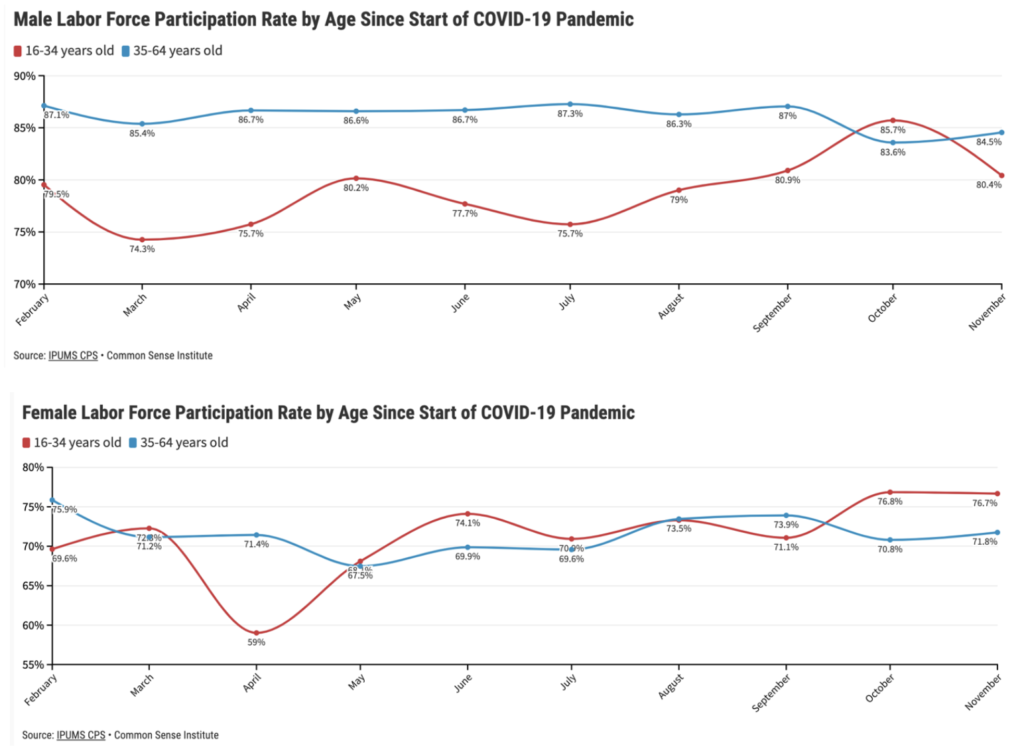
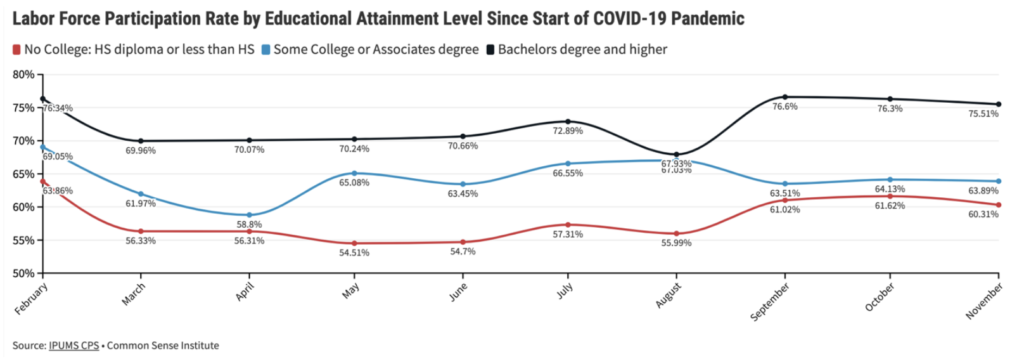
Figure 7: Colorado LFPR by Educational Attainment Level
When comparing February to November, we learn that all three educational attainment levels are below their “pre-pandemic” rates.
However, the group of bachelor’s degree and higher was only down .8 percentage points, while the groups of some college or associates degree and no college, are down 5 and 3.5 percentage points, respectively.
29% of Coloradans have a High School (HS) diploma, GED, or less. When broken down by race, of those with a HS diploma, GED, or less, 28.3% are Hispanic, 16.9% are American Indian, 13.9% Asian, and 10.2% are Black. Educational attainment inequalities have been illuminated and deepened by the economic fallout from the COVID-19 pandemic.[1]
Figures 8 and 9: Colorado LFPR by Gender, With and Without Kids
Figure 8 and 9 depict the month-to-month changes in LFPR relative to February over the last ten months whether at the state, or national level. While the national averages indicate trends which are more consistent across each group, the Colorado data shows more volatile monthly changes. However, one trend is clear and consistent between the two figures. Parents, and particularly mothers, have been impacted significantly more than the other groups. As of November 2020, the LFPR for women with kids was 8.6 percentage points below its February level of 79%, indicating 1oe in every ten mothers who was in the labor force prior to the pandemic has dropped out.
A study by the Rand Corporation found that parents with children at a more dependent stage, are more likely to leave the workforce.[2] Nicole Riehl, president of Executives Partnering to Invest in Children, said “working women with children, disproportionately women of color, are leaving the workforce in droves due to demands placed on families during this pandemic.”[3] Having to choose between employment and childcare is not easy.
Unemployment Rate Charts
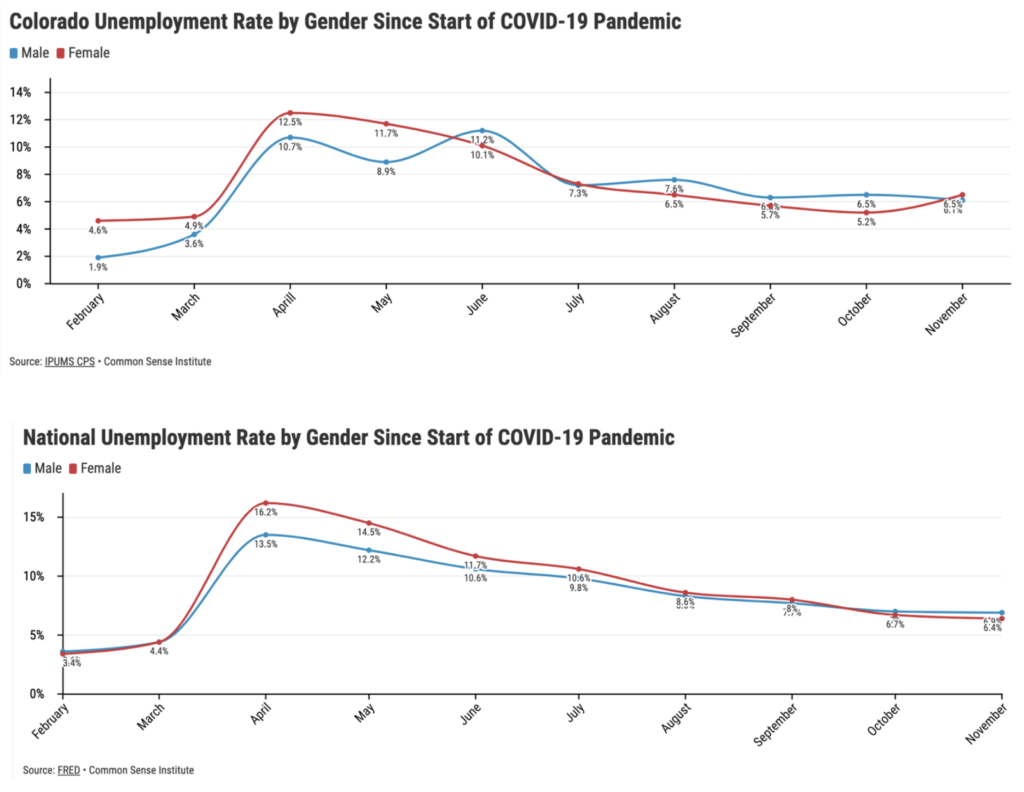
Figures 10 and 11: Colorado and National Unemployment Rates by Gender
The statewide unemployment rate has remained around 6.4% since September 2020. Yet, during the months of September through November there were significant changes to both the number of jobs and the labor force participation rate. Therefore, the UE rate remaining around 6.4% reflects the facts that each month, the number of jobs and the size of the labor force grew or fell at about the same rate, in order to keep the UE rate relatively consistent.
The data indicate that UE rates have varied slightly between men and women over time. This tells us that the working conditions are still changing within some demographic groups, in ways where the states average may not always be reflected. In the early months of the pandemic the gap in UE rates between men and women grew at both the state and national level, however the gap has remained tighter in recent months.
Figures 12 and 13: Male and Female Unemployment Rate by Age
Men and women below 35 historically have slightly higher unemployment rates than those above 35. The gap between those above and below the age of 35 increased in the early months of the pandemic however tightened through the early fall. The UE rate for men below 35 years old was 4.7 percentage points higher in November than in February, while the UE rate for Women below 35 years old was 2.4 percentage points higher in November than February.
The unemployment rate for women above 35 was below its pre-pandemic level; this reflects the large decline in labor force participation, more so than a recovery of employment. Those below the age of 35 may have higher UE levels because their LFPR did not fall and younger age groups tend to be concentrated in more service-related jobs, i.e., entertainment, food service, hospitality, and tourism, etc., as those have less educational barriers.[4] These specific industries have been more impacted by COVID-19.
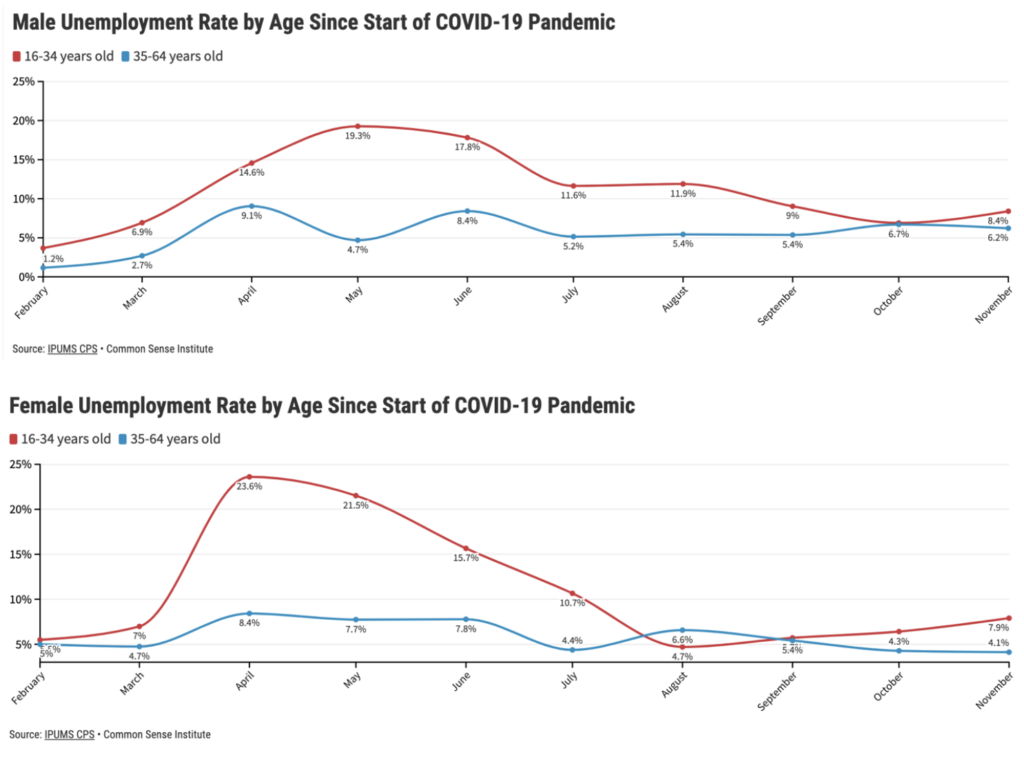
Figure 14: Unemployment Rate by Educational Attainment Level
The educational attainment level of “No College” had an UE rate of 10% in November, this was 5.7 percentage points higher than the 4% UE rate in February. The group of “Bachelor’s Degree and Higher” had an UE rate of 6.4% in November, this was 4.7 percentage points higher than the February level.
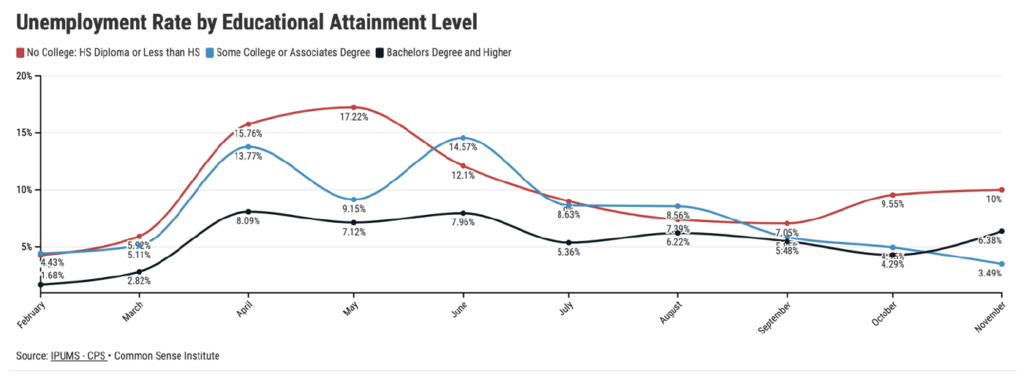
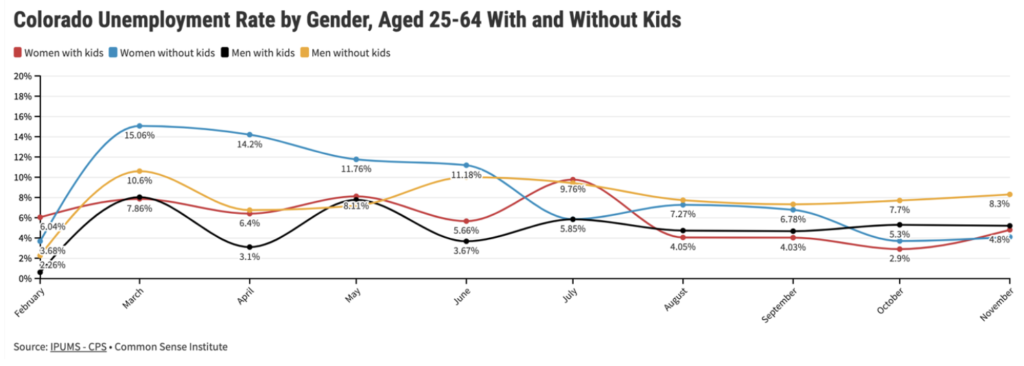
Figure 15: Unemployment Rate by Gender for With and Without Kids
Similar to the previous figures showing the changes in unemployment rates, when broken down by gender and whether or not the individual has children, the monthly data indicates recently there has been lower volatility in the UE rate than in early months of the pandemic.
The UE rate for women with kids was the only category to have a lower UE rate in November than in February. However, this reflects the significantly lower LFPR for women with kids rather than an increase in employment levels. Men without kids had an UE rate of 8.3% in November, 6 percentage points higher than the 2.3% UE rate in February. Men with kids had an UE rate of 5.2% in November, 4.6 percentage points higher than the .6% UE rate in February.
Figures 16, 17, and 18: Monthly Employment Levels
Due to social distancing restrictions, the leisure and hospitality industry has been the most impacted sector since the start of the pandemic, down 55,000 jobs in November relative to February. Leisure and Hospitality is the industry classification that includes, arts, entertainment, and recreation; accommodation; food services, and restaurants. Researchers in NYC, the COVID epicenter in early 2020, found 1.4% of COVID-19 spread was from restaurants, whereas 73.5% was through personal gatherings.[5] Relative to Colorado, the Colorado Restaurant Association finds, “restaurants employ more minority managers, and women in management and ownership positions than any other industries.”[6] Efforts to minimize the spread of the virus must be weighed against the long-term socioeconomic impacts minorities and women have experienced amid the pandemic.
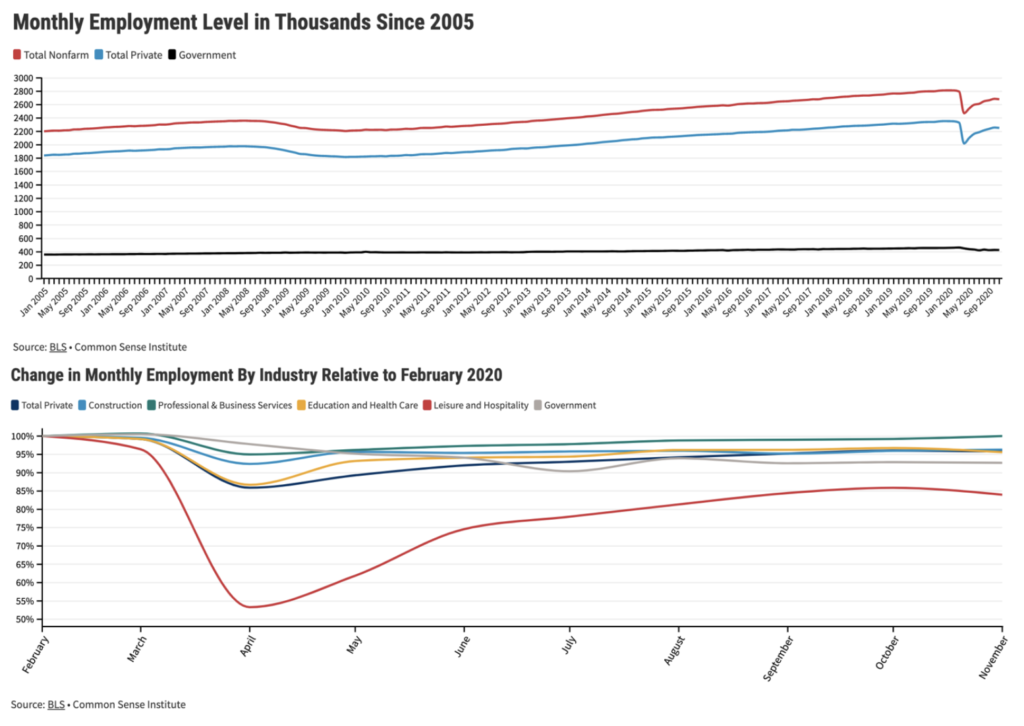
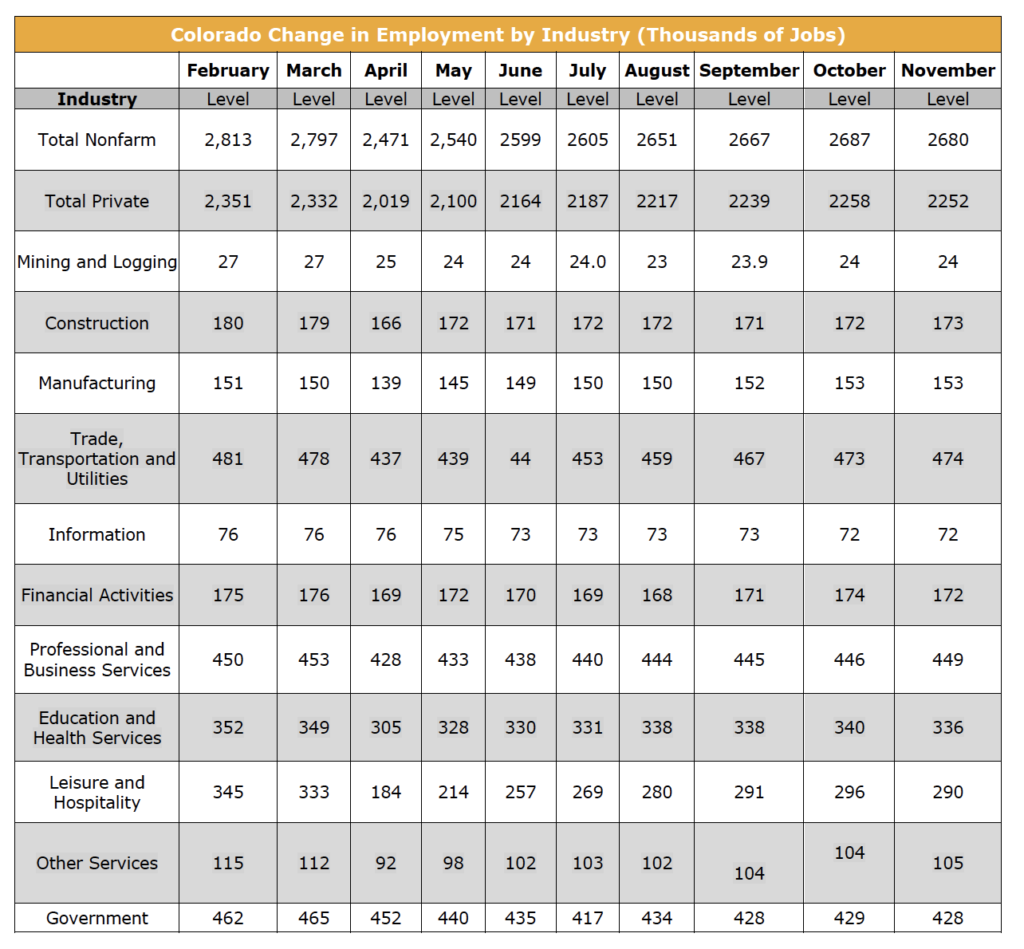
Figure 19: 2020 Average Monthly Wages in Colorado
Lower-wage jobs were disproportionately impacted during the stay-at-home order and a large number of women who left the labor force likely worked part-time. Part-time workers have fewer hours and earn a lower wage, resulting in a lower AMW.
When we look back at 2018, women in Colorado earned $789 per week, or 81.1 percent of the $973 median for men.[7] The wages of those working part-time are much lower than full-time, and nationally there are more women working part-time jobs than men.[8] From October to November, the monthly wages increased $84 for women and $434 for men, this equates to a 14% reduction in women’s earnings as a percent of men’s.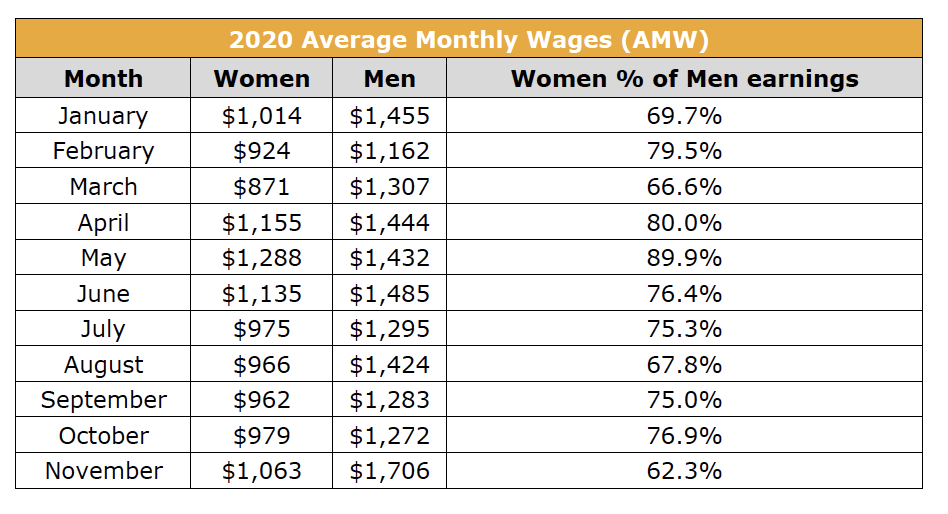
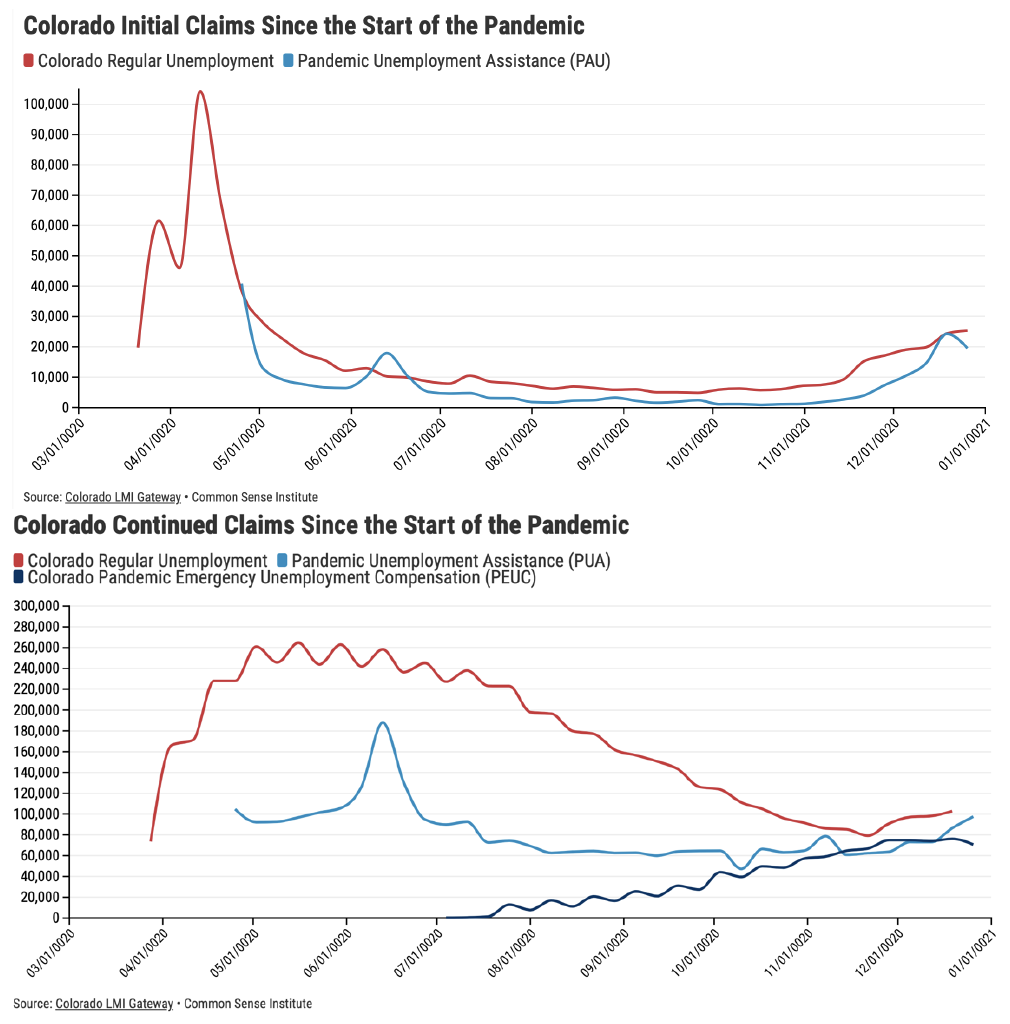
Figures 20 and 21: Colorado Initial and Continued Unemployment Insurance Claims
An initial claim is defined as the first week of consecutive unemployment benefits someone requests. A continued claim is any claim filed consecutively after week one. The pandemic unemployment assistance (PUA) is a federal program that allows states to offer benefits to self-employed people, contract workers, gig workers, etc. who aren’t eligible for standard unemployment benefits. The Pandemic Emergency Unemployment Compensation is another federal program which gives people additional weeks of unemployment benefits.
Following the April record highs, regular continued claims continued to decline up until the week of November 21st when greater social distancing restrictions began again. Total continued claims, including PUA and PEUC began to climb after the week of October 24th. Since the week of October 24th Colorado continued unemployment insurance claims grew from 200,000 to 280,000 through the week of December 19th. *Note: CDLE has indicated that new claims starting the week end of December 19th will likely be revised due to fraud.*
[1] https://www.towncharts.com/Colorado/Colorado-state-Education-data.html
[2] https://www.rand.org/blog/2020/11/women-are-leaving-the-labor-force-in-record-numbers.html
[3] https://coloradosun.com/2020/12/02/coronavirus-aid-for-child-care-centers/
[4] https://www.bls.gov/cps/cpsaat11b.htm
[5] https://ny.eater.com/2020/12/11/22169841/restaurants-and-bars-coronavirus-spread-data-new-york
[6] https://corestaurant.org/
[7] https://www.bls.gov/regions/mountain-plains/news-release/womensearnings_colorado.htm#:~:text=In%202018%2C%20Colorado%20women%20who,of%20Labor%20Statistics%20reported%20today.
[8] https://www.bls.gov/opub/reports/womens-databook/2019/home.htm#:~:text=In%202018%2C%2024%20percent%20of,worked%20part%20time%20in%202018.
While the most severe shocks brought on by COVID-19 ended several months ago the lasting impacts are still being felt across the Colorado economy and labor force. This report focuses on the impacts of COVID-19 upon the Colorado labor force and overall economic health of the state.
The following series of charts show the impact of policies in response to COVID-19 on Colorado’s economy from February, the full month prior to Colorado’s stay-at-home order, through the September, the most current month of data. The figures include labor force participation rates, unemployment rates, employment levels, unemployment insurance claims, and new business formation. The data used in this report is sourced from the U.S. Bureau of Labor Statistics (BLS), U.S. Census Bureau (CENSUS), U.S. Department of Labor, and the Integrated Public Use Microdata Series – Consumer Population Survey (IPUMS – CPS).
Key Findings and Trends:
Colorado Labor Force
- The September statewide labor force participation rate (LFPR) stood at 67.9%, 1.5 percentage points below the February level. This translates to 39,000 fewer people in the Colorado labor force now, than there were in February. Prior to the pandemic the Colorado LFPR had been trending upwards since the end of 2015.
- From August to September the overall female labor force grew by 21,000 compared to 52,000 for the male labor force. However, compared to February the number of women in the labor force in September was approximately 2,000 below the February level. Over the same period the male labor force increased by 37,800.
- The gap in the LFPR between men and women with kids was 14% in February. In September, the gap grew to 19%, the difference between a 93% LFPR for men with kids and a 74% LFPR for women with kids.
- Women with kids are still being disproportionately impacted. The LFPR in September for women with kids was 5.05 percentage points below its February rate of 79.8%. The LFPR for women without kids, men with kids, and men without kids were each above their February rate.
- From February to September, 42,000 women with kids left the labor force and have not yet re-entered; in contrast, 40,000 women without kids have entered the labor force from February to September.
- Men of all ages saw a slight increase in their labor force participation rate from August to September, however the LFPR for men above 35 was 3% below its February rate.
- The LFPR for females above 35 was 4.8 percentage points below its February level and the rate for females 35 and below was 1.44 percentage points above its February rate.
- From April through June, there was a significant spike in women’s earnings as a percent of male earnings. This is likely attributed to the large number of women who left the labor force who likely worked part-time, and therefore also had a lower weekly wage, rather than in actual increase in wages.
Colorado Unemployment Rate
- The Colorado unemployment rate (UE) dropped from 6.7% in August to 6.4% in September, as the number of jobs increased slightly faster than the growth in the labor force.
- The Colorado unemployment rate by gender trended down from August to September for both males and females.
- Between August and September, the male unemployment rate dropped from 7.6% to 6.2%. Specifically, men below 35 years old saw a 2.86 percentage point decrease in the unemployment rate, a drop from 11.9% to 9%, while the UE rate for men over 35 only dropped by .5 percentage points.
- The UE rate for females below 35 increased slightly, whereas the UE rate for women older than 35 decreased by 2 percentage points.
- The UE rate for each level of education dropped significantly; the UE rate for the group of some college or Associates degree declined by 3 percentage points.
Economic Health of Colorado
-
- Initial unemployment insurance claims reached 104,000 in early April, and since then have decreased alongside the pandemic unemployment assistance claims.
- Weekly continued regular unemployment insurance claims were well over 220,000 between late April to early August. As of the week ending October 3rd, there were at 127,000 regular continued claims.
- Over 683,355 business applications were filed nationally from Q2 to Q3 of 2020, with 9,663, or 1.4%, of those filed in Colorado.
- Nationally there was an 82.8% increase in business applications from Q3 of 2019 to Q3 of 2020.
- Between Q3 of 2019 and Q3 of 2020, there was a 40% increase in business applications in Colorado.
The impacts of COVID-19 have disproportionately impacted some parts of our economy more than others. While the impacts on employment are most often highlighted, this brief summarizes the impacts on different groups within the state’s labor force.
The following series of charts show the impacts of policies in response to COVID-19 on the Colorado labor force from February through August 2020. February is included to reflect the month prior to the start of the pandemic. The monthly data are collected and reported by the US Bureau of Labor Statistics (BLS) and the Integrated Public Use Microdata Series – Consumer Population Survey (IPUMS – CPS) which is further broken down by: Gender, Age, Educational Attainment, and Both Genders With and Without Kids.
Key Findings and Trends:
Colorado Labor Force
- The statewide labor force participation rate (LFPR) in August was 66.7%, which is still 2.3 percentage points below the February pre-pandemic level of 69%. The LFPR fell to a low 66.2% of in May(Figure 1).
- The LFPR for women with kids has decreased 6 percentage points from February to August, whereas the LFPR for women without kids has increased 6%. In total since February, 6,800 women without kids have entered the labor force, and 30,200 women with kids have left the labor force.
- Compared to the national level, the Colorado’s female LFPR fell significantly more during the early months of the pandemic. However, as of August both the national female LFPR and the Colorado female LFPR were 1 percentage point below their respective February levels. (Figures 3 and 5).
- The LFPR for men with kids decreased by 3.7 percentage points from July to August. However, their LFPR has remained consistently higher than women with kids, remaining 18 percentage points higher in August at 91.1% (Figure 13).
- The data suggests when comparing February to August, in Colorado, 89,823 men have left the labor force and 23,359 females have left the labor force. However, there are still 193,165 more men than women in the labor force according to August numbers (Figures 1 and 3).
Colorado Unemployment Rate and Jobs
- In 2020, the Colorado unemployment rate (UE) peaked in June at 11%. Since then it has been trending down, and as of August it stood at 7% (Figure 2).
- The August male UE rate is up from last month to 7.64% whereas the female overall UE rate dropped to 6.52% (Figure 4).
- The total number of jobs in Colorado in August climbed 1 percentage point to 94% of the level of jobs in February. Only manufacturing jobs have returned to their pre-pandemic level.
i. https://www.bls.gov/news.release/pdf/famee.pdf
The impacts of COVID-19 have disproportionately impacted some parts of our economy more than others. While the impacts on employment are most often highlighted, this brief summarizes the impacts on different groups within the state’s labor force.
The following series of charts show the impacts of policies in response to COVID-19 on the Colorado labor force from February through July 2020. February is included to reflect the month prior to the start of the pandemic. The monthly data collected and reported by the US Bureau of Labor Statistics (BLS) is broken down by: Gender, Age, and Educational Attainment.
Key Findings and Trends:
Colorado Labor Force
-
-
- Despite three months of consecutive job gains, statewide labor force participation rate (LFPR) took a sharp downward turn in Colorado during July after seeing two months of increases (Figure 1). The US LFPR showed a similar reversal in July, though not as sharp.
- This release includes a new chart that provides additional evidence that women, and particularly women with children, are being disproportionately impacted. The LFPR for women with kids fell from 79.8% to 71.8% from February to July in Colorado. The LFPR for women without kids is only one percentage point below its February level, after recovering from the May low of 66.28%. The groups of men with kids and men without kids, both have higher LFPR’s in July than they did in February (Figure 13). This could be evidence that the costs associated with childcare, averaging $15,325 annually in the US[1], along with parental demands of remote learning in schools, are influencing more mothers to remove themselves from the labor force.
- The LFPR for those with an education attainment of a high school degree or lower is 6 percentage points lower than its February level. This group remains further from its February peak than those with higher forms of education (Figure 11).
-
Colorado Unemployment Rate and Jobs
-
-
- The unemployment rate in Colorado stands at 7.4%, which is well below the previous April high of 12.2% (Figure 2). While this is encouraging, the large decline in the rate in July was primarily driven by the large drop in the labor force participation rate, rather than the growth in jobs. If the LFPR rate in July, would have been the same as it was in February, then the current unemployment rate would be 11.15%, nearly 4 percentage points higher than the current official rate.
- 50% of all private sector jobs that were lost from February to April have returned. However, government employment, which generally lags in reflecting the effects of a recession, continues to decline. In July government employment suffered the worse reduction since the start of the pandemic, due to a reduction of 17,000 state jobs. Therefore, while private sector employment increase by 23,000 jobs in July, the net increase in total non-farm jobs was 6,200 (Figure 16).
- The drop was from February’s LFPR of 63% to July’s LFPR of 57.7% resulted in 123,572 women dropping out of the labor force and not currently looking for work.
- Men saw a slight decrease in their LFPR from February’s 75.94% to July’s 74.17% with a total of 40,124 men dropping out of the labor force.
-
1 https://www.epi.org/child-care-costs-in-the-united-states/
The impacts of COVID-19 have disproportionately impacted some parts of our economy more than others. Restaurants, cafes, large event venues, hotels, and other recreational activities have been severely impacted, with job losses that remain over 20%. This stands in contrast to the information and manufacturing sectors which are just 2% below their February level of employment.
Key Findings:
-
-
- Overall labor force participation increased in June, from 66.6% to 68.7%.
- The jump in overall labor force participation was driven by a substantial increase in participation from women under the age of 35, from 68.1% to 74.11%.
- Coloradans with some college or an associate degree, saw an increase in unemployment by 5.42%, despite seeing a decline in labor force participation of 1.63%.
- The June jobs report for Colorado indicated 55,000 jobs were added in June.
- Nationally labor force participation rate for women in June remain as low as the 1980s. The LFPR for women peaked in 2009 and never fully rebounded post-recession.
-
The impacts of COVID-19 have not been equally felt across the labor market and certain business models have been disrupted significantly more than others. As expected, restaurants, large event venues, hotels and other personal services have been severely impacted.
This range in impacts across industries, is also reflected in changes across different groups within the labor market. Women and those with education levels lower than a college degree have been disproportionately negatively impacted.
The following series of charts show the impacts of COVID-19 on the Colorado labor force between February and May 2020, reflecting the month prior to the start of the pandemic and the latest available monthly data broken down into: Gender, Age, and Educational Attainment.
Key Findings:
-
-
- From February 2020 to May 2020, 267,000 Coloradans dropped out of the labor force, as the labor force participation rate dropped from 69.4% to 63.6%. This includes 88,000 men and 179,000 women.
- One of the largest drops in the labor force was seen in women over the age of 35, with this group experiencing a decline of nearly 8% participation dropping from 63% to 55.3%. This is more than double the decline in the same age category for men.
- The drop in the female LFPR, from 63% to 55% suggests that 178,700 women have dropped out of the labor force and are not currently looking for work. For males, the drop from 76% to 72% indicates 88,000 males dropped out of the labor force.
- Coloradans with no college degree, including those with a high school diploma or those who did not graduate high school, saw unemployment rate grow from 4.3% to 17.2%.
- Current unemployment rates don’t fully reflect the recent labor market disruptions. If labor force participation rates in May had stayed at the same level as February, then the May unemployment rate would be closer to 18%. By gender it would be 22% for female and 14% for male.
-