

About the Authors
Chris Brown is the Director of Policy and Research with Common Sense Institute where he leads the research efforts of CSI to provide insightful, accurate and actionable information on the implications of public policy issues throughout the state of Colorado.
Erik Gamm is the Research Analyst with Common Sense Institute where he supports the research efforts of CSI. Erik recently graduated from the University of Michigan in 2020 with a Bachelor of Arts in Economics.
About Common Sense Institute
Common Sense Institute is a non-partisan research organization dedicated to the protection and promotion of Colorado’s economy. CSI is at the forefront of important discussions concerning the future of free enterprise in Colorado and aims to have an impact on the issues that matter most to Coloradans.
CSI’s mission is to examine the fiscal impacts of policies, initiatives, and proposed laws so that Coloradans are educated and informed on issues impacting their lives. CSI employs rigorous research techniques and dynamic modeling to evaluate the potential impact of these measures on the Colorado economy and individual opportunity.
Common Sense Institute was founded in 2010 originally as Common Sense Policy Roundtable. CSI’s founders were a concerned group of business and community leaders who observed that divisive partisanship was overwhelming policymaking and believed that sound economic analysis could help Coloradans make fact-based and common sense decisions.
Key Findings
-
- Proposition 116, “State Income Tax Rate Reduction,” proposes to reduce Colorado’s flat income tax rate, which applies to individuals and businesses, from 4.63% to 4.55%. In its first full year effective, it will decrease state tax revenues by almost $160m—1.7% of total projected collections.
- Dynamic economic and state fiscal impact modeling demonstrates that the true impact of the tax cut will depend upon the extent to which the state government manages a tighter budget by reduction the growth in government jobs. Two scenarios developed in the REMI Tax-PI model suggest that, over the first five years:
-
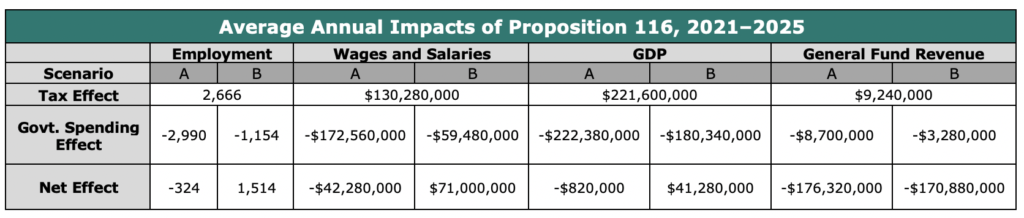
- The private sector in Colorado will add on average between 896 and 1,384 jobs. Depending upon the public sector’s response, the net employment impact will on average be a reduction of up to 324 jobs or an addition of up to 1,514, after accounting for reductions in government employment growth.
- By year 5, Colorado GDP will have grown between $8.1m and $55.5m above the baseline projection.
- On average, yearly state government revenue will fall between $170.9m and $176.3m relative to the baseline projection.
- There will be a crucial trade-off between the economic benefits of increasing private saving and the detriments of constricting state government output.
-
- The relative loss of revenue that the state faces in the first full year of the cut amounts to about 1.2% of its FY22 general fund balance. The static revenue reduction amounts to a change in the projected FY22 income tax revenue to the General Fund growth from 20% to 17.9%.
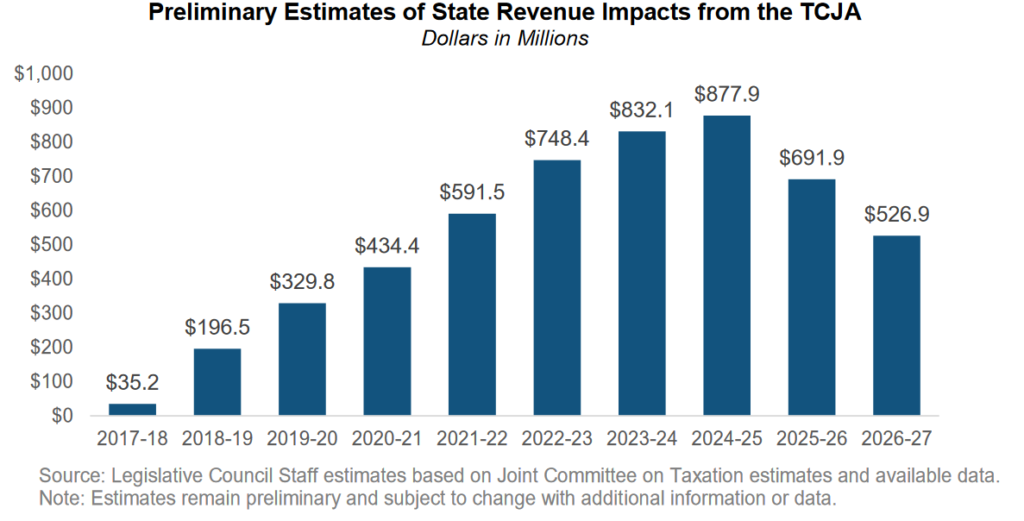
- The Tax Cuts and Jobs Act (TJCA) of 2017, a federal tax cut, expanded the states’ tax bases and limited some state deductions, so Colorado’s income tax collection is on the rise beyond baseline projections in the near term. The state projected in its early estimates to collect, on average, an additional $505.7m per year from FY18 to FY25.
- Generally, passage of Proposition 116 will ease some of the hardship the recession has caused the private sector and magnify some of the strain it’s caused the public sector.
Executive Summary
The recession which followed the onset of the COVID-19 pandemic early this year has in its course compelled policymakers on all strata of the political process to develop solutions to the hardship it’s caused workers and small businesses and to re-examine policies and proposals developed before it began. One area of especial interest to those concerned has been tax policy; governments stand to lose revenue, and many individuals have lost, temporarily or permanently, their sources of income. In Colorado, competing visions of the proper ways to address the political dilemma this creates have permeated the discourses about two proposed ballot initiatives aimed at changing the state’s income tax code.
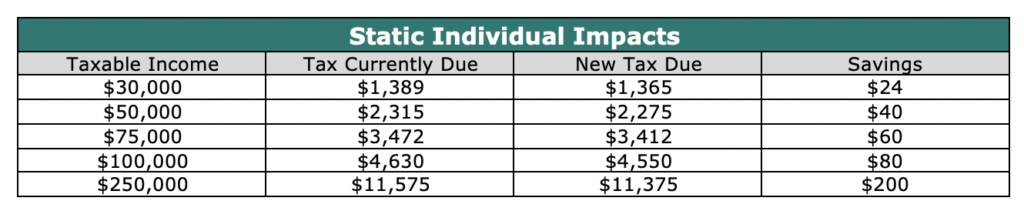
One of these, Proposition 116, which would reduce the state income tax rate from 4.63% to 4.55%, will be included on the 2020 general election ballot. Initiative #271, which would have established a progressive income tax system, failed to qualify for the ballot. The magnitude of this tax cut, according to the proposition’s fiscal impact statement,i will be about 1.7% (some $160m) of total 2019 income tax collections in its first full year effective; between 2018 and 2019, income tax collections grew just over 8%.ii For every additional $10,000 of taxable income earned, an individual or business will save $8 in income tax under the new rate. An individual who earns $50,000 annually will save $40.
Proposition 116, if passed, will have the effects of reducing state revenue and adding private-sector wealth. In this report, CSI uses dynamic modeling software developed by REMI to estimate the magnitudes of these impacts and establish a range in which they will likely fall. This range is constructed by considering two scenarios. In scenario A, the Colorado government cuts its employment to account for the reduction in its revenue; in scenario B, the state government does not cut any jobs and instead constricts spending elsewhere. A summary of the modeling’s results appears in the table directly below.
Proposition 116’s sponsors hail its potential to alleviate some of the financial strain the current recession has placed upon Coloradoans and their businesses, and its detractors worry that the government spending cuts it would necessitate will harm vulnerable people who utilize state government services. In this report, CSI outlines the details of the measures and projects the impacts it could have across the Colorado economy upon both the private sector and the state.
Proposition 116 Background
Current Income Tax Structure in Colorado
Most states have progressive income tax codes and seven do not tax income at all; Colorado is one of nine states which apply a flat income tax rate to residents at all income levels. The effect of Proposition 116, if passed, would be to reduce Colorado’s current flat rate of 4.63% to 4.55%. The current rate has been effective since 2000, before which it dropped from its original 5% level.iii The income tax regulation in Colorado is inclusive of individual, corporate, fiduciary, and partnership income; this will remain true if Proposition 116 passes.
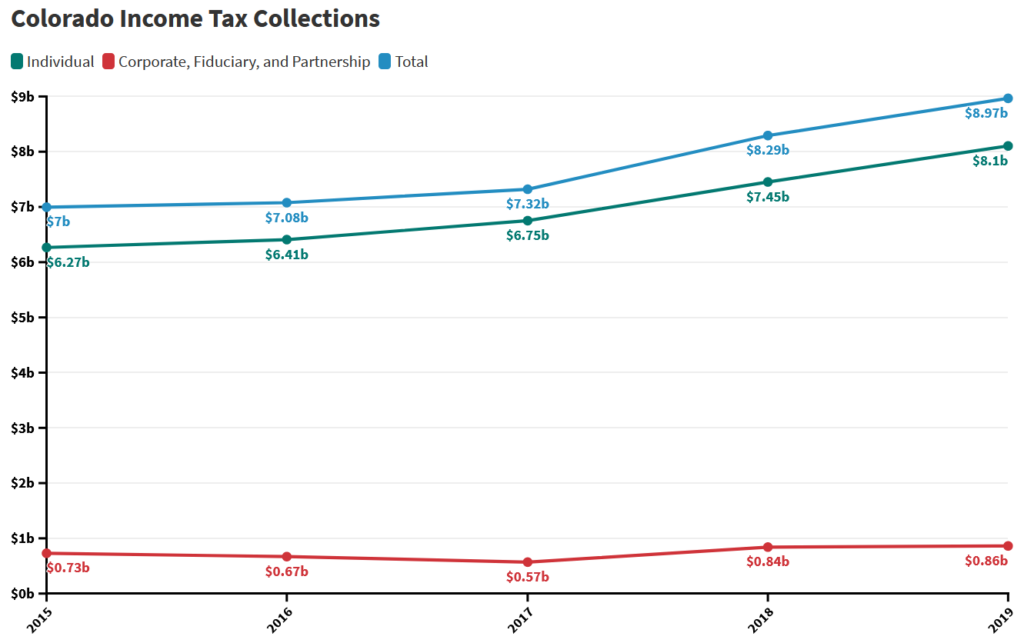
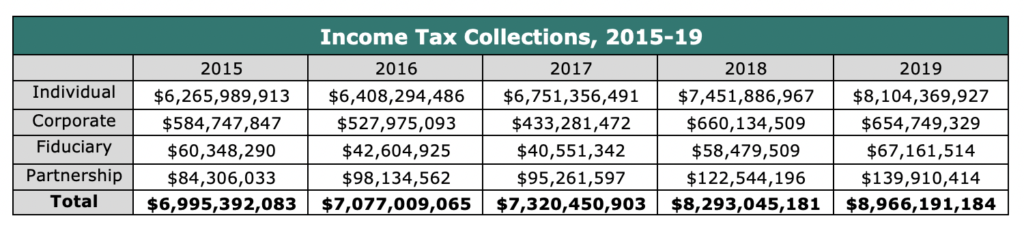
Income tax collection is managed by the Colorado Department of Revenue, which annually publishes tax revenue data. Below is the latest five-year history of total collections.iv
 Recent Income Tax Changes
Though Colorado has not altered its income taxation formula recently, the national Tax Cuts and Jobs Act of 2017 (TCJA) made several changes to the tax code which have affected the amounts Coloradoans pay in income taxes and the amount Colorado’s government collects in income taxes.v The TCJA decreased federal tax rates and expanded some deductions such that most Colorado taxpayers owe less in total than they did previously. However, it also closed or limited several state-and-local–level deductions resulting in higher revenue for some states including Colorado. March 2018 estimates from the Colorado Legislative Council Staff of the additional revenue to be collected are $35m in the first year, $878m in FY25, and somewhat lower thereafter due to expiration of most of TCJA’s provisions.vi
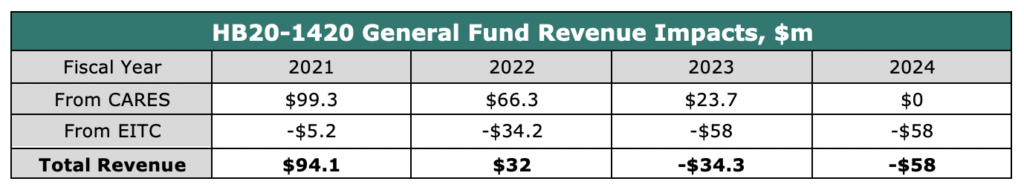
Colorado’s income tax rate has not changed, but some recent legislation will impact the amount of income tax that Coloradoans pay. House Bill 20-1420, signed into law in July of this year, broadens the corporate and business tax base by reversing some of the tax cuts from the CARES Act, and expands the state Earned Income Tax Credit (EITC). It is projected to increase state revenues in its first two years of action, due to the CARES Act rollbacks, and decrease them on a continuing basis thereafter, due to its expansion of the EITC.vii
 A Brief Introduction to Dynamic Scoring
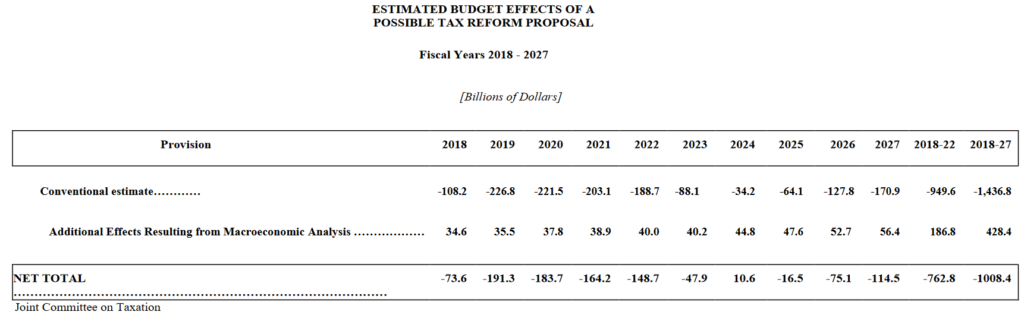
Dynamic scoring is an approach to tax-policy–modeling which, beyond simply producing static results, intentionally considers the indirect impacts upon individuals and businesses that changes to tax policy have. When deployed to assess tax rate changes, it estimates the economic growth potential of tax-cutting and the constrictive effects tax increases have upon consumer behavior. For example, the Joint Committee on Taxation’s analysis of the TCJA found that the law’s adverse static budget effects will be mitigated considerably by dynamic trends caused by the cut’s acceleration of economic growth.viii An important note about the difference between dynamic scoring at the state and federal levels is the condition of a balanced budget requirement. Since each state effectively operates under a balanced budget constraint, because they cannot borrow in the same way the federal government can, state revenue reductions have offsetting economic effects not reflected in national models.
Naturally, different models produce different dynamic results; a study of the same law published by Penn Wharton assumes a modest annual growth effect between .03% and .08%,ix while a Tax Foundation analysis predicts that growth will average .32%.x Discrepancies like these may cause some to be skeptical about the applicability of dynamic scoring—critics note that modelers’ various assumptions can produce disparate results. Nevertheless, the irreplaceable detail of analysis that dynamic scoring can offer safeguards its reputation among analytical economists, leading the Congressional Budget Office to formalize their dynamic scoring criteria in 2015.xi
Static Impacts
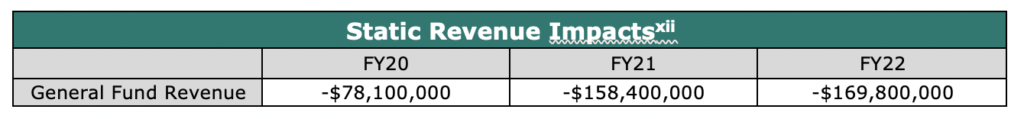
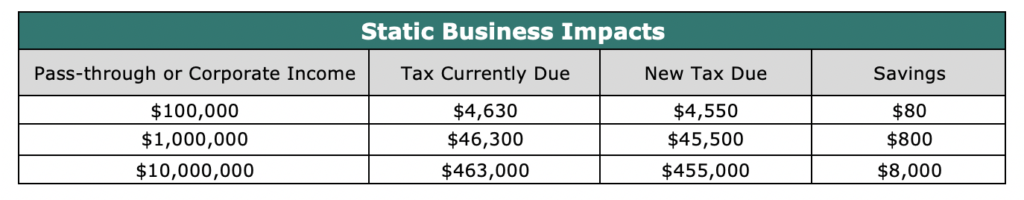
The Colorado Legislative Council Staff, as outlined in a January memo, “does not conduct dynamic modeling, which means that [ballot measure] fiscal notes and other analyses are limited to the scope of legislation’s direct impacts.”xii Thus, the state’s estimates of Proposition 116’s fiscal impact were generated without consideration of the tax cut’s potential to alter the behaviors of actors within the Colorado economy and without. Below are reported the static fiscal impacts of Proposition 116 upon state revenue as they appear in the measure’s most recent fiscal impact statement,xii alongside some basic internal calculations of the effects that passage of the measure will have upon personal and business savings.
Static Revenue Impacts
Naturally, the static impact of an income tax cut is a loss of state revenue. In FY2022, the most distant year which Proposition 116’s fiscal analysis projects, this impact is a loss just shy of $170m.
 Individual Tax Relief
Individuals who pay income tax will, should Proposition 116 pass, be made to pay less of it. Since the measure changes nothing about the Colorado tax code save the income tax rate itself, simple calculations suffice to demonstrate that a resident earning $100,000 of taxable income in a filing year will pay $80 less than s/he would adherent to current law.
 Business Tax Relief
In Colorado, income tax on corporate earnings is also assessed at a rate of 4.63%. Though its effect upon business taxes is not explicitly addressed in its fiscal impact statement, Proposition 116 would reduce the corporate rate to 4.55%, just as it does the individual. Corporations subject to the Colorado corporate income tax payed $654,749,329 in 2019; this amounted to 7.3% of total state income tax collections.iv
Some businesses do not pay corporate income tax; rather, their owners pay income tax on their firms’ earnings as though they are personal income. According to an estimate by Ernst & Young, these pass-through entities paid $900,000,000 (about 12% of the state income tax total collections) of Colorado income tax in 2018. xiv Naturally, these businesses (mostly small) will receive the same level of tax cut as individuals and corporations after passage of Proposition 116.
 In the context of the ongoing recession, Proposition 116 represents a potential small amount of additional relief for struggling Colorado businesses. A larger and more-targeted aid initiative deployed similarly was the Paycheck Protection Program administered by the U.S. Small Business Administration; this offered loans, with loan forgiveness provisions, to qualifying small businesses which would otherwise be unable to keep employees on their payrolls due to pandemic restrictions or strains. xv Now that this program has been terminated, proponents of Proposition 116 suggest that a tax break for Colorado businesses could give some the advantages they require to retain workers or stay open.
Dynamic Impacts
Overview of REMi Modeling Sequence
To estimate the dynamic impacts of Proposition 116, several simulations were run using the REMI Tax-PI model. The Tax-PI model inputs were developed using the static revenue estimates from the proposition’s fiscal impact statement, adjusted for years after FY22 using REMI’s forecast of personal income growth, and shared across business costs and personal taxes. The share of the total fiscal impact estimated to reduce business costs, reflects both a lower corporate tax rate and lower taxes for business related pass-through income. The shares were developed using Colorado Department of Revenue collections data and estimates by Ernst and Young of the share of total Colorado income tax paid by businesses in 2018.xii
The modeling results follow a framework informed by the logic of the following economic relationship between tax policy and several macroeconomic indicators:
- Tax cuts – Tax cuts stimulate growth by enriching private individuals and thus increase tax revenues somewhat,
- Spending reductions – The static impact of the cuts upon state tax collections overwhelms that positive revenue effect and produces a small adverse growth effect, and
- Total or net impacts – Under condition of a balanced state budget, the net effects are reflected by the sums of all aforementioned impacts.
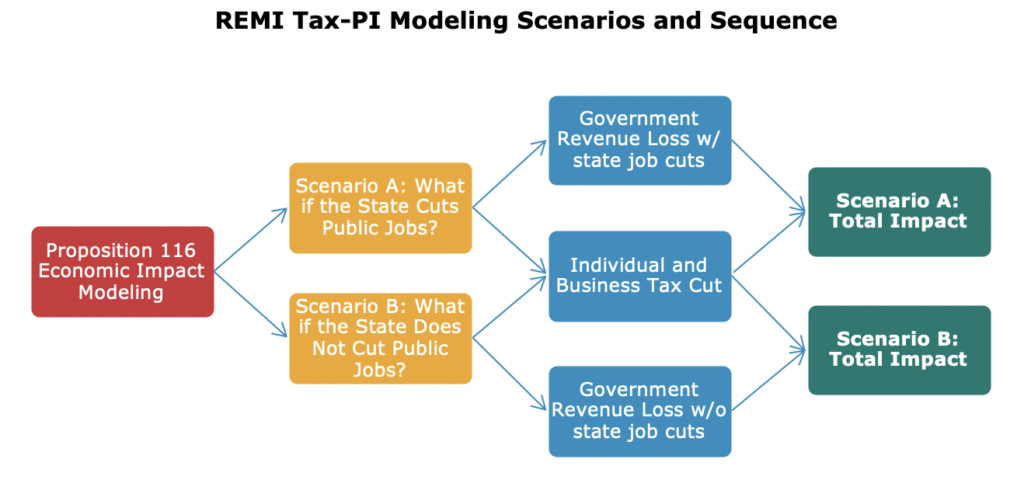
CSI used the REMI model to construct two scenarios which together estimate the range of impacts Proposition 116 will have upon Colorado’s economy. Both scenarios take the same inputs but are configured to differently reflect the ways by which the state government might handle tax revenue decreases. Scenario A is developed according to an assumption that the state government will cut some public jobs in order to reduce its costs compensatorily, and Scenario B results from assuming that the state government will cut none of its own jobs or any of its workers’ salaries and instead contract elsewise.
 Tax Cuts: Economic Impacts of the Tax Cut Alone
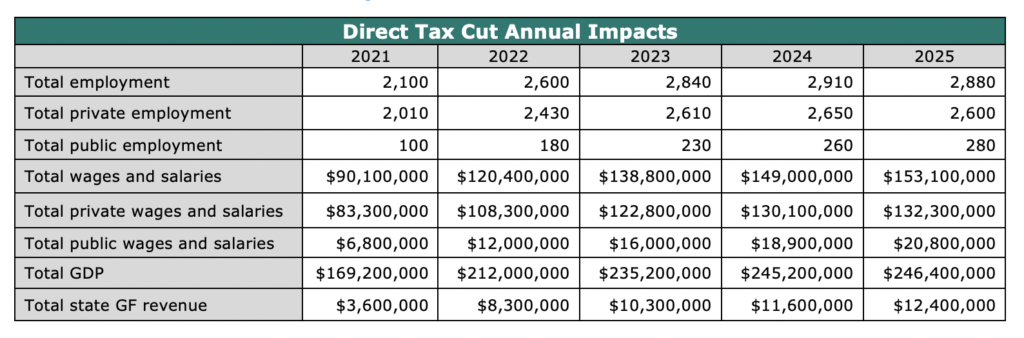 The above set of results examines only the impacts that lower tax payments from taxpayers will have upon the economy. These impacts, which are necessarily and exclusively positive, are caused by the presumptive behaviors of individuals within the economy who retain more wealth available to spend or save.
Spending Reductions: Economic Impacts of Reduced State Government Spending Alone
Scenario A: State Spending Reductions with Direct Reductions in State Employment
 Scenario B: State Spending Reductions without Direct Reductions in State Employment
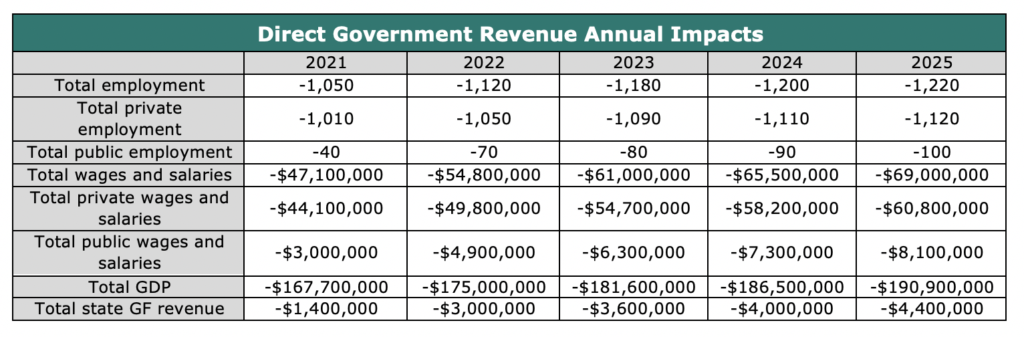
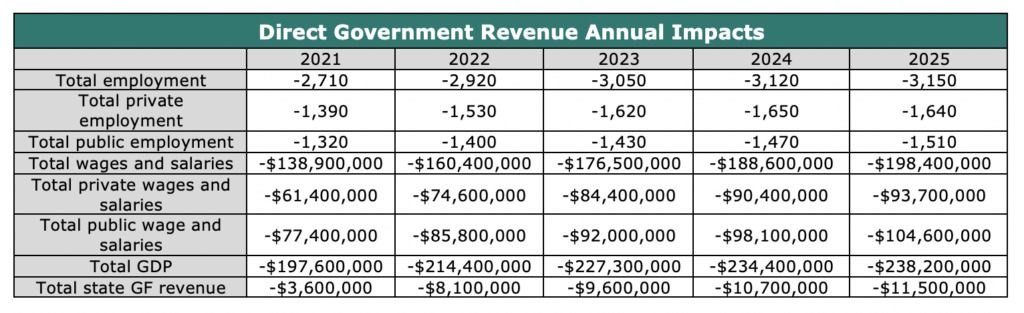
The two tables above show the modeling estimates in which the constrictive effects of reducing government revenues are isolated. A government with less to spend, all else equal, will spend less and invest less in the economy and cause it to contract. This module was constructed in consideration of both Proposition 116’s fiscal impact statement’s static projections and the dynamic state revenue increase effects of the process established in the prior step.
Total or net Impacts: Total Combined Economic Impacts of Tax Cuts and Government Spending Reductions
Scenario A: Tax Cuts Combined with State Spending Reductions with Direct Reductions in State Employment
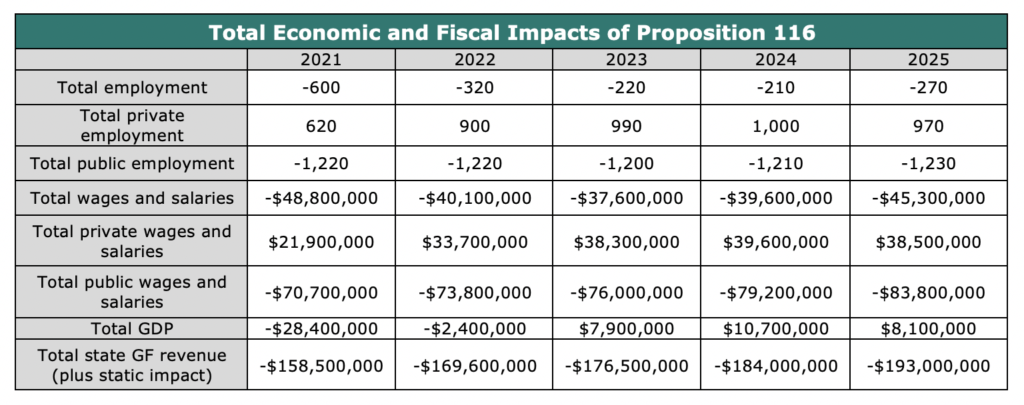
Scenario B: Tax Cuts Combined with State Spending Reductions without Direct Reductions in State Employment
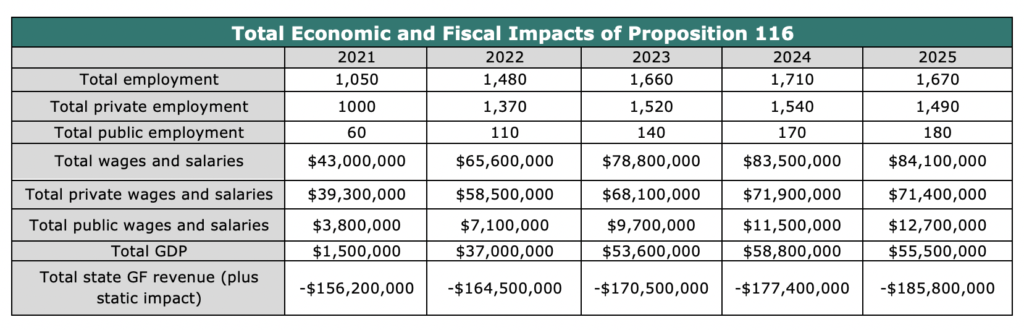
The previous two tables show Tax-PI model simulation results in which, for each scenario, the modeling inputs of the tax cuts and spending reductions are combined. Thus, they display the whole of Proposition 116’s economic impact and fiscal impact. The results suggest that, although the reduction in state spending will dampen the positive impacts upon the private sector, total private sector employment, wages, and output remain positively-impacted. The measure’s true effect will depend mightily upon the manner in which the state government chooses to reduce spending.
Conclusion
Proposition 116 will appear before Colorado voters during a time of economic uncertainty and recent budgetary upheaval. Though it was crafted before the first outbreaks of COVID-19, its impacts will be considered in the context of the recession brought on by the reactions to the pandemic. Given the permanence of the tax cuts, voters should also consider the longer-term implications, since current economic forecasts anticipate fairly rapid recovery over the next several years.
Though the static fiscal estimates provide good insights into the relative size of the change in tax revenue, the dynamic economic modeling described in this report should help to better understand how the static changes will ripple through the economy more broadly. As may be intuitive to some, the private sector experiences economic growth when its actors, private households and employers, retain more of their wealth. While some of this growth helps to partially offset the static estimates of the spending reductions required to balance the budget, reductions in state spending are still needed. The results presented in this report should help Colorado voters understand the tradeoffs the state faces when they decide the outcome of Proposition 116 come November.
Appendix A
Tax-PI Overview
The REMI Tax-PI model is a combined economic, demographic, and fiscal model within a Windows-based software package. It performs economic impacts, demographic analysis, and the dynamic scoring of state budgets at the regional level. Perhaps the most significant characteristic of Tax-PI is its tying of these analytical factors together in a consistent framework. Tax policy influences the economy, which, in turn, influences tax revenues and state expenditures in the medium- and long-term and the location decisions of households, labor, businesses, and investment opportunities.
It integrates input-output, computable general equilibrium, econometric and economic geography methodologies. The model is dynamic, with forecasts and simulations generated on an annual basis and behavioral responses to compensation, price, and other economic factors.
The model consists of thousands of simultaneous equations with a structure that is relatively straightforward. The exact number of equations used varies depending on the extent of industry, demographic, demand, and other detail in the specific model being used. The overall structure of the model can be summarized in five major blocks: (1) Output and Demand, (2) Labor and Capital Demand, (3) Population and Labor Supply, (4) Compensation, Prices, and Costs, and (5) Market Shares. The blocks and their key interactions are shown in Figures 1 and 2.
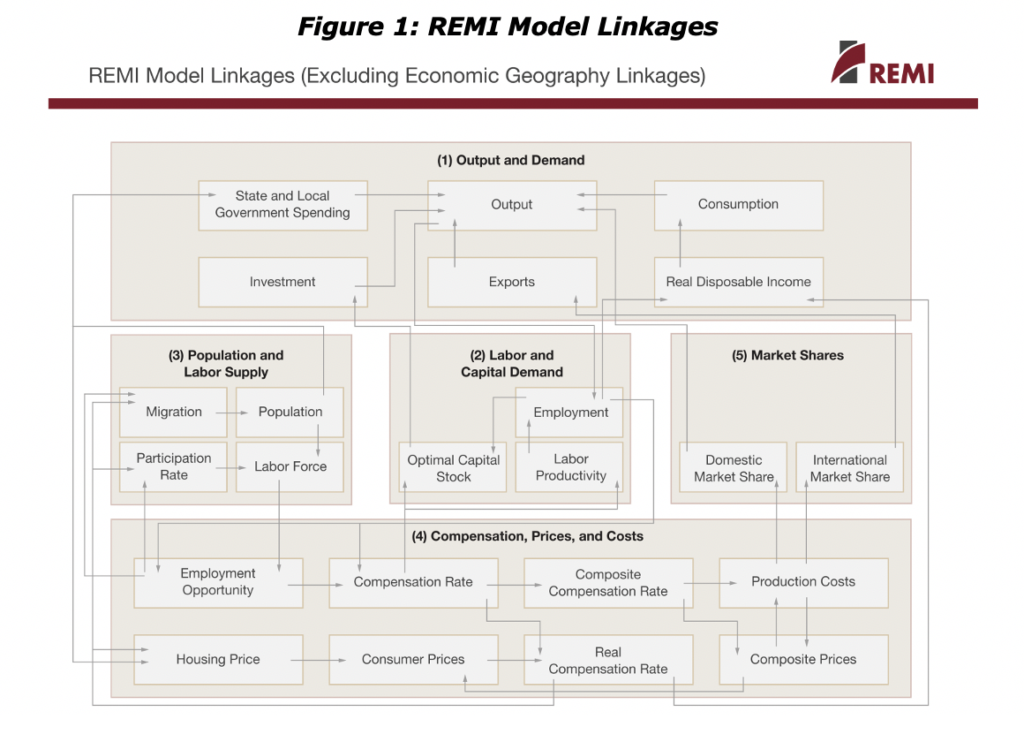
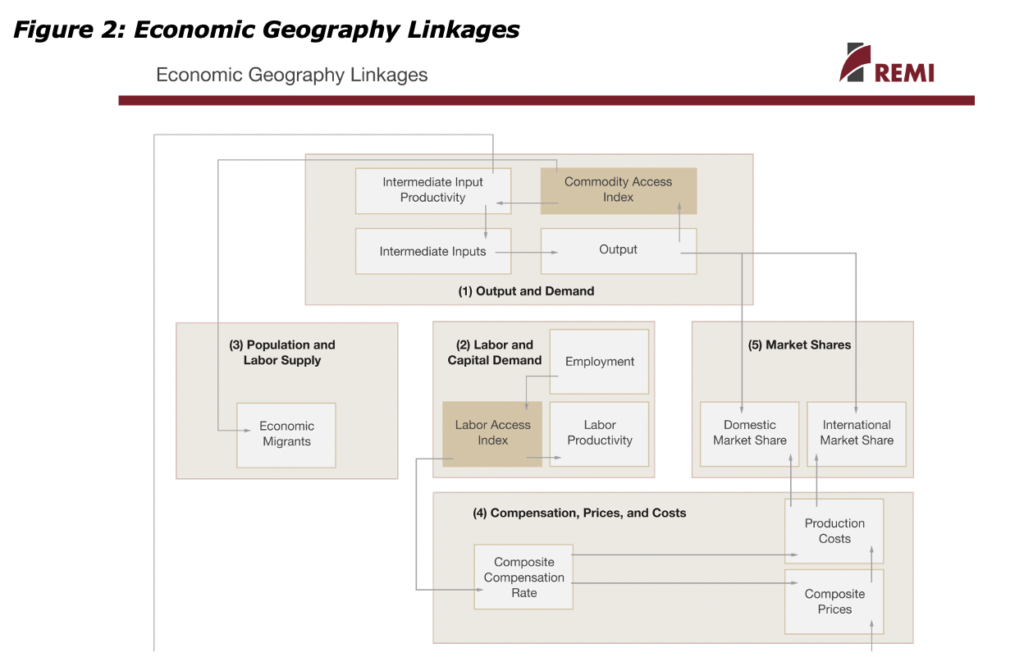
The Output and Demand block consists of output, demand, consumption, investment, government spending, exports, and imports, as well as feedback from output change due to the change in the productivity of intermediate inputs. The Labor and Capital Demand block includes labor intensity and productivity as well as demand for labor and capital. Labor force participation rate and migration equations are in the Population and Labor Supply block. The Compensation, Prices, and Costs block includes composite prices, determinants of production costs, the consumption price deflator, housing prices, and the compensation equations. The proportion of local, inter-regional, and export markets captured by each region is included in the Market Shares block.
Models can be built as single region, multi-region, or multi-region national models. A region is defined broadly as a sub-national area, and could consist of a state, province, county, or city, or any combination of sub-national areas.
Single-region models consist of an individual region, called the home region. The rest of the nation is also represented in the model. However, since the home region is only a small part of the total nation, the changes in the region do not have an endogenous effect on the variables in the rest of the nation.
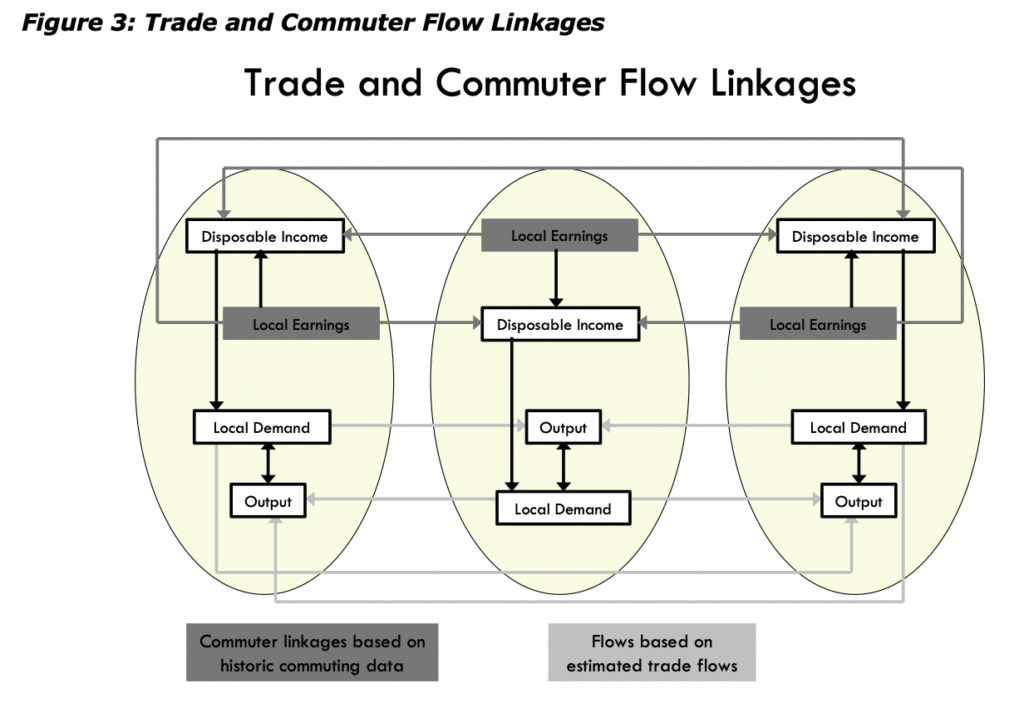
Multi-regional models have interactions among regions, such as trade and commuting flows. These interactions include trade flows from each region to each of the other regions. These flows are illustrated for a three-region model in Figure 3. There are also multi-regional price and wage cost linkages as shown in the Figure at the end of Section III.
Multiregional national models also include a central bank monetary response that constrains labor markets. Models that only encompass a relatively small portion of a nation are not endogenously constrained by changes in exchange rates or monetary responses.
Block 1. Output and Demand
This block includes output, demand, consumption, investment, government spending, import, commodity access, and export concepts. Output for each industry in the home region is determined by industry demand in all regions in the nation, the home region’s share of each market, and international exports from the region.
For each industry, demand is determined by the amount of output, consumption, investment, and capital demand on that industry. Consumption depends on real disposable income per capita, relative prices, differential income elasticities, and population. Input productivity depends on access to inputs because a larger choice set of inputs means it is more likely that the input with the specific characteristics required for the job will be found. In the capital stock adjustment process, investment occurs to fill the difference between optimal and actual capital stock for residential, non-residential, and equipment investment. Government spending changes are determined by changes in the population.
Block 2. Labor and Capital Demand
The Labor and Capital Demand block includes the determination of labor productivity, labor intensity, and the optimal capital stocks. Industry-specific labor productivity depends on the availability of workers with differentiated skills for the
occupations used in each industry. The occupational labor supply and commuting costs determine firms’ access to a specialized labor force.
Labor intensity is determined by the cost of labor relative to the other factor inputs, capital and fuel. Demand for capital is driven by the optimal capital stock equation for both non-residential capital and equipment. Optimal capital stock for each industry depends on the relative cost of labor and capital, and the employment weighted by capital use for each industry. Employment in private industries is determined by the value added and employment per unit of value added in each industry.
Block 3. Population and Labor Supply
The Population and Labor Supply block includes detailed demographic information about the region. Population data is given for age, gender, and ethnic category, with birth and survival rates for each group. The size and labor force participation rate of each group determines the labor supply. These participation rates respond to changes in employment relative to the potential labor force and to changes in the real after-tax compensation rate. Migration includes retirement, military, international, and economic migration. Economic migration is determined by the relative real after-tax compensation rate, relative employment opportunity, and consumer access to variety.
Block 4. Compensation, Prices and Costs
This block includes delivered prices, production costs, equipment cost, the consumption deflator, consumer prices, the price of housing, and the compensation equation. Economic geography concepts account for the productivity and price effects of access to specialized labor, goods, and services.
These prices measure the price of the industry output, taking into account the access to production locations. This access is important due to the specialization of production that takes place within each industry, and because transportation and transaction costs of distance are significant. Composite prices for each industry are then calculated based on the production costs of supplying regions, the effective distance to these regions, and the index of access to the variety of outputs in the industry relative to the access by other uses of the product.
The cost of production for each industry is determined by the cost of labor, capital, fuel, and intermediate inputs. Labor costs reflect a productivity adjustment to account for access to specialized labor, as well as underlying compensation rates. Capital costs include costs of non-residential structures and equipment, while fuel costs incorporate electricity, natural gas, and residual fuels.
The consumption deflator converts industry prices to prices for consumption commodities. For potential migrants, the consumer price is additionally calculated to include housing prices. Housing prices change from their initial level depending on changes in income and population density.
Compensation changes are due to changes in labor demand and supply conditions and changes in the national compensation rate. Changes in employment opportunities relative to the labor force and occupational demand change determine compensation rates by industry.
Block 5. Market Shares
The market shares equations measure the proportion of local and export markets that are captured by each industry. These depend on relative production costs, the estimated price elasticity of demand, and the effective distance between the home region and each of the other regions. The change in share of a specific area in any region depends on changes in its delivered price and the quantity it produces compared with the same factors for competitors in that market. The share of local and external markets then drives the exports from and imports to the home economy.
Tax-PI ties in factors of the regional economy or demographics into the budget. There is an example screen shot below. For instance, consumer and business spending at retail drives sales tax revenues for a state, but these revenues also influence the regional cost of living, real incomes, and the cost of doing business. A change in demographics, such as an anticipated “baby bulge” in the population from age 4 through age 18, would drive the demand for expenditures on public education higher in the future. This detailed association of the state budget with economic and demographic trends allows a single, static fiscal change to influence the economy, which will then echo back into the budget – by influencing revenue and expenditure changes in other budget categories – in dynamic scoring. For instance, lowering the sales tax rate will encourage a higher rate of migration and more net commuters living in Connecticut. Therefore, the state might be able to capture some of its revenues back through income tax revenues (from the new residents, coming to the state in search of a lower cost of living and lower net taxes) or income/sales tax revenues on the increase in business activity. This allows for dynamic scoring with all key economic and demographic responses. Figure 4 as shown on the following page provides an overview of the Tax-PI model structure and approach.
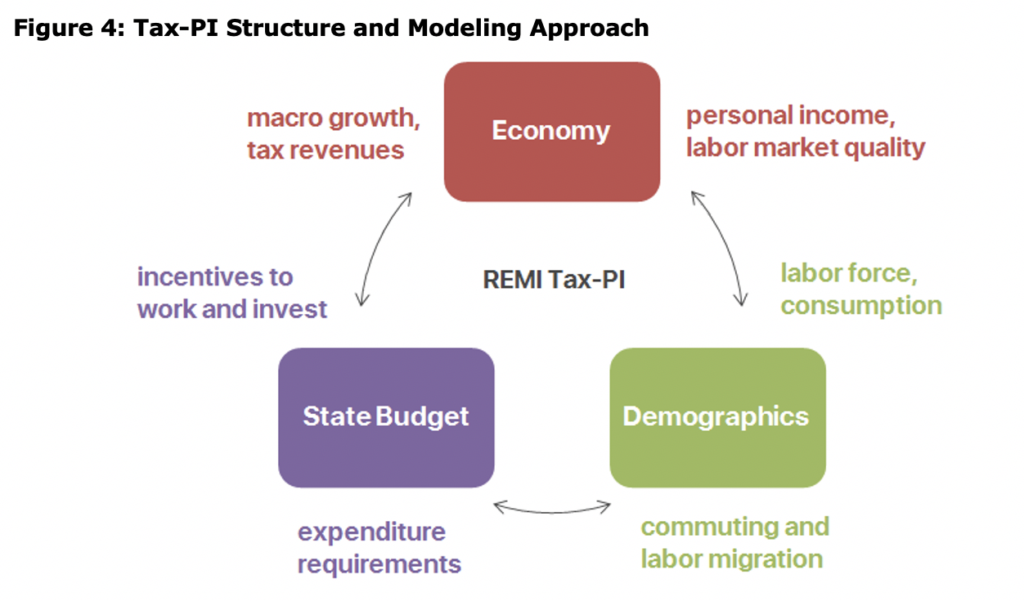
The above flowchart shows graphically some of the effects described in the previous paragraph and Tax-PI overall. The economy drives revenues and creates income for households, but fiscal policy in the region affects incentives and shifting demographics changes consumption patterns and growth in the labor force. Demographics reacts to fiscal policy in terms of commuting and location decisions while influencing long-term expenditure needs for healthcare, education, and other items. The state budget influences both firm and household locations through incentives but (in the long-term) must reflect the needs of the state’s demographics and the revenues available from macroeconomic growth. Dynamic scoring comes from when an initial, static tax change – clockwise from the bottom-left to the top – induces economic and demographic changes that then change the state budget situation across all revenue and expenditure categories, producing a dynamic economic and fiscal impact in a consistent structure.
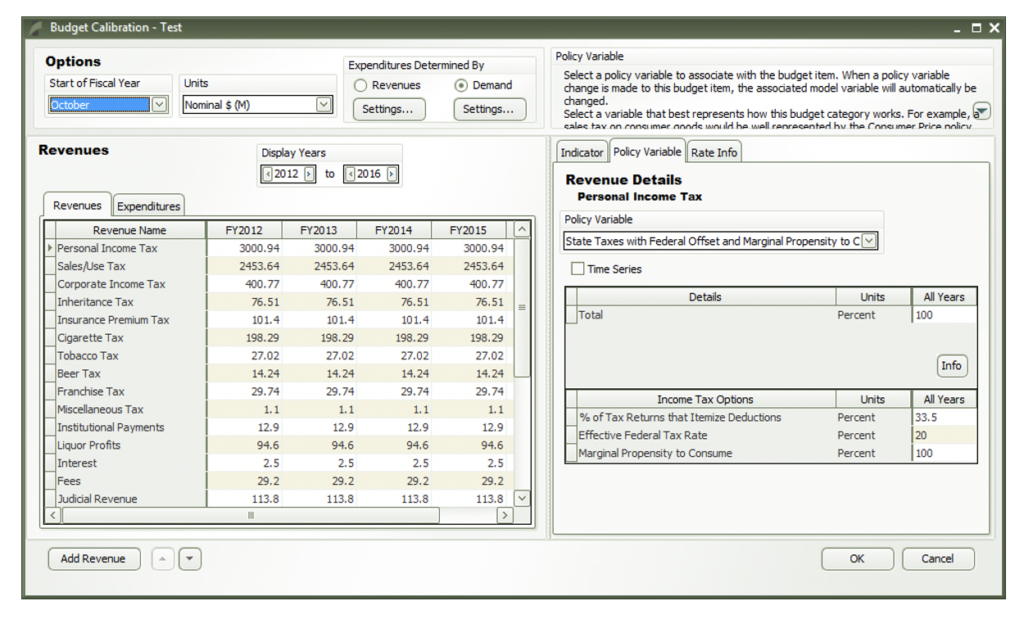 The above screen shot is an example calibration of Tax-PI. This screen links customized revenue categories to revenue generation (for the income tax, additional personal income net of transfer receipts) and the behavioral response (higher state taxes with adjustments to federal deductibility and a marginal propensity to consume). This allows further customization of expenditures, the start of the fiscal year, and balanced budgets.
All equations, assumptions, and linkages are available publicly and peer reviewed.xvi This includes the equations and structure,xvii data sources and estimation procedures,xviii and the calibration procedure and interface guide for Tax-PI.xix The REMI staff will also provided unlimited training and technical support with the Tax-PI model, as spelled out in the user agreement, to further clients’ understanding of the underlying model and aid in working with the graphical user interface (GUI) of the program.
i https://www.sos.state.co.us/pubs/elections/Initiatives/titleBoard/filings/2019-2020/306FiscalImpact.pdf
ii http://leg.colorado.gov/sites/default/files/images/decforecast.pdf
iii https://leg.colorado.gov/agencies/legislative-council-staff/individual-income-tax%C2%A0
iv https://www.colorado.gov/pacific/sites/default/files/2019_Annual_Report_1.pdf
v https://www.congress.gov/bill/115th-congress/house-bill/1/text
vi https://leg.colorado.gov/sites/default/files/federal_tax_legislation_interested_persons_memo_1112018_0.pdf
vii https://leg.colorado.gov/sites/default/files/documents/2020A/bills/fn/2020a_hb1420_f1.pdf
viii https://www.jct.gov/publications.html?func=startdown&id=5050
ix https://budgetmodel.wharton.upenn.edu/issues/2017/11/7/the-tax-cuts-and-jobs-act-dynamic-effect
x https://taxfoundation.org/2017-tax-cuts-jobs-act-analysis/
xi https://www.cbo.gov/publication/50919
xii https://leg.colorado.gov/sites/default/files/r19-1334_dynamic_modeling.pdf
xiii https://www.sos.state.co.us/pubs/elections/Initiatives/titleBoard/filings/2019-2020/306FiscalImpact.pdf
xiv https://assets.ey.com/content/dam/ey-sites/ey-com/en_us/news/2019/10/ey-total-state-and-local-business-taxes-october-2019.pdf
xv https://www.sba.gov/funding-programs/loans/coronavirus-relief-options/paycheck-protection-program
xvi Full documentation page, <http://www.remi.com/resources/documentation>
xvii http://www.remi.com/download/documentation/pi+/pi+_version_1.7/PI+_v1.7_Model_Equations.pdf
xviii http://tinyurl.com/remidatasources
xix http://www.remi.com/download/documentation/tax-pi/tax-pi_version_1.0/Getting_Started_with_Tax-PI_v1-0-3.pdf